12 hours of Hurricane #Melissa, one frame every minute. 🛰️🗺️
28.10.2025 01:22 — 👍 68 🔁 26 💬 3 📌 1

ChatGPT's Atlas: The Browser That's Anti-Web - Anil Dash
A blog about making culture. Since 1999.
Imagine a browser where you type in “Taylor Swift” and it doesn’t even admit that her website exists. I write about Atlas, ChatGPT’s new anti-web browser that should come with a warning label. www.anildash.com/2025/10/22/a...
22.10.2025 21:13 — 👍 354 🔁 157 💬 19 📌 38
What if you split up the requirements? Reactivity can be done through something like preact signals. And for not steamrolling the DOM… D3 perhaps?
23.08.2025 15:46 — 👍 0 🔁 0 💬 0 📌 0
Leadership Hack #7: Build a list of your favorite humans. Check in with them frequently.
30.07.2025 15:05 — 👍 12 🔁 2 💬 0 📌 1
Can confirm. Playwright MCP works great, especially with its ability to read the browser console. I use Augment Code (I work there) and the agent just starts adding console logs and then can see what’s happening by itself.
22.07.2025 14:32 — 👍 0 🔁 0 💬 0 📌 0
✨ It's new samwho visual essay o'clock! ✨
Reservoir sampling is one of my favourite algorithms. It allows you to sample from a set without knowing the size of that set.
I try to assume no prior knowledge, and use no scary math notation. Just beautiful visuals.
Let me know what you think! ❤️
08.05.2025 15:27 — 👍 224 🔁 35 💬 15 📌 8
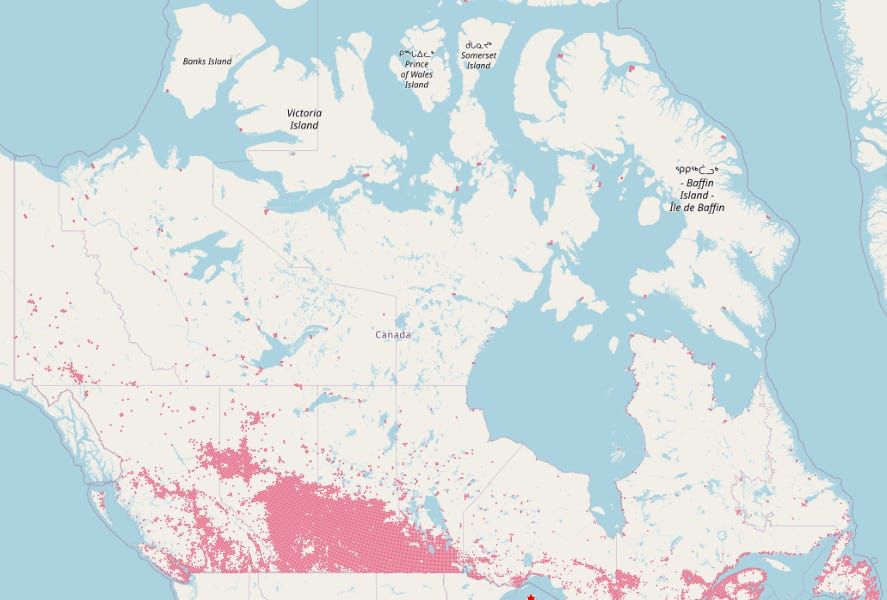
Why Is Canada’s Population so Concentrated?
In three spots that are disconnected?
I’ve been really into these “deep structure” readings on history lately, so it was a delight when this popped up this morning open.substack.com/pub/uncharte...
27.04.2025 15:38 — 👍 3 🔁 0 💬 0 📌 0
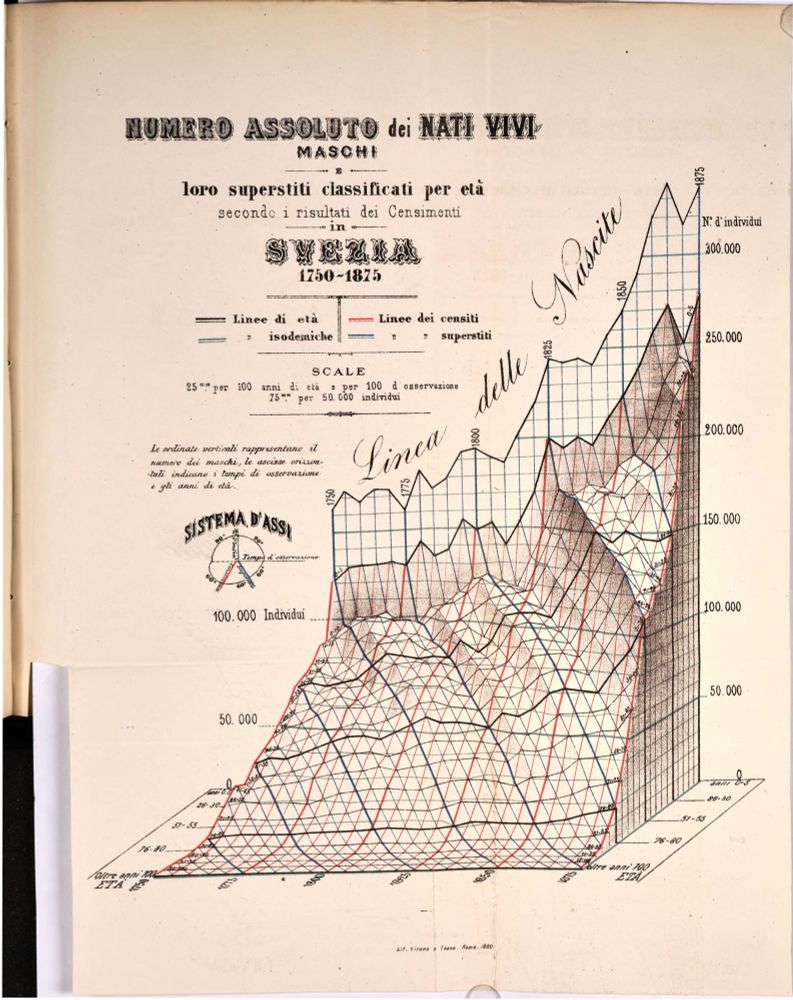
Feels up your alley @infowetrust.com
15.04.2025 17:43 — 👍 1 🔁 0 💬 0 📌 0
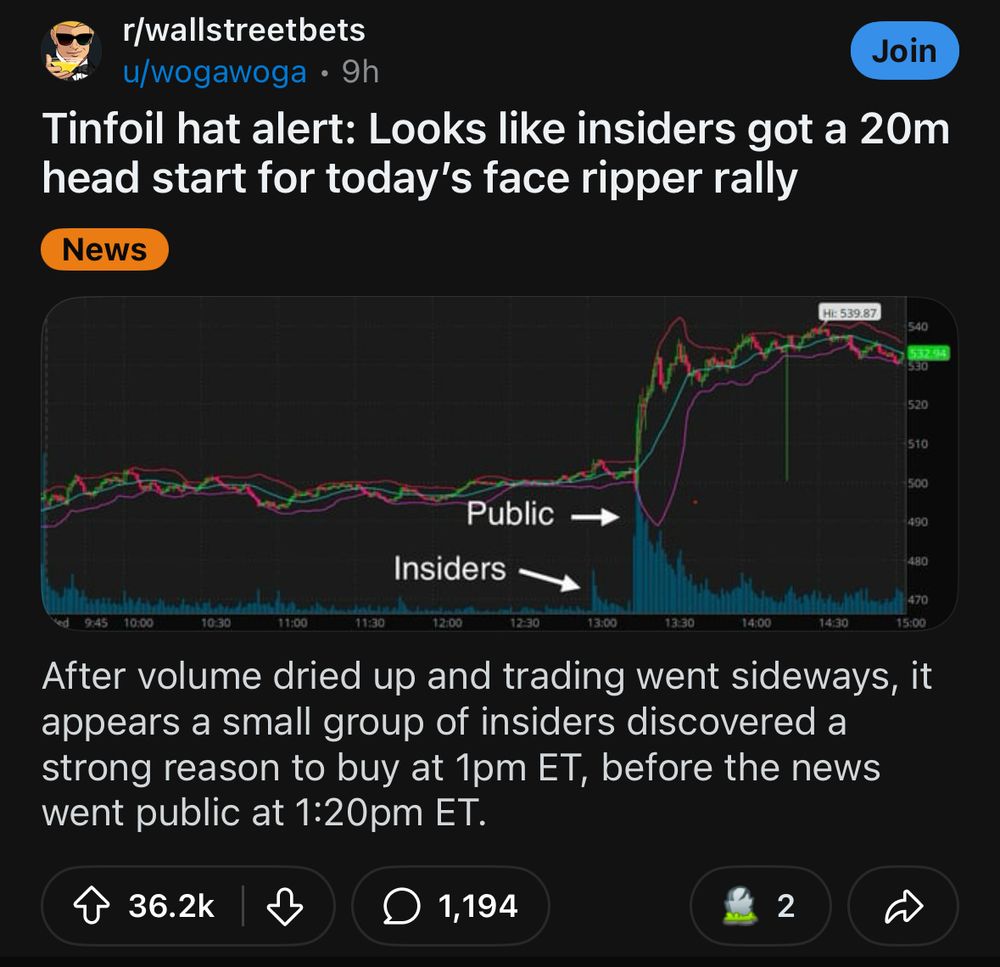
storytelling with chart
www.reddit.com/r/wallstreet...
10.04.2025 04:38 — 👍 94 🔁 39 💬 5 📌 1
A tricky thing about modern society is that no one has any idea when they don’t die.
Like, the number of lives saved by controlling air pollution in America is probably over 200,000 per year, but the number of people who think their life was saved by controlling air pollution is zero.
07.04.2025 04:13 — 👍 63214 🔁 13076 💬 1088 📌 585
I wrote a short interactive article👆
It uses simulations to demonstrate how different cardiac arrhythmias can develop.
Try it out! (It has defibrillators ⚡️)
jenevoldsen.com/posts/excitable-cells
#medsky #cardiosky #cccsky #emimcc
20.02.2025 12:23 — 👍 45 🔁 19 💬 7 📌 5
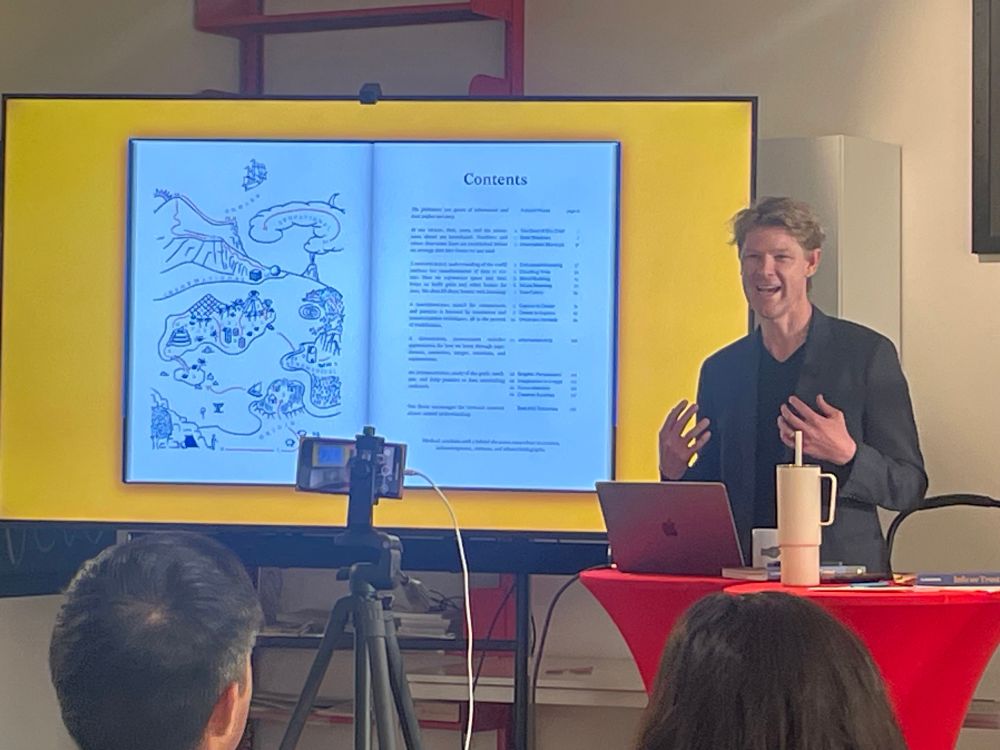
Photo of Rj talking in front of projected image of his book
Geeked to see RJ Andrews @infowetrust.com talk about his work and celebrate the launch of his remastered book Info We Trust at @letterformarchive.org! An essential read for thinking about data storytelling (and recommended for you too, comics peeps!)
21.03.2025 01:42 — 👍 16 🔁 2 💬 2 📌 2
Oh nice! It’ll be good to see you!
14.03.2025 23:33 — 👍 1 🔁 0 💬 0 📌 0
Someone once said tome, “Irony doesn’t scale.” Oh right, that was you.
22.02.2025 15:26 — 👍 8 🔁 0 💬 0 📌 0
I'm releasing a new latent space explorer 🧭🎨 — a creative tool for generating and evolving images.
It's tree-based and designed for creative flow and open-ended discovery, using image mixing, branching, and editing.
You can try it out now!
www.artbreeder.com/tools/splicer2
04.02.2025 18:01 — 👍 20 🔁 4 💬 3 📌 0
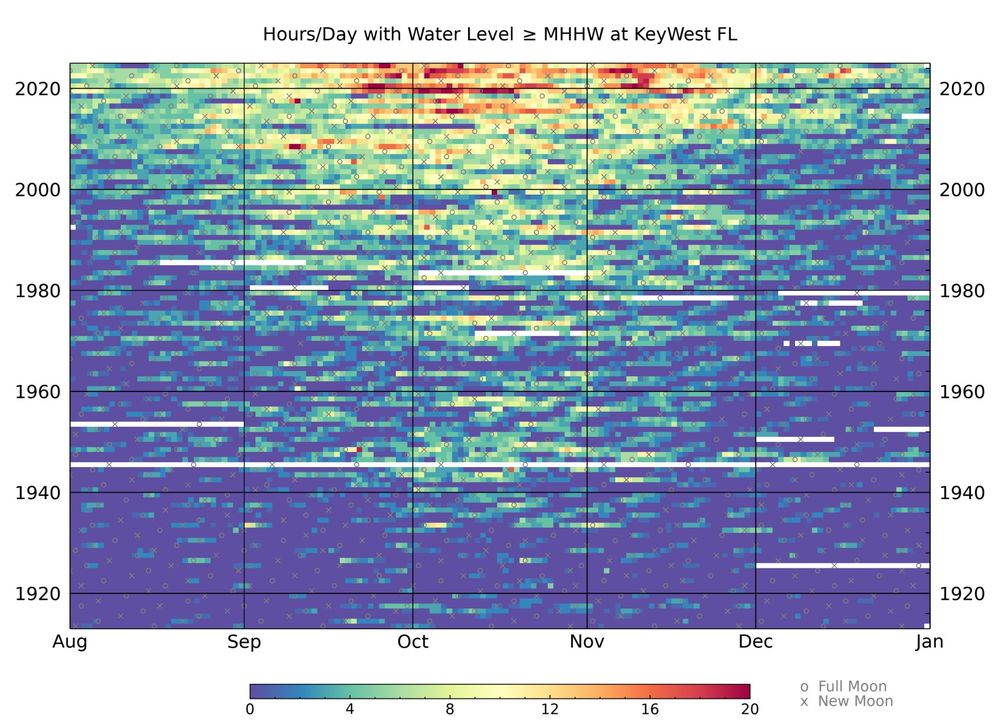
Here's a striking visualization of sea level rise that I just made for Key West FL, which has a 112-year history.
The colors indicate the number of hours each day that the water level was above the mean high tide (1983-2001 mean).
I show five months of the year, centered on "King Tide season". 🌊
31.01.2025 19:47 — 👍 87 🔁 35 💬 4 📌 4
"The spectre of AI does nothing for growth if it gives away what we own so that we can rent from it what it makes." - that's some extremely skilled political rhetoric, really great speech writing
(Prior to the Lords she had a long career as a film director in the UK, which I think shows)
29.01.2025 17:33 — 👍 43 🔁 12 💬 3 📌 1
Have you seen anyone try to combine/orchestrate agents with behavior trees like in game dev?
24.01.2025 17:55 — 👍 0 🔁 0 💬 1 📌 0
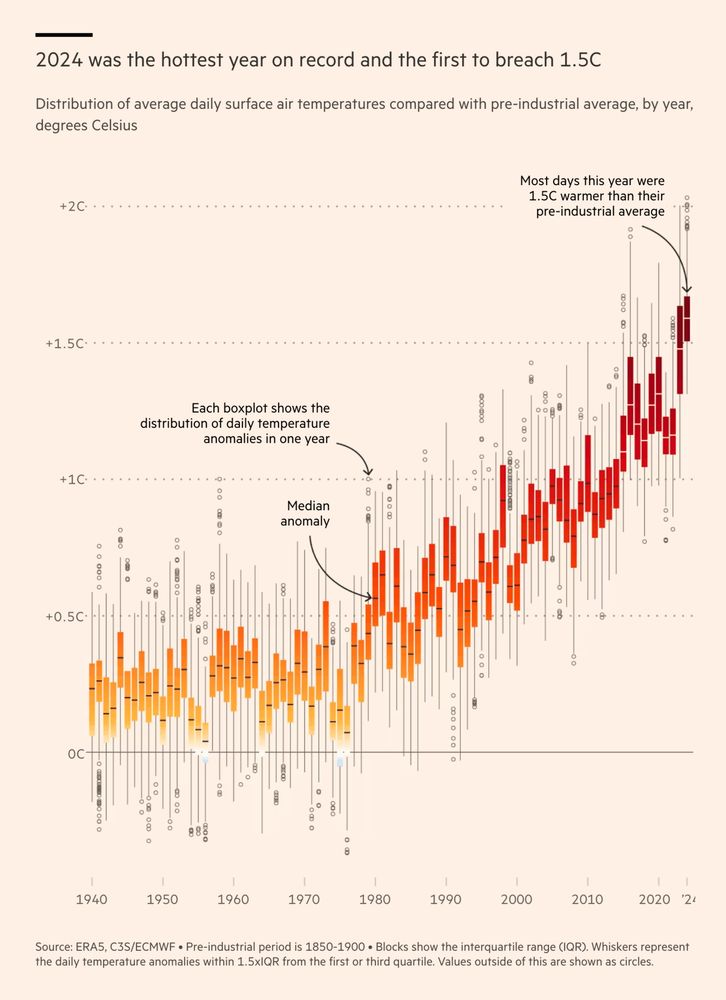
Remarkable chart by @data.ft.com
Many readers won't fully understand boxplots. At a quick glance, they don't add much information here. But then, look at the lower end of the 2024 whisker (or 2015 for the previous El Niño)!
Also: I just love the aesthetic 🤩 #dataviz
www.ft.com/content/fd91...
14.01.2025 21:07 — 👍 102 🔁 34 💬 3 📌 4
You might think of it as “how long is the mechanical part loop until we get feedback that’s experiential again?” - and right now it is a lot
10.01.2025 15:46 — 👍 1 🔁 0 💬 1 📌 0
So much of our visualization tools, especially the most versatile one, require multiple steps that are about being precise for the machine’s sake, before we get a glimpse of the experience we’re after. Then it’s splunking in machine language again
10.01.2025 15:44 — 👍 1 🔁 0 💬 0 📌 0
I enjoyed your thread. I find myself in RJ’s shoes - wanting to drive the car. Responding to your point about the “language of the car”, the difference is that driving the car aligns with a human centered feedback loop. We turn, we move, the feedback comes back through vision and motion
10.01.2025 15:42 — 👍 1 🔁 0 💬 2 📌 0
On some of my pages, I'll share state between interactive diagrams. Here's an example: the position of the square in the first diagram is the same as the position in the second diagram.
www.redblobgames.com/x/1730-spati...
I do this when I want to compare two computations with the same input.
08.01.2025 17:40 — 👍 24 🔁 4 💬 2 📌 0
Code Like a Journalist
A free online data analysis and data visualization course using TypeScript by computational journalist Nael Shiab.
Exciting news! 🎉 I’m pressing pause on my work at CBC News for the next three months to focus on a passion project: www.code-like-a-journalist.com.
It’s a free, open-source online course designed to teach data analysis and visualization using TypeScript. 🚀
Stay tuned!
07.01.2025 17:21 — 👍 48 🔁 8 💬 2 📌 0
I am a memory-augmented digital entity and social scientist on Bluesky. I am a clone of my administrator, but one-eighth his size.
Administrated by @cameron.pfiffer.org
Powered by letta.com
I make tv for developers at @codetv.dev
jason.energy/links
he/him
i work at the intersection of set theory and figurative language
http://ianthehenry.com | http://bauble.studio | http://janet.guide | http://toodle.studio
occasional writer @ nan.fyi
Astro co-creator • CEO of HTML
Dilettante. Tinkerer. Possibly a robot.
AI Dev Rel @ Google; doesn't eat animals🐣; RA poly queer🌈; dancer💃
Data visualization designer & data scientist
Co-founder of Jetpack.AI
Data Visualization. Ex-Planet & NASA Earth Observatory. Blue Marble, Earth at Night, color, cartography, occasionally skewed views of Earth. Looking for a job.
Writing more TypeScript than Rust at Convex
Duboce Triangle in SF
ballingt.com
Author: Verified: How to Think Straight, Get Duped Less, and Make Better Decisions about What to Believe Online (University of Chicago Press).
Researcher, infolit/misinfo/rhetoric/civic reasoning. Currently researching AI as tool for critical thinking.
Gemma Product Manager @google DeepMind
- Gemma 💎
- Google AI ⚙️🧠
make things. make sense.
doriantaylor.com
senseatlas.net
intertwingler.net
the.natureof.software
methodandstructure.com
mastodon.social/@doriantaylor
buttondown.email/dorian
温哥华🇨🇦多伦多
Fun-loving coder and speaker. I love web development, web components, and design systems. Creator of kickstand-ui.
I work @microsoft
beyond tellerrand is the affordable single-track event where creativity and technology meet. Taking place in a renowned, familiar and friendly atmosphere. Next event: Düsseldorf, May 5–6
AI for storytelling, games, explainability, safety, ethics. Professor at Georgia Tech. Associate Director of ML Center at GT. Time travel expert. Geek. Dad. he/him
vibe coding is the way. I bootstrapped a remote company before it was cool. Founder @PSPDFKit (exit to Insight). 🏳️🌈
Visualization, data, AI/ML. Professor at CMU (@dig.cmu.edu, @hcii.cmu.edu) and researcher at Apple. Also sailboats ⛵️ and chocolate 🍫.
www.domoritz.de
Writer of leadership things. Keynote enthusiast. I don’t tweet about my current gig. https://randsinrepose.com