5/5
Refs (contd.):
Onshore Wind: www.renewableuk.com/energypulse/...
Solar PV: en.wikipedia.org/wiki/Solar_p...
Remote Island Wind: www.ofgem.gov.uk/sites/defaul...
09.08.2025 10:44 — 👍 0 🔁 0 💬 0 📌 0
4/5
Refs:
Capacity Awarded: Commons Library researchbriefings.files.parliament.uk/documents/CB...
⸻
Capacity factors are based on historic UK data:
Offshore Wind: energynumbers.info/uk-offshore-...
Nuclear: assets.publishing.service.gov.uk/media/5c9a5d...
09.08.2025 10:44 — 👍 0 🔁 0 💬 1 📌 0
3/5
The technology with the largest awarded capacity is offshore wind, both by nameplate capacity and effective capacity.
Nuclear, with just the one CfD project, Hinkley Point C, is second if capacity factor is taken into account.
Onshore Wind has greater effective awarded capacity than Solar PV.
09.08.2025 10:44 — 👍 0 🔁 0 💬 1 📌 0
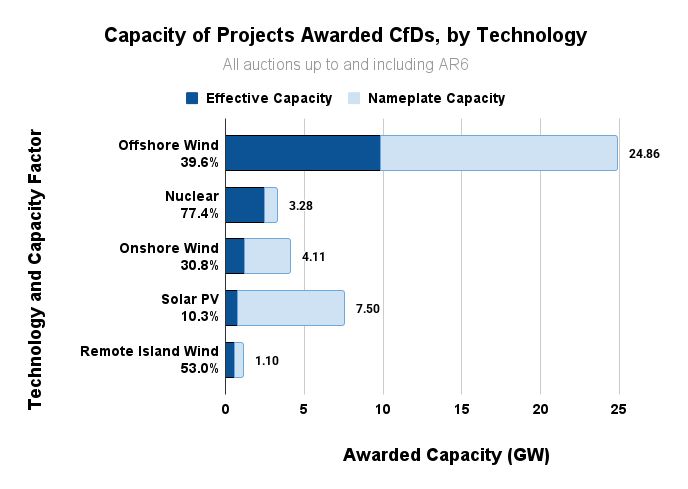
A chart of the capacity of projects awarded CfDs, by technology,
for the five highest capacity technologies,
showing the nameplate capacity and the effective capacity when the capacity factor is taken into account.
The data includes all CfD auctions up to AR6.
2/5
Here's the total capacity of projects awarded CfDs, by technology.
The chart shows both the awarded nameplate capacity and the effective capacity when the capacity factor is taken into account.
All CfD auction rounds up to and including AR6 (outcome Sept. 2024) are included.
👇
09.08.2025 10:44 — 👍 0 🔁 0 💬 1 📌 0
UK's Seventh CfD Allocation Round Launched
The UK government has launched this year's Contracts for Difference (CfD) Allocation Round 7 (AR7), with the application window open until 27 August.
1/5
With Allocation Round 7 of the UK's Contracts for Difference scheme kicking off,
here's some more background info about the CfD scheme.
This time I'll look at the total generating capacity with CfDs for the five largest technology types (by nameplate capacity awarded).
🧵
09.08.2025 10:44 — 👍 0 🔁 0 💬 1 📌 0
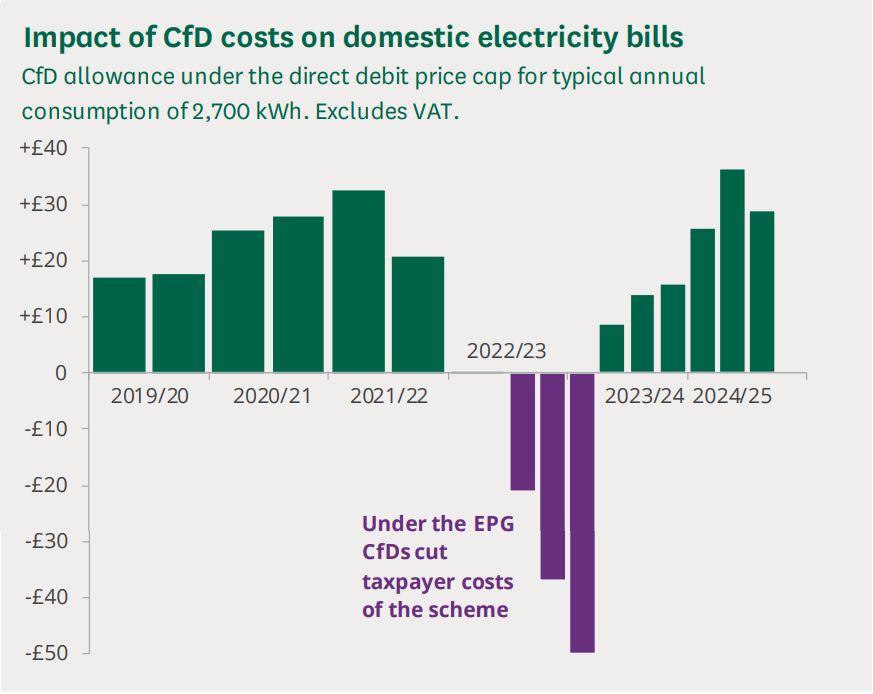
Impact of CfD costs on domestic electricity bills
A graph showing the CfD allowance under the direct debit price cap for typical annual consumption of 2,700 kWh. Excludes VAT.
The graph shows half yearly figures, and later data for quarters, but it refers to costs if that rate were to apply across a whole year.
Source: Ofgem, Energy price cap (default tariff): 1 October to 31 December 2024, Annex 2 – Wholesale
cost allowance methodology v1.18
9/9
What's the cost of CfDs to consumers?
The CfD allowance added about £100 to an "average" (2700 kWh/yr) domestic electricity bill between Apr. 2019 and Dec. 2024.
That's 2.9% of the bill, or about £17/yr.
👇
⸻
Ref: Commons Library researchbriefings.files.parliament.uk/documents/CB...
08.08.2025 10:29 — 👍 1 🔁 0 💬 0 📌 0
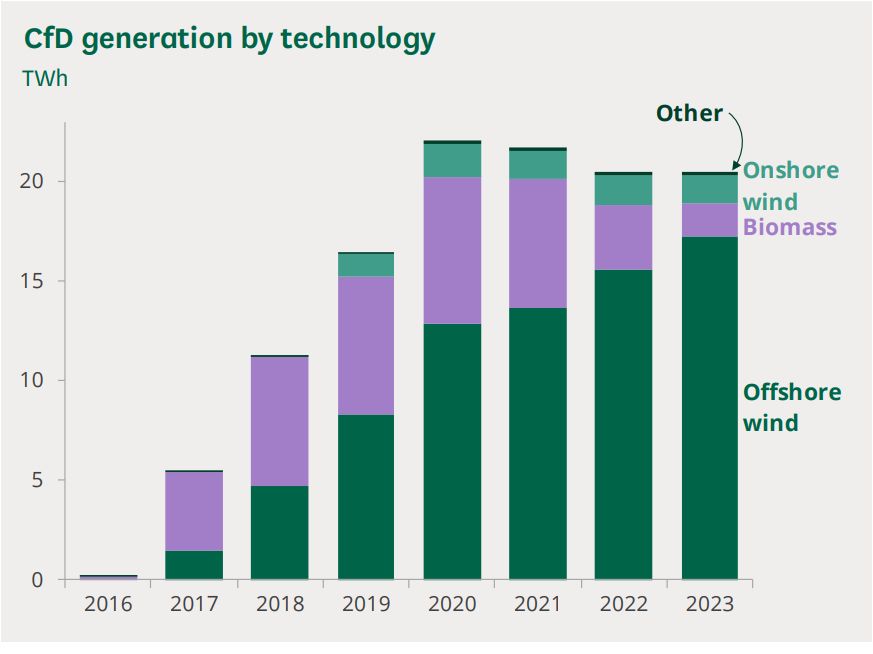
CfD generation by technology
A chart showing CfD generation by technology, in terawatt-hours per year, for the years 2016 to 2023.
CfD generation is dominated by offshore wind.
CfD generation peaked at 22 TWh in 2020, then fell slightly in the following three years due to falling output from biomass plants.
(Most solar CfD projects have intended delivery years from 2024 onwards).
Source: LCCC, Actual CfD Generation and avoided GHG emissions dataset
8/9
Electricity generation financed by CfD contracts reached a peak at 22 TWh in 2020 (7% of total generation), then fell slightly due to falling output from biomass plants.
CfD generation is dominated by offshore wind:
⸻
Ref: Commons Library researchbriefings.files.parliament.uk/documents/CB...
08.08.2025 10:29 — 👍 0 🔁 0 💬 1 📌 0
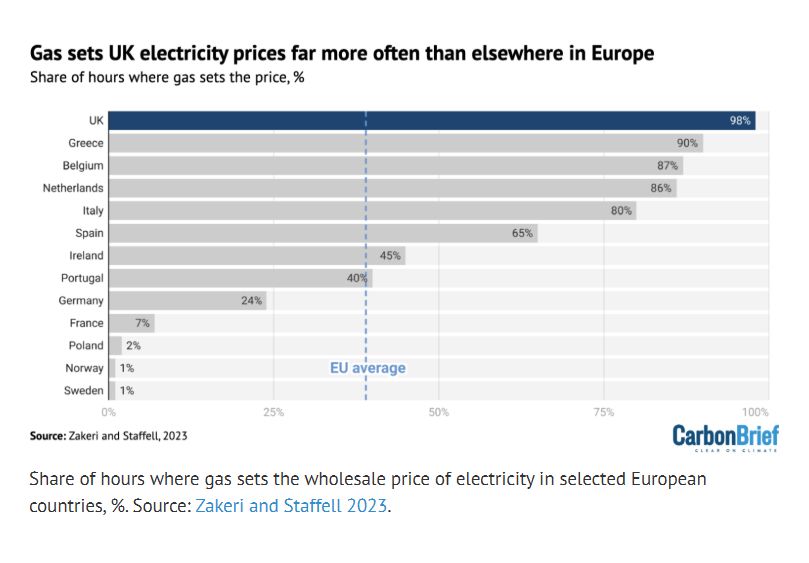
Gas sets UK electricity prices far more often than elsewhere in Europe.
A chart showing the share of hours where gas sets the wholesale price of electricity in the UK and selected other European countries.
Gas sets the wholesale price of electricity in the UK 98% of the time, far more than elsewhere in Europe.
CarbonBrief. Source: Zakeri and Staffell, 2023.
7/9
CfD levy payments from electricity suppliers are still positive most of the time, and CfD prices in aggregate are generally still above the wholesale market price of electricity.
The market price of electricity in the UK is set by gas 98% of the time: 👇
www.carbonbrief.org/factcheck-wh...
08.08.2025 10:29 — 👍 0 🔁 0 💬 1 📌 0
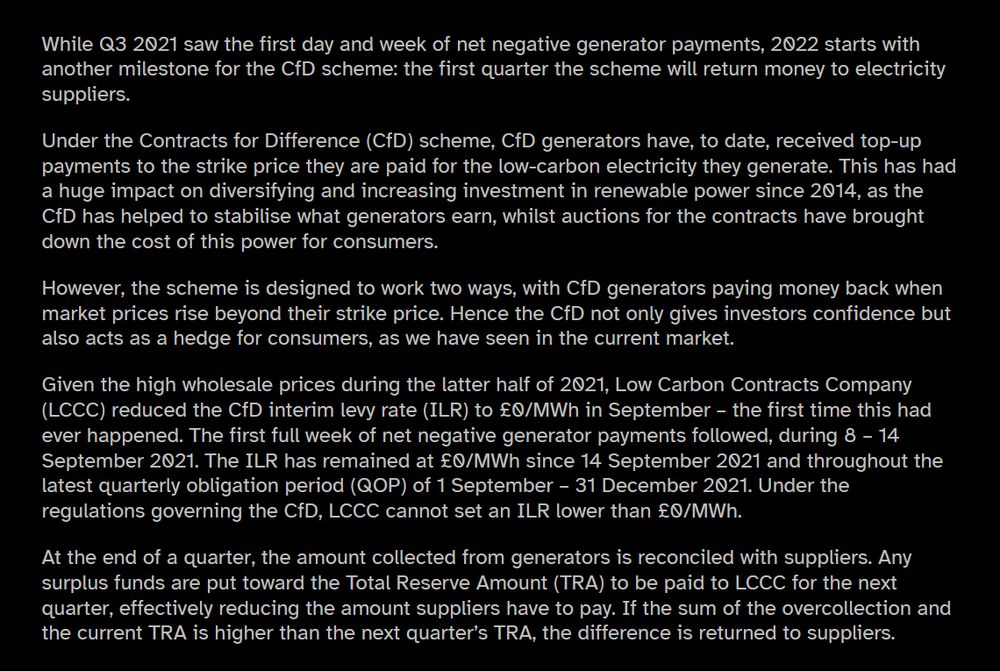
Reconciliation of Q4 2021 payments sees CfD portfolio paying back to electricity suppliers
Low Carbon Contracts Company. Posted 12.01.2022
While Q3 2021 saw the first day and week of net negative generator payments, 2022 starts with another milestone for the CfD scheme: the first quarter the scheme will return money to electricity suppliers.
Under the Contracts for Difference (CfD) scheme, CfD generators have, to date, received top-up payments to the strike price they are paid for the low-carbon electricity they generate. This has had a huge impact on diversifying and increasing investment in renewable power since 2014, as the CfD has helped to stabilise what generators earn, whilst auctions for the contracts have brought down the cost of this power for consumers.
However, the scheme is designed to work two ways, with CfD generators paying money back when market prices rise beyond their strike price. Hence the CfD not only gives investors confidence but also acts as a hedge for consumers, as we have seen in the current market.
Given the high wholesale prices during the latter half of 2021, Low Carbon Contracts Company (LCCC) reduced the CfD interim levy rate (ILR) to £0/MWh in September – the first time this had ever happened. The first full week of net negative generator payments followed, during 8 – 14 September 2021. The ILR has remained at £0/MWh since 14 September 2021 and throughout the latest quarterly obligation period (QOP) of 1 September – 31 December 2021. Under the regulations governing the CfD, LCCC cannot set an ILR lower than £0/MWh.
At the end of a quarter, the amount collected from generators is reconciled with suppliers. Any surplus funds are put toward the Total Reserve Amount (TRA) to be paid to LCCC for the next quarter, effectively reducing the amount suppliers have to pay. If the sum of the overcollection and the current TRA is higher than the next quarter’s TRA, the difference is returned to suppliers.
6/9
The first ever negative CfD payments, in Q3 2021, were featured in a press release from LCCC.
The Interim Levy Rate had a price floor of £0/MWh and couldn't go negative, so the money was returned to electricity suppliers after the end of the quarter.
www.lowcarboncontracts.uk/news/reconci...
08.08.2025 10:29 — 👍 0 🔁 0 💬 1 📌 0
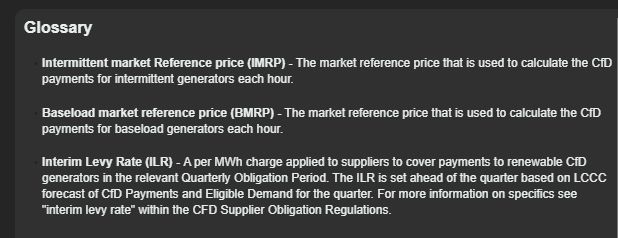
CfD Historical Data - Further Information
LCCC
Glossary
Intermittent market reference price (IMRP) - The market reference price that is used to calculate the CfD payments for intermittent generators each hour.
Baseload market reference price (BMRP) - The market reference price that is used to calculate the CfD payments for baseload generators each hour.
Interim Levy Rate (ILR) - A per MWh charge applied to suppliers to cover payments to renewable CfD generators in the relevant Quarterly Obligation Period. The ILR is set ahead of the quarter based on LCCC forecast of CfD Payments and Eligible Demand for the quarter. For moe information on specifics see "interim levy rate" within the CFD Supplier Obligation Regulations.
5/9
The LCCC operates two reference prices for CfD payment calculations,
an Intermittent Market Reference Price (IMRP) for intermittent generators, and
a Baseload Market Reference Price (BMRP) for baseload generators.
They're usually close to each other.
www.lowcarboncontracts.uk/resources/sc...
08.08.2025 10:29 — 👍 0 🔁 0 💬 1 📌 0
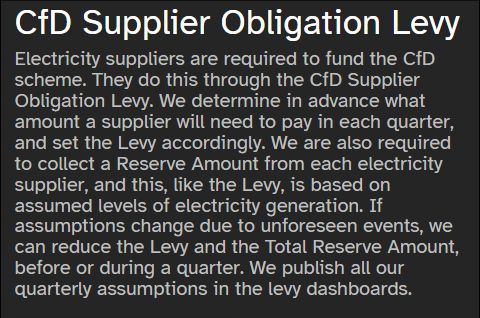
CfD Supplier Obligation Levy
LCCC
Electricity suppliers are required to fund the CfD scheme. They do this through the CfD Supplier Obligation Levy. We determine in advance what amount a supplier will need to pay in each quarter, and set the Levy accordingly. We are also required to collect a Reserve Amount from each electricity supplier, and this, like the Levy, is based on assumed levels of electricity generation. If assumptions change due to unforeseen events, we can reduce the Levy and the Total Reserve Amount, before or during a quarter. We publish all our quarterly assumptions in the levy dashboards.
4/9
All electricity suppliers must pay the Supplier Obligation Levy to finance CfD payments.
It is paid quarterly, but an Interim Levy Rate is set as a FORECAST levy per MWh for the quarter ahead, to enable daily pre-payments from suppliers.
⸻
LCCC: www.lowcarboncontracts.uk/our-schemes/...
08.08.2025 10:29 — 👍 0 🔁 0 💬 1 📌 0
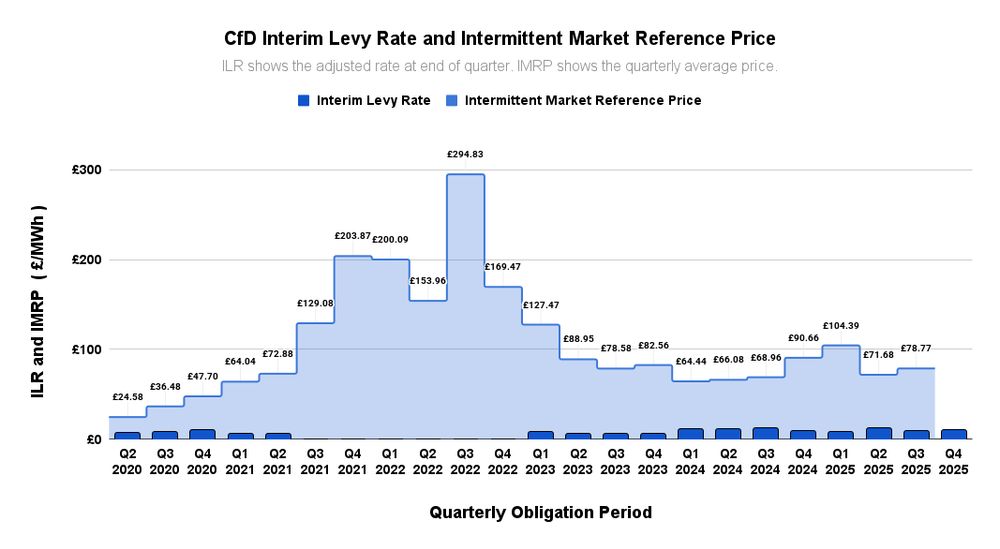
A graph showing the CfD Interim Levy Rate and the Intermittent Market Reference Price for each Quarterly Obligation Period from Q2 2020 to Q4 2025.
The ILR is the adjusted rate at the end of each quarter, the IMRP is the quarterly average price.
The Intermittent Market Reference Price ranged between £129/MWh and £295/MWh during the gas price crisis of Q3 2021 to Q4 of 2022,
when the Interim Levy Rate fell to zero.
At other times the ILR has ranged between £24/MWh and £127/MWh.
3/9
Here's the same ILR data, with the Intermittent Market Reference Price (IMRP).
The IMRP is the reference price for CfD payments to intermittent generators.
CfD levy payments hit zero when the market price rose above ~ £130/MWh.
⸻
Ref: LCCC Dashboard www.lowcarboncontracts.uk/resources/sc...
08.08.2025 10:29 — 👍 0 🔁 0 💬 1 📌 0
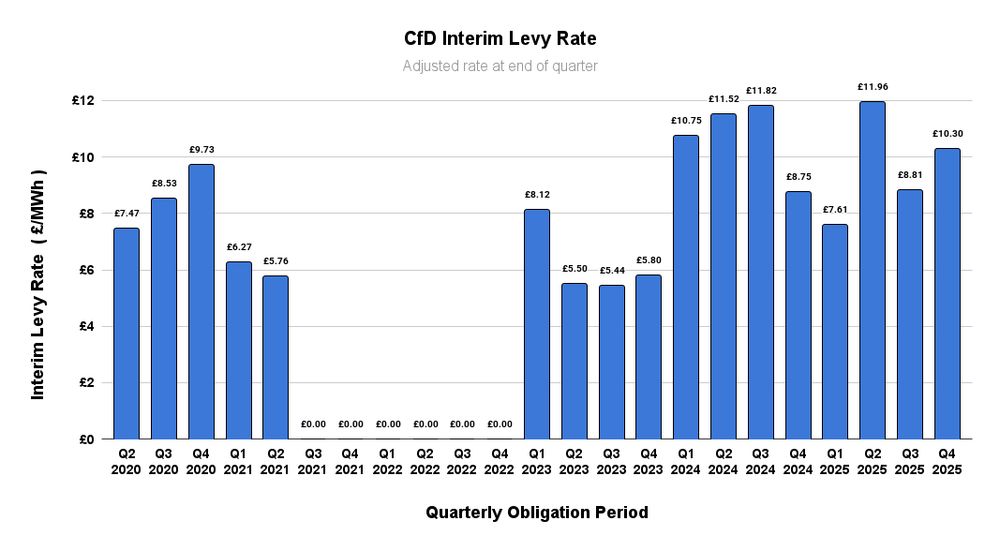
A graph showing the CfD Interim Levy Rate for each Quarterly Obligation Period from Q2 2020 to Q4 2025.
It shows the adjusted rate at the end of each quarter.
The ILR ranged from about £5/MWh to £12/MWh over this period,
except during the gas price crisis from Q3 2021 to Q4 2022, when it was at zero.
2/9
Here's the the Interim Levy Rate (ILR), the amount paid per MWh by all electricity suppliers to fund CfD payments. 👇
The ILR is currently £8.81/MWh, but it hit zero from Q3 2021 to Q4 2022, during the gas price crisis.
⸻
Ref: EMR Settlement www.emrsettlement.co.uk/settlement-d...
08.08.2025 10:29 — 👍 0 🔁 0 💬 1 📌 0
1/9
The Application Window for Allocation Round 7 of the UK's Contracts for Difference scheme for low carbon electricity opened yesterday.
The CfD scheme is run by the Low Carbon Contracts Company (LCCC) and the Electricity Settlements Company.
Here's how CfD payments have worked out to date:
🧵
08.08.2025 10:29 — 👍 0 🔁 0 💬 1 📌 0
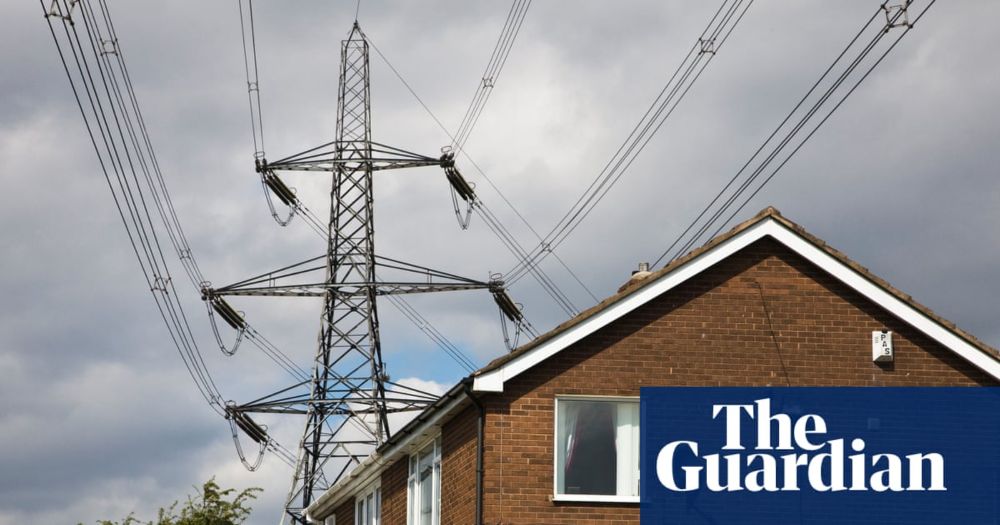
UK ministers push ahead with discount on bills for households near new pylons
Plans have provoked outrage from communities in areas of Great Britain expected to host new infrastructure
❝ Under the plan, local people could receive a £125 discount every six months as the UK prepares to build twice as much new power grid infrastructure over the next five years as it has built in the past decade.❞
08.08.2025 09:51 — 👍 0 🔁 0 💬 0 📌 0
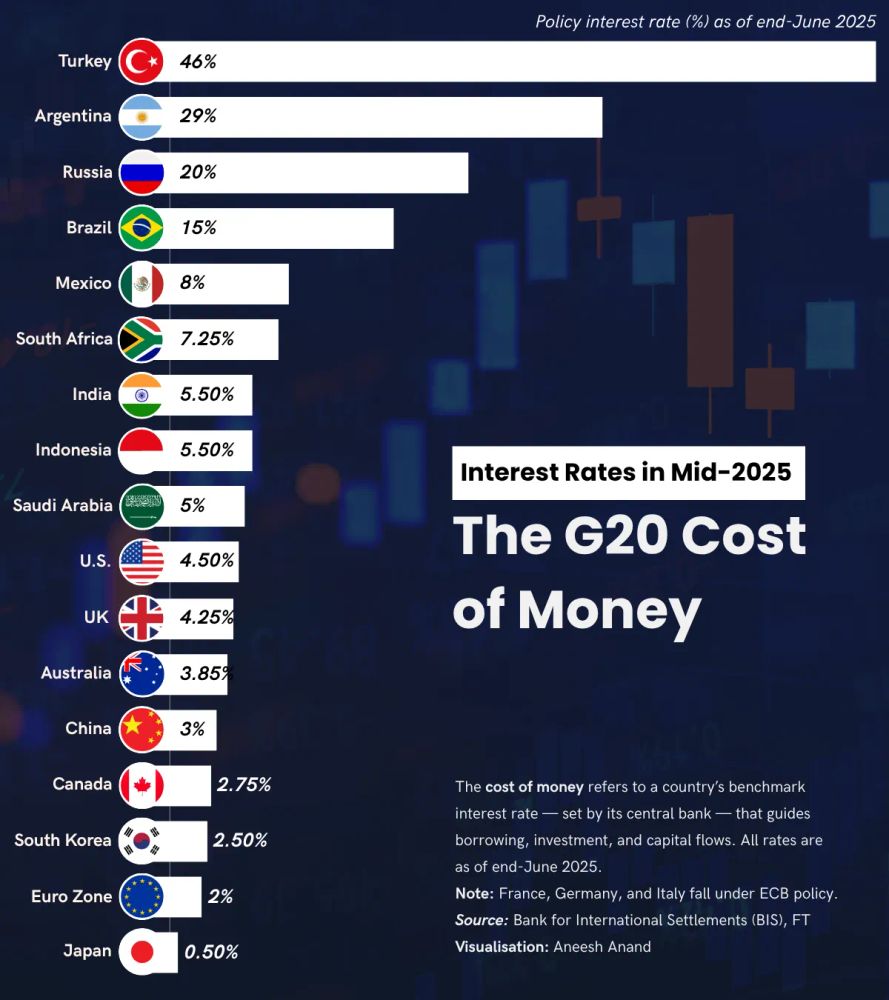
How high are interest rates across the G20 right now? 💰
This mid-year snapshot from Aneesh Anand shows how major economies are responding to inflation, slowing growth, and rising trade tensions: https://www.voronoiapp.com/economy/The-G20-Cost-of-Money-6122
07.08.2025 00:01 — 👍 2 🔁 1 💬 0 📌 0
4/4
The five power plants with significant losses due to high river temperatures are Blayais, Bugey, Golfech, St.-Alban and Tricastin.
Chooz, uniquely, has losses due to flow constraints,
arising from an agreement with Belgium governing the waters of the river Meuse.
05.08.2025 15:12 — 👍 0 🔁 0 💬 0 📌 0
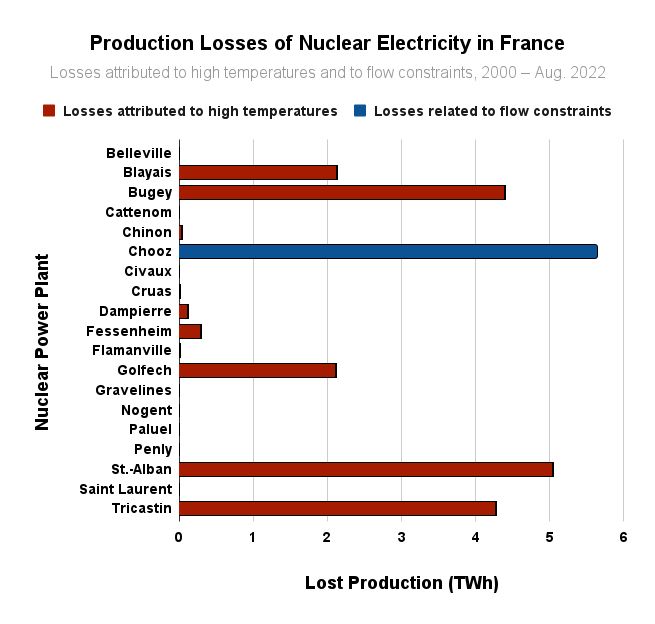
A graph showing production losses of nuclear electricity in France for the years 2000-Aug. 2022, by power plant,
for losses attributed to high temperatures and flow constraints in rivers.
All the production losses are attributed to high temperatures,
except Chooz, whose losses are wholly due to flow constraints.
Nuclear power plants and their production losses, 2000 - Aug. 2022, in GWh:
Belleville: 0.15 GWh
Blayais: 2135 GWh
Bugey: 4394 GWh
Cattenom: 0 GWh
Chinon: 32 GWh
Chooz: 5644 GWh
Civaux: 0.027 GWh
Cruas: 8.6 GWh
Dampierre: 113 GWh
Fessenheim: 294 GWh
Flamanville: 9.5 GWh
Golfech: 2116 GWh
Gravelines: 0.49 GWh
Nogent: 0 GWh
Paluel: 0 GWh
Penly: 0 GWh
St.-Alban: 5047 GWh
Saint Laurent: 0 GWh
Tricastin: 4272 GWh
3/4 (…contd.)
…and here's a breakdown of production losses from French nuclear power arranged by power plant,
for 2000 – Aug. 2022. 👇
⸻
Ref: Cour des Comptes, March 2023, Table 20, p.116
www.vie-publique.fr/files/rappor...
05.08.2025 15:12 — 👍 0 🔁 0 💬 1 📌 0
2/2
⸻
Ref: Cour des Comptes, March 2023, Table 19, p.115
05.08.2025 12:17 — 👍 0 🔁 0 💬 1 📌 0
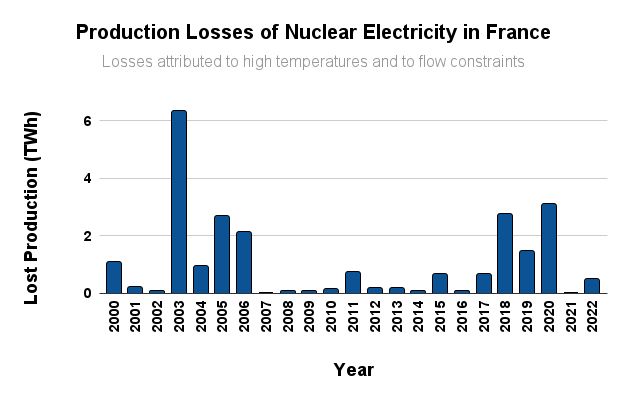
A graph showing production losses of nuclear electricity in France for the years 2000-2022,
for losses attributed to high temperatures and flow constraints in rivers.
Year and lost production in GWh
2000: 1075.855 GWh
2001: 219.975 GWh
2002: 71.289 GWh
2003: 6318.255 GWh
2004: 931.802 GWh
2005: 2690.211 GWh
2006: 2139.515 GWh
2007: 2.915 GWh
2008: 80.919 GWh
2009: 86.329 GWh
2010: 126.401 GWh
2011: 743.728 GWh
2012: 177.191 GWh
2013: 170.113 GWh
2014: 79.173 GWh
2015: 665.068 GWh
2016: 53.81 GWh
2017: 643.803 GWh
2018: 2734.391 GWh
2019: 1448.293 GWh
2020: 3101.735 GWh
2021: 4.95 GWh
2022: 501.351 GWh
1/2
Nuclear power shutdowns in France, caused by high river temperatures, are in the news.
Here's a breakdown of power losses by year for 2000–2022.
24 TWh of electricity production was lost due to high river temperatures over 23 years,
about 0.25% of nuclear generation,
or 119 MW average power.👇
05.08.2025 12:17 — 👍 2 🔁 0 💬 1 📌 0
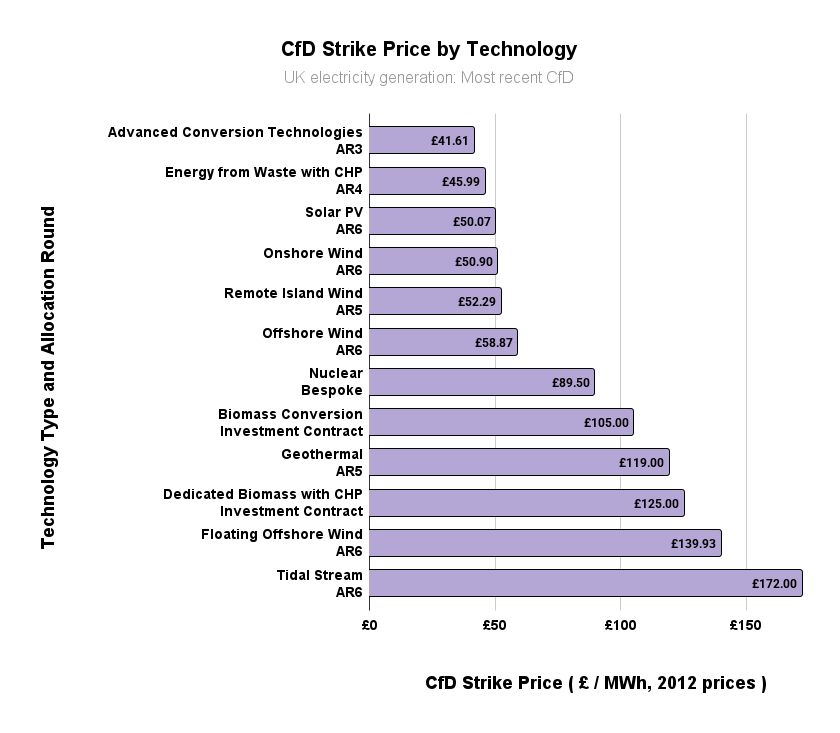
A graph showing the CfD Strike Price by Technology, for all 12 technology types with CfDs.
UK electricity generation: Most recent CfD
Technology Type and Allocation Round, and the CfD Strike Price (£/MWh, 2012 prices)
Advanced Conversion Technologies, AR3: £41.61/MWh
Energy from Waste (with CHP), AR4: £45.99/MWh
Solar PV, AR6: £50.07/MWh
Onshore Wind, AR6: £50.90/MWh
Remote Island Wind, AR5: £52.29/MWh
Offshore Wind AR6: £58.87/MWh
Nuclear, Bespoke: £89.50/MWh
Biomass Conversion, Investment Contract: £105.00/MWh
Geothermal, AR5: £119.00/MWh
Dedicated Biomass, Investment Contract: £125.00/MWh
Floating Offshore Wind, AR6: £139.93/MWh
Tidal Stream, AR6: £172.00/MWh
6/6
Here are all twelve technology types with CfDs, with the strike prices for the most recent CfD awarded in each case (in 2012 prices).
Onshore Wind is among the cheapest, Floating Offshore Wind is among the most expensive.
05.08.2025 08:53 — 👍 0 🔁 0 💬 0 📌 0
5/6
Refs (continued):
AR5: assets.publishing.service.gov.uk/media/64fa04...
AR6: assets.publishing.service.gov.uk/media/66d6ad...
AR7/AR7a ASP: assets.publishing.service.gov.uk/media/6880d6...
CfD Register: register.lowcarboncontracts.uk
05.08.2025 08:53 — 👍 0 🔁 0 💬 1 📌 0
4/6
Refs:
AR1 ASP: assets.publishing.service.gov.uk/media/5a7ee0...
AR1 results: assets.publishing.service.gov.uk/media/5a7ffb...
AR2: assets.publishing.service.gov.uk/media/5a82ef...
AR3: assets.publishing.service.gov.uk/media/5f566a...
AR4: assets.publishing.service.gov.uk/media/65b146...
05.08.2025 08:53 — 👍 0 🔁 0 💬 1 📌 0
Contracts for Difference for UK Floating Offshore Wind,
showing the strike price and the Administrative Strike Price for each Allocation Round (in 2012 prices).
Strike prices range from £87.30 per megawatt-hour in the fourth Allocation Round to £139.93 per megawatt-hour in the sixth Allocation Round.
The Administrative Strike Price for the seventh Allocation Round has been set at £194 per megawatt-hour.
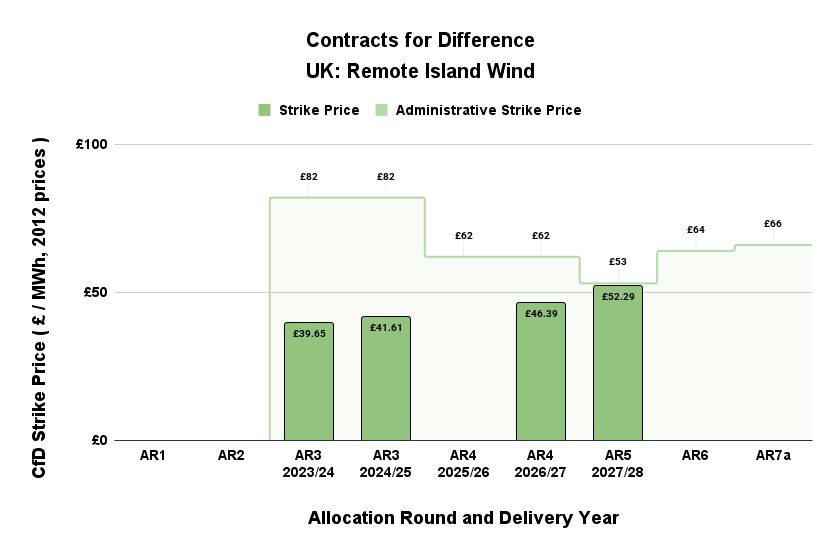
Contracts for Difference for UK Remote Island Wind,
showing the strike price and the Administrative Strike Price for each Allocation Round (in 2012 prices).
Strike prices range from £39.65 per megawatt-hour in the third Allocation Round to £52.29 per megawatt-hour in the fifth Allocation Round.
The Administrative Strike Price for the seventh Allocation Round has been set at £66 per megawatt-hour.
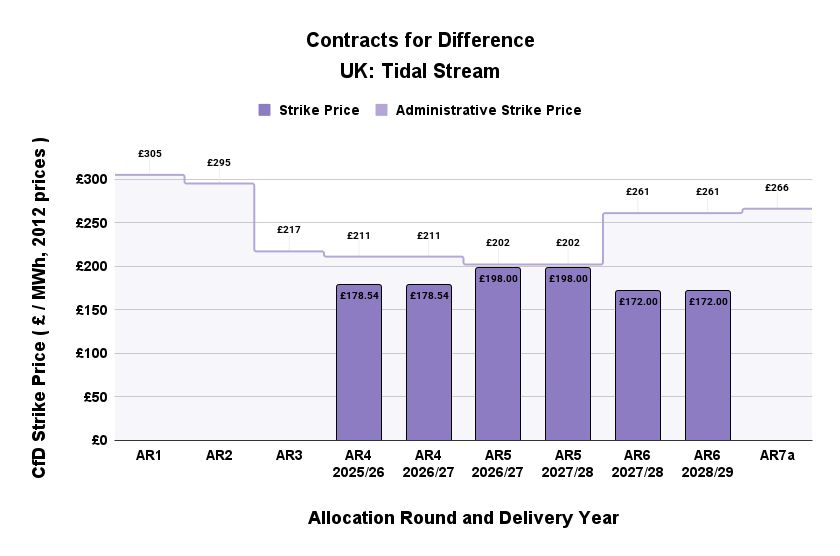
Contracts for Difference for UK Tidal Stream,
showing the strike price and the Administrative Strike Price for each Allocation Round (in 2012 prices).
Strike prices range from £178.54 per megawatt-hour in the fourth Allocation Round to £172.00 per megawatt-hour in the sixth Allocation Round.
The Administrative Strike Price for the seventh Allocation Round has been set at £266 per megawatt-hour.
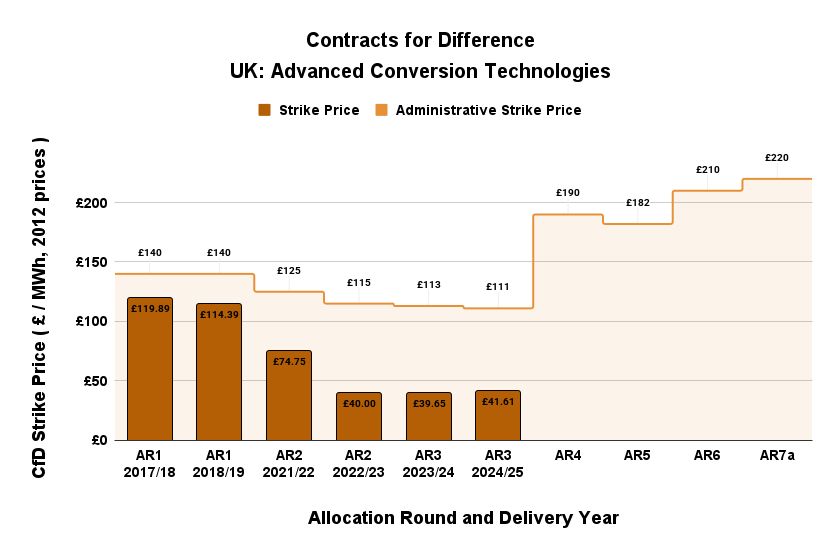
Contracts for Difference for UK Advanced Conversion Technologies,
showing the strike price and the Administrative Strike Price for each Allocation Round (in 2012 prices).
Strike prices range from £119.89 per megawatt-hour in the first Allocation Round to £41.61 per megawatt-hour in the third Allocation Round.
The Administrative Strike Price for the seventh Allocation Round has been set at £220 per megawatt-hour.
3/6
…and here are some of the smaller technologies (…those with enough data points to plot a graph, anyway):
• Floating Offshore Wind again,
• Remote Island Wind,
• Tidal Stream and
• Advanced Conversion Technologies.
05.08.2025 08:53 — 👍 0 🔁 0 💬 1 📌 0
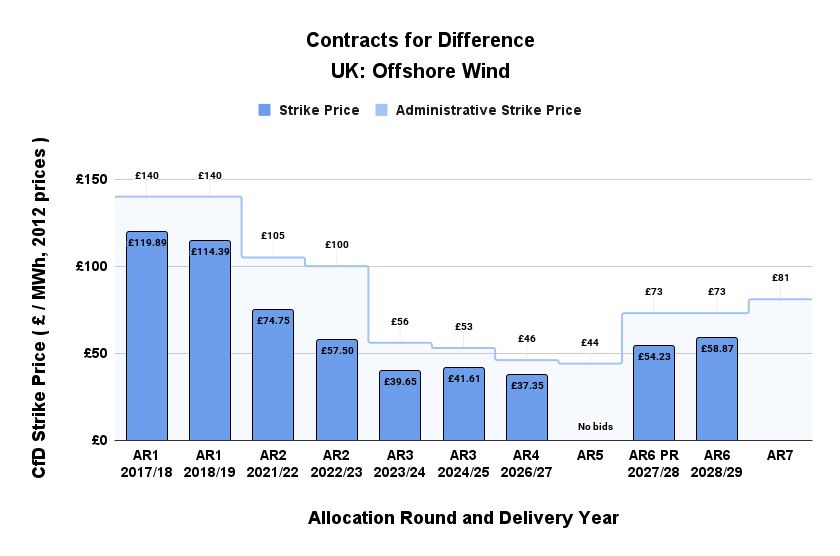
Contracts for Difference for UK Offshore Wind,
showing the strike price and the Administrative Strike Price for each Allocation Round (in 2012 prices).
Strike prices range from £119.89 per megawatt-hour in the first Allocation Round to £58.87 per megawatt-hour in the sixth Allocation Round.
The Administrative Strike Price for the seventh Allocation Round has been set at £81 per megawatt-hour.
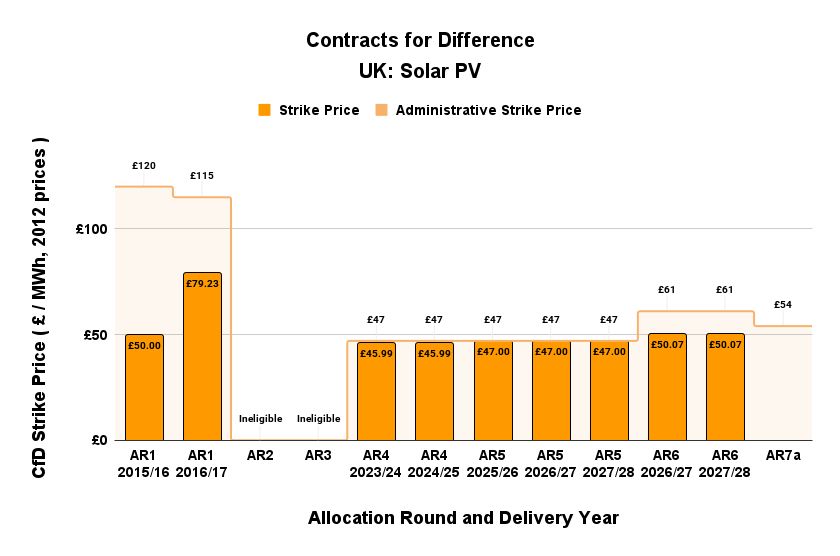
Contracts for Difference for UK Solar PV,
showing the strike price and the Administrative Strike Price for each Allocation Round (in 2012 prices).
Strike prices range from £50.00 per megawatt-hour in the first Allocation Round to £50.07 per megawatt-hour in the sixth Allocation Round.
The Administrative Strike Price for the seventh Allocation Round has been set at £54 per megawatt-hour.
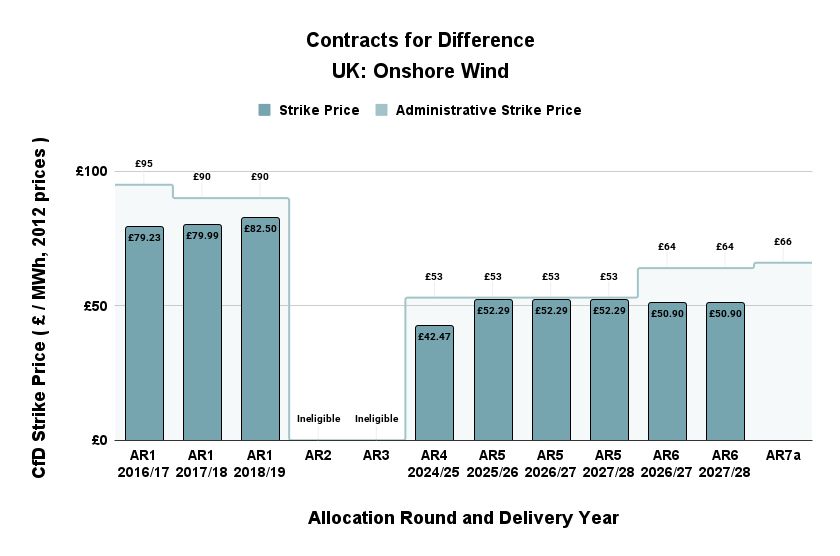
Contracts for Difference for UK Onshore Wind,
showing the strike price and the Administrative Strike Price for each Allocation Round (in 2012 prices).
Strike prices range from £79.23 per megawatt-hour in the first Allocation Round to £50.90 per megawatt-hour in the sixth Allocation Round.
The Administrative Strike Price for the seventh Allocation Round has been set at £66 per megawatt-hour.

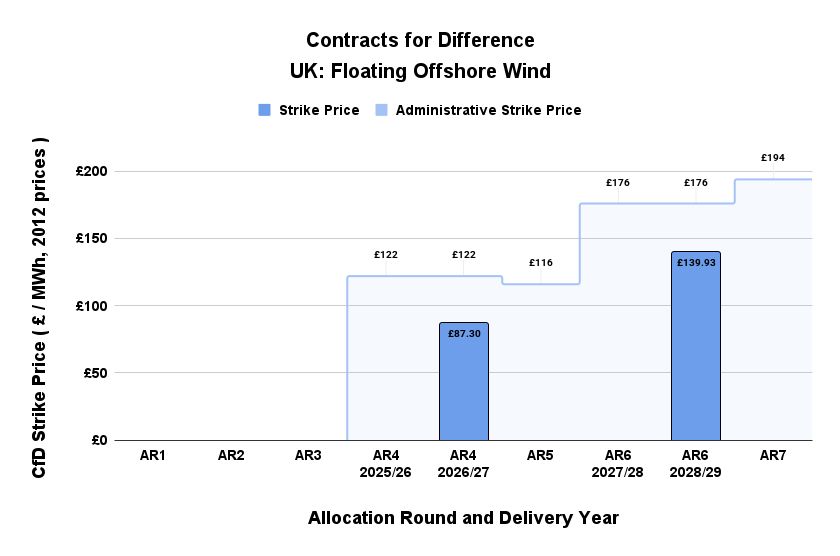
Contracts for Difference for UK Floating Offshore Wind,
showing the strike price and the Administrative Strike Price for each Allocation Round (in 2012 prices).
Strike prices range from £87.30 per megawatt-hour in the fourth Allocation Round to £139.93 per megawatt-hour in the sixth Allocation Round.
The Administrative Strike Price for the seventh Allocation Round has been set at £194 per megawatt-hour.
2/6
Twelve technology types have obtained CfDs.
Here are the strike prices and ASPs for the three technology types with the highest awarded capacity,
• Offshore Wind,
• Solar PV and
• Onshore Wind.
along with Floating Offshore Wind, which is small now, but there's a hope/intention to grow it.
05.08.2025 08:53 — 👍 0 🔁 0 💬 1 📌 0
Government Publishes Key AR7 Documents
| Contracts for difference CfD
1/6
The Application Window for Allocation Round 7 of the UK's Contracts for Difference scheme for low carbon electricity opens this week (7th Aug.).
Here are the strike prices and Administrative Strike Prices (i.e. the price caps for the auctions) for all the previous Allocation Rounds.
🧵
05.08.2025 08:53 — 👍 0 🔁 0 💬 1 📌 0
…why did he go for 2889 rather than 1989? He’d have been quite a lot nearer the money with the latter.
02.08.2025 13:15 — 👍 17 🔁 2 💬 0 📌 0
One regulatory change I'd like to see around AI is the requirement that it has to tell you it's AI if you directly ask it.
Hard code that shit in and do not let anyone running a chatbot prompt their way out of it... or face massive fines.
03.08.2025 09:10 — 👍 264 🔁 51 💬 11 📌 1
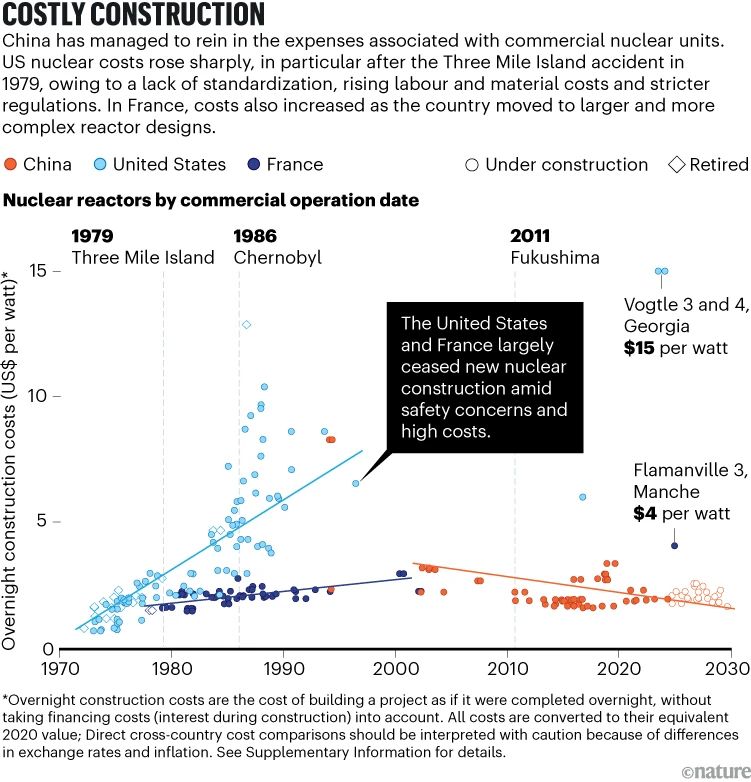
A graph of overnight construction costs versus commercial operation date for nuclear units in China, the United States and France.
Text:
Costly Construction
China has managed to rein in the expenses associated with commercial nuclear units.
US nuclear costs rose sharply, in particular after the Three Mile Island accident in 1979, owing to a lack of standardization, rising labour and material costs and stricter regulations. In France, costs also increased as the country moved to larger and more complex reactor designs.
Source: Analysis by S. Liu at al.
Nature.
2/2
❝ Whereas construction costs increased substantially between the 1960s and 2000s, by around tenfold in the United States and by nearly twofold in France, they had halved in China by the early 2000s and have remained largely stable since.❞
03.08.2025 08:50 — 👍 0 🔁 0 💬 0 📌 0
Editor-at-large, World Politics Review. Spent more than a year in Provence. Used to be an American in Paris. Currently bringing coal to Newcastle.
https://www.worldpoliticsreview.com/
@wpr.bsky.social
Energy and transitioning from fossil fuels. Complex issues I try to shine a light on. Ex-UKAEA and Met Office. Occasionally politics
Exeter, UK
Official Account of NSF. News, videos, and community for spaceflight enthusiasts since 2005.
NSF is not affiliated with NASA, initials used with permission.
Associate Fellow @chathamhouse.org | @cepa.org Fellow | Senior Fellow Frivärld | Defence Editor @eurcorrespond.bsky.social. Plot twist: not from Åland. 📸 Martin Hladik
✍️ Northern Flank Notes: https://open.substack.com/pub/minnalander
🐙 DataViz at @octopus.energy
⚡️ Obsessed with maps and energy
✨ Creator of ViziCities
👨💻 Previously Wood Mackenzie & devrel at Mozilla
Principal Engineer Semiconductor Industry and now a DER/Grid Edge worker as well! Opinions own
Nature Portfolio’s high-quality products and services across the life, physical, chemical and applied sciences is dedicated to serving the scientific community.
Climate dad, Canadian energy policy nerd. I post about energy technologies and how we can use them to stop climate change. Views my own. #energysky
Deep decarbonization and the business of climate.
I do that presentation.
https://www.nathanielbullard.com/
📍Singapore
Saskatoon, Saskatchewan, Canada (he/him) 🌻
⚛ Ask me about #Thorium! ☢
钍 TMSR-LF1 38.96 N 102.61 E
https://drive.google.com/drive/folders/1_sZwQ-J2vBhjKcXnqa_LauCk3oLYaqUj
Dormant 🦣 @conradknauer@mastodon.online
Dead 🐦 @ConradKnauer
Environmentalist, urbanist, solar believer. Works in Life Cycle Assessment 🌲🌐🏘️🚋
PhD MSc at Electrical Energy Lab of Ghent University. Spaceflight enthusiast. Speelvogel. West-Vlaming in Hent. Stating a personal opinion.
Reporter. I write about energy, climate, and geopolitics. I'm especially into nuclear power, geothermal, the grid, metals, and Puerto Rico. Contact: www.alexanderckaufman.com | kaufman.nyc | Signal: Kaufman.11
Journalist & science writer (Nature, Sci Am, New Scientist, Guardian, Telegraph, Jacobin). Almost a geologist. Co-author of People’s Republic of Walmart (Verso, 2019). Author of Austerity Ecology (Zer0 Books, 2014).
Irish Mechanical Engineer in London England.
Head of BOFIT (Bank of Finland Institute for Emerging Economies), not representing the official views of my employer, RTs not endorsements
https://t.co/E0YqzEKBp7
Hertie School and Neon. Energy markets and power systems. Known for analysis, not diplomacy.
Electrical/Power Systems Engineer, Internationally Recognized Queen of Anglo-Saxonia, “Expert”
*sigh* there will be typos and long threads
Professor of History at Columbia University; author of CRIMES AGAINST NATURE, SHADOWS AT DAWN: A BORDERLANDS MASSACRE AND THE VIOLENCE OF HISTORY; and THE STRANGE CAREER OF WILLIAM ELLIS. Working on a new project on the US-Mexico War (1846-1848).
it's a website (and a podcast, and a newsletter) about humans and technology, made by four journalists you might already know. like and subscribe: 404media.co


