Another "good" week on the US academic job market #econsky #econbluesky
davidvandijcke.com/joe_tracker/

@packlesshepherd.bsky.social
PhD Candidate in economics at the University of Michigan. Metrics & big data. 🇧🇪. Views mine. https://www.davidvandijcke.com/
Another "good" week on the US academic job market #econsky #econbluesky
davidvandijcke.com/joe_tracker/
Thanks for sharing!
21.09.2025 13:41 — 👍 1 🔁 0 💬 0 📌 0Thanks for sharing!
21.09.2025 13:41 — 👍 1 🔁 0 💬 1 📌 0
US academic economics market continuing to pull away from the COVID market this week.
I created a little tracker for JOE here for those who want to play around with the data. Updates weekly: davidvandijcke.com/joe_tracker/ #econbluesky #econsky
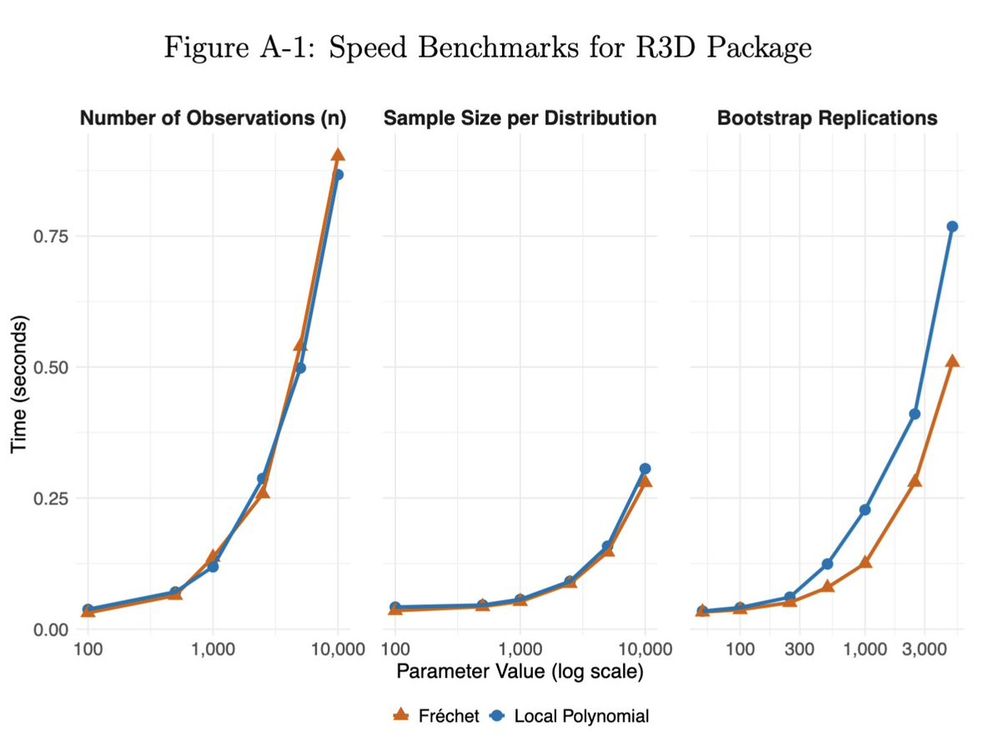
The paper integrates causal inference, functional data analysis, and optimal transport, developing (FAST!) new tools for empirical researchers.
If you use micro data or focus on inequality effects, I’d love to discuss potential applications! #EconTwitter
(11/11)

The method opens up a large new class of RDDs for distributional policy evaluation.
E.g.: local minimum wage impacts on wage distributions, district ed reforms on grade distributions, close elections on constituent outcomes...
For more details:
(10/) arxiv.org/abs/2504.03992

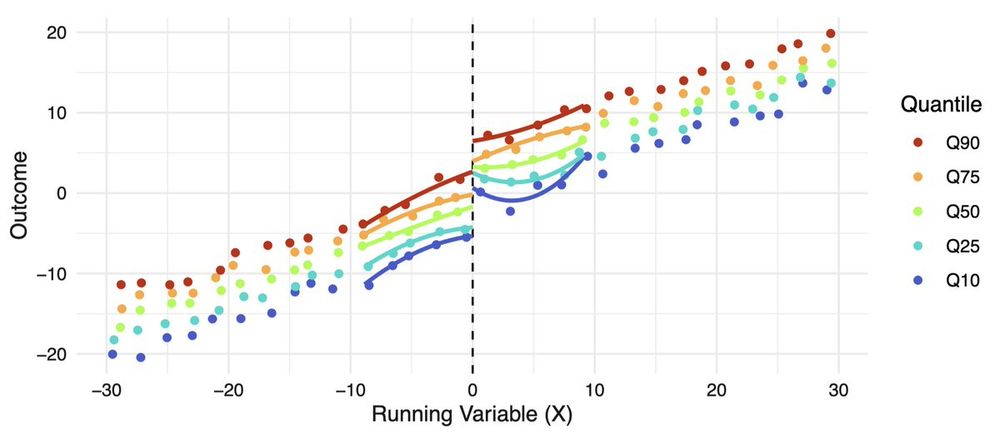
The results suggest a classic "equality-efficiency tradeoff" under Democratic governors:
Incomes at the top 10% of the distribution drop significantly, but this effect weakens and becomes statistically imprecise lower down the distribution.
(9/)

Finally, I illustrate the method's use in a close-election RD (or rather, R3!) design.
I study how Democratic vs Republican governors affect families' income distributions within their states when they barely won/lost their election.
(8/)

I validate both methods through extensive simulations, which show rapid convergence to the quantile treatment effects...
...unlike existing quantile RD methods, which do not converge (but remain useful in the classic setting!)
(7/)

I develop uniform confidence bands and data-driven bandwidth selection for both approaches, which are fully implemented in an R package (available at davidvandijcke.com/R3D).
(6/)
To estimate this unknown beast, I propose two closely related estimators.
One extending local polynomial regression to random quantiles, and a functional version of that, based on local Fréchet regression (which has better mathematical and computational properties).
(5/)

I propose a new concept of treatment effects for R3D: Local Average Quantile Treatment Effects.
Instead of averaging over conditional scalar outcomes, they average over conditional distributions!
This captures the average distributional shift across the cutoff.
(4/)
Standard RD methods can't handle such settings, as they don't account for the two levels of randomness—within and across distributions.
R3D solves this problem by modeling outcomes as random distributions rather than random variables!
(3/)

The method is useful when aggregate units receive treatment, but your outcome varies within the unit.
E.g., firms receive a subsidy when their revenue (X) drops below a cutoff, and you want to study this subsidy's effect on the employee wage distribution
(2/)

Hi Bluesky!
I'm excited to share my job market paper (for the 2025-26 market)!
It introduces a new extension of RDD where outcomes are entire distributions: Regression Discontinuity Design with Distributions (R3D).
Thread below 👇 (1/)