Credit: Maayan Harel
Denisovans or their close relatives identified in the fossil record using a gene regulatory phenotyping method. Now out:
www.pnas.org/doi/10.1073/...
@gilig.bsky.social
Population genetics, computational & mathmatical biology, conservation genomics, human evolution. Assistant Professor at the Hebrew University of Jerusalem
Credit: Maayan Harel
Denisovans or their close relatives identified in the fossil record using a gene regulatory phenotyping method. Now out:
www.pnas.org/doi/10.1073/...
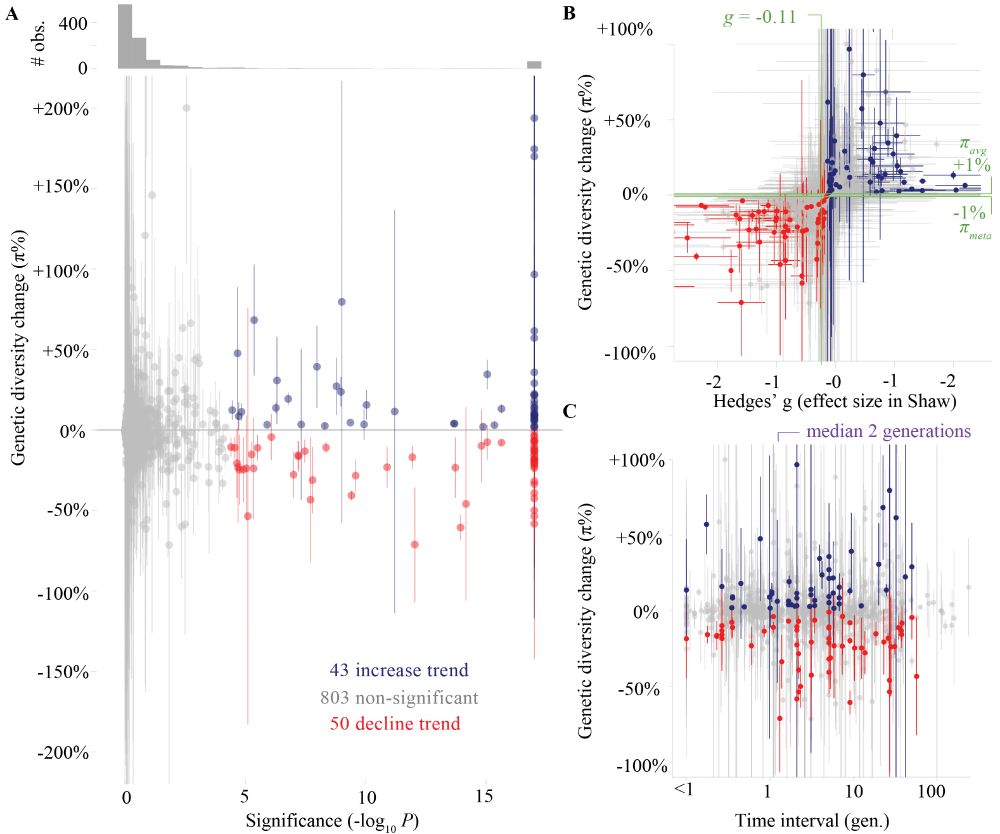
*ALERT! GLOBAL GENETIC DIVERSITY TREND RE-ANALYSIS*
"Signals of consistent genetic diversity decline are not yet measurable in global meta-analysis" doi.org/10.1101/2025...
6/ This work was led by Keith D. Harris, with Yuval Talmor and Meirav Yefe Nof making important contributions, and excelent input provided by Nimrod Marom, Yitzchak Jaffe and Viviane Slon.
01.08.2025 17:55 — 👍 2 🔁 0 💬 0 📌 05/ Results will (shortly) be available for visualization and analysis via the interactive web interface DORA (dora.modelrxiv.org) for further exploration (we'll post here when its ready).
01.08.2025 17:55 — 👍 4 🔁 0 💬 1 📌 0
impHET is an imputation-based pipeline for estimating heterozygosity in aDNA. Here show are downsamping simulations that mimick aDNA biases by using read structure of many aDNA samples. impHET estimation converges to the gound truth heterozygosity at relatively low coverages.
4/ To enable the analysis, we developed cool new methods: (1) impHet, a pipeline that provides high accuracy estimates of heterozygosity for ancient genomes, (2) a new genomic scan for balancing selection in aDNA timeseries data, (3) a simulation pipeline for mimicking biases in aDNA.
01.08.2025 17:55 — 👍 3 🔁 1 💬 1 📌 0

3/ We also characterize "peaks" in disease burden, with a major peak at 7000BP in both regions, and a smaller, later peak corresponding to urbanization and the rise of large polities. Interestingly, increases in diversity of immune-related genes is highly correlated between the regions (r=0.91)
01.08.2025 17:55 — 👍 3 🔁 0 💬 1 📌 0
Genomic scan across all genes for changes in heterozygosity over the past 12,000 years. Colored genes have significant changes. 66% of genes that show increase in heterozygosity are in the MHC.
2/ We found clear evidence that the answer is YES. We show that the MHC is the genomic region with the most dramatic increases in heterozygosity - 16 and 7 times higher than genome-wide levels, in two regions, Southwestern Eurasia and East Asia). 66% of Het-increasing genes are in the MHC.
01.08.2025 17:55 — 👍 3 🔁 0 💬 1 📌 0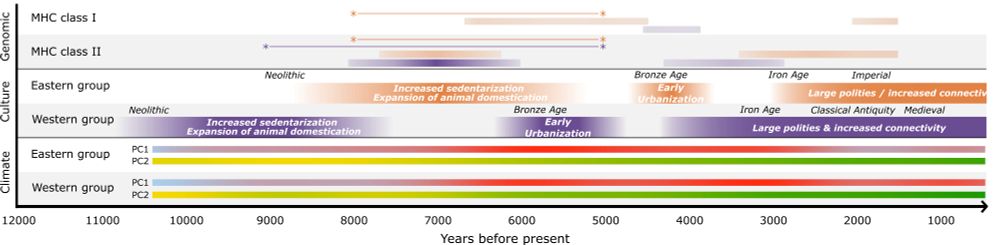
🧵 Excited to share a new preprint from our lab looking into signals of disease-burden in aDNA (doi.org/10.1101/2025...)! It has long been speculated that transition to sedentary, agricultural and urbanized lifestyle increases disease burden, but can we see this in aDNA?
01.08.2025 17:55 — 👍 18 🔁 6 💬 2 📌 0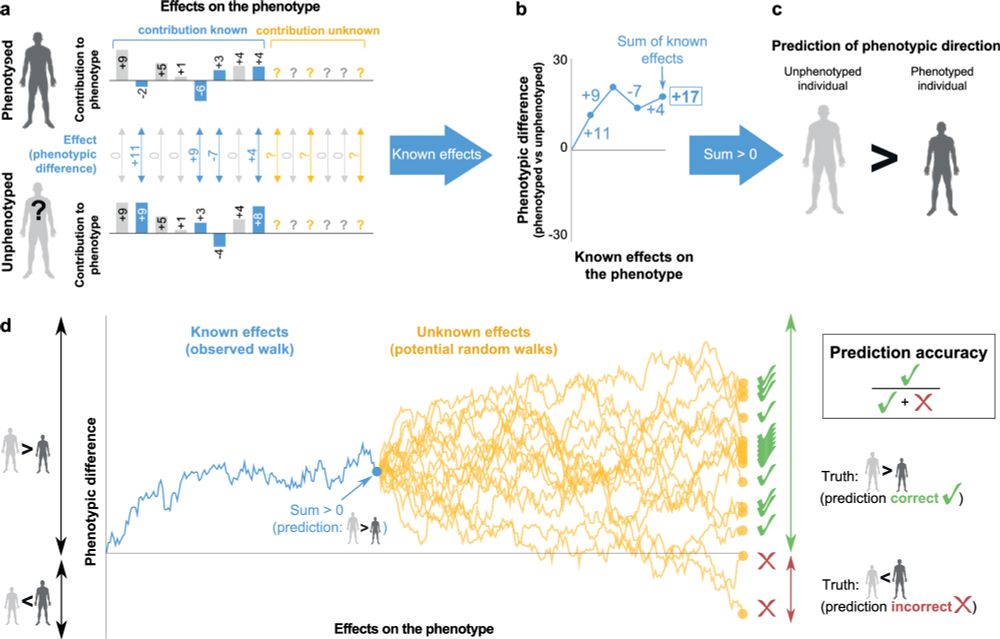
Given two genomes, can you tell who’s taller or more prone to a disease? How confident can you be? A fresh take on phenotypic inference, now out:
rdcu.be/exW4f
See thread🧵👇:
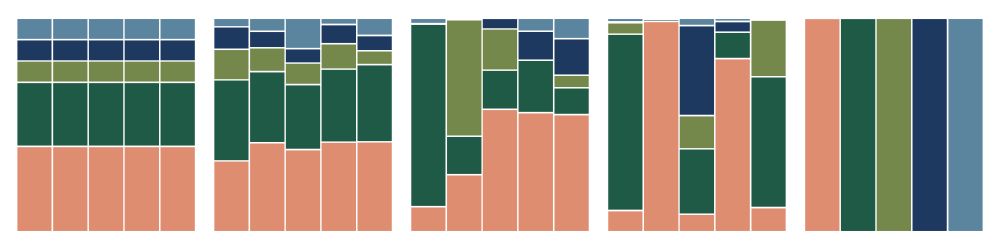
5 relative abundance plots arranged to have increasing compositional variability (variability across relative abundance samples, here vertical bars)
1/ Hey y'all, I'm excited to share my latest paper, which is out now in PNAS! We introduce FAVA, a statistical framework to measure compositional variability across microbiome samples. If you want to measure variability across a stacked bar plot, FAVA is for you! Paper: doi.org/10.1073/pnas...
14.03.2025 20:46 — 👍 207 🔁 72 💬 5 📌 2Perhaps the main moral from this story - catagorical social classes are certainly useful, but as we accumulate more types of data on more specie, it is worthwhile to let the data do the talking, and quantify composite sociality phenotypes directly from mulitdimensioal data.
13.02.2025 18:24 — 👍 0 🔁 0 💬 0 📌 0We also looked at genomic signitures in 12 candidate genes in relation to our composite social phenotype, and we see that the transition cannot be explained by directional selection on a specific gene. More likely, the transition to high sociaility in bees involved a combination of genetic changes.
13.02.2025 18:24 — 👍 0 🔁 0 💬 1 📌 0The period right after the transition was the one with the largest movments in the phenotypic space. Importantly, although "eusocial" is often treated as a single socialility class, the high social complexity region in our analysis was larger than that of all other lower sociality phenotypes.
13.02.2025 18:24 — 👍 0 🔁 0 💬 1 📌 0The transition path seems different than that of the "social ladder" theory, where extant social complexity catagories represent steps towards high social complexity.
13.02.2025 18:24 — 👍 0 🔁 0 💬 1 📌 0
Phenotypic diverrsification following a major evolutionary transition.
Looking at the movment in this phenotypic space, we see a major transition around 70mya, which breached to a new region in the space. This transition was followed by a period of divesification that resulted in a wide range of high-complexity phenotypes of honey bees, stingless bees, and bumble bees.
13.02.2025 18:24 — 👍 0 🔁 0 💬 1 📌 0We decided not to take traditional social catagories as an a priori assumption, and instead generated a quantitative social complexity phenotype from 17 social-related traits for 80 bee species. We then tracked the evolutionary history in PCA space of the composite social complexity phenotype.
13.02.2025 18:24 — 👍 0 🔁 0 💬 1 📌 0
Ancestral reconstruction of social complexity mapped onto the PCA representing the phenotypic space of sociality in bees.
New paper on the evolution of sociaility in bees by Ohad Peled, with Guy Bloch, is out on Current Biology! We took a data-driven approach to the classification of social level, and studied the evolutionary history of the social phenotpic space. Read all about it: shorturl.at/7J5zx
13.02.2025 18:24 — 👍 1 🔁 0 💬 1 📌 0
Excited to present modelRxiv, dedicated to ecological and evolutionary models, now in Ecology Letters! LLMs now make this idea feasible: a single interactive repository for models written in different languages. Let us know if you have feedback or want help adding in your models tinyurl.com/yp75n7ws
06.01.2025 20:49 — 👍 3 🔁 0 💬 0 📌 0I would like to be added. Thanks.
28.12.2024 22:28 — 👍 1 🔁 0 💬 1 📌 0
Save the dates June 2-6 for the second annual meeting of @smtpb.bsky.social on Modeling and Theory in Population Biology, hosted in Chicago by @nitmb.bsky.social. More details coming later. www.nitmb.org/modeling-and...
19.12.2024 17:02 — 👍 24 🔁 19 💬 1 📌 0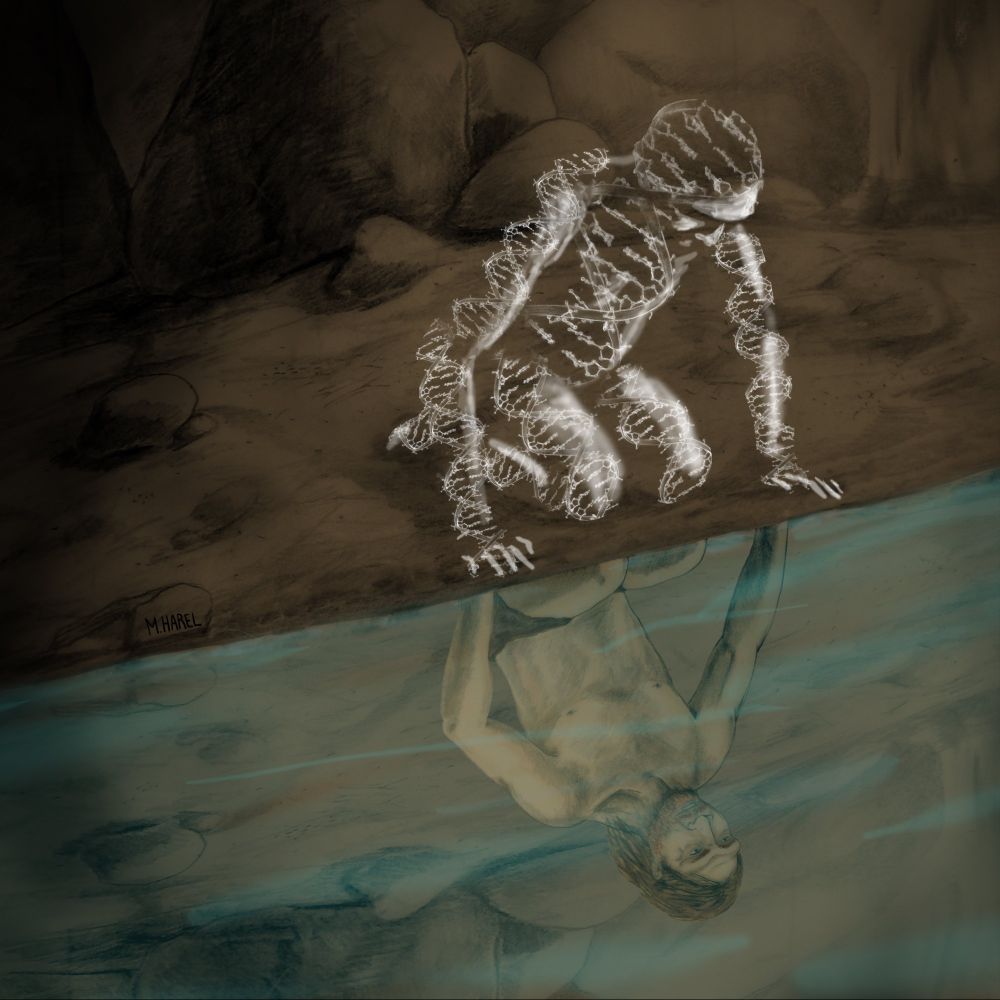
Interested in discovering the genetic changes that made us human? Our lab is looking for students and postdocs! 👩🔬👨🔬 gokhmanlab.com
please RT!

our article on selecting diagnostic SNPs (and accompanying pipeline) is now online at MER. We are excited that it is getting so much use already and look forward to extending it for more use cases in the near future! Thanks to all for helpful feedback. onlinelibrary.wiley.com/doi/10.1111/...
29.11.2024 17:19 — 👍 11 🔁 6 💬 0 📌 1