#SpatialSunday! As of 2023, ~26% of 25-29 year-olds in the U.S. live in a household headed by a parent or grandparent. Like most housing stats, geography plays a major role:
14.09.2025 15:16 — 👍 2 🔁 2 💬 0 📌 0
@mappymonday.bsky.social
Data Scientist | Exploring the Housing & GIS Nexus | Rhode Island
#SpatialSunday! As of 2023, ~26% of 25-29 year-olds in the U.S. live in a household headed by a parent or grandparent. Like most housing stats, geography plays a major role:
14.09.2025 15:16 — 👍 2 🔁 2 💬 0 📌 0


#MappyMonday! Today’s housing gridlock is built on yesterday’s mortgage rates. Sub-5% loans continue to anchor prospective sellers across the country:
As of 1Q25, 71.3% of active single-family mortgages carry a rate under 5%, down 0.6% from 4Q24. Over half (53.4%) are locked in below 4%.
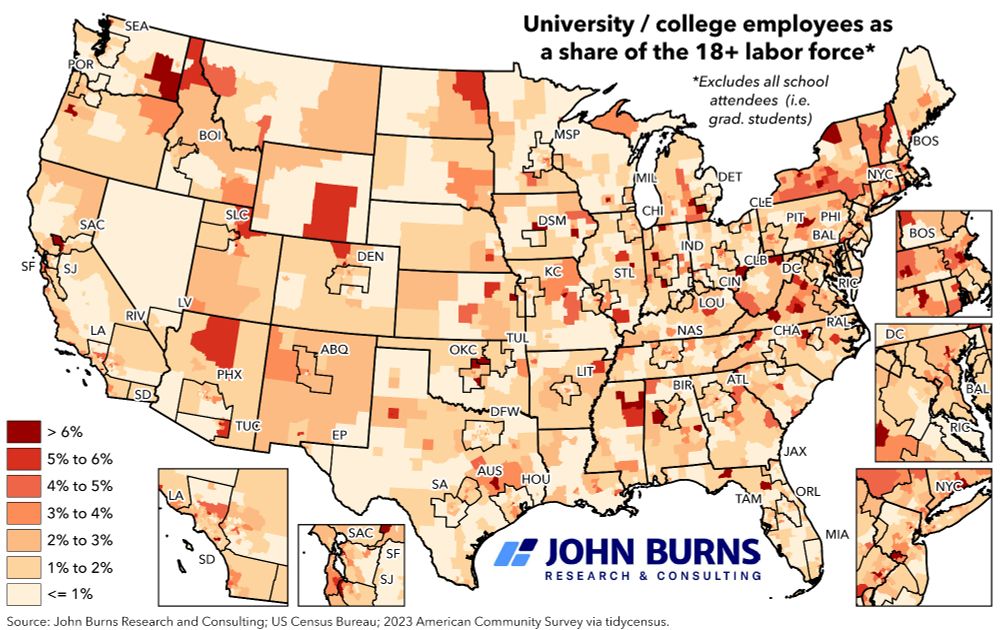
#MappyMonday! With conversations heating up around budget cuts to higher education, where do college and university employees make up the largest share of the adult workforce (18+)? @jbrec.com has the answers:
#jbrec #housing #realestate #economics #DOGE #college #gis #maps #geography #cartography


#MappyMonday! In single-family new construction, siding choices—vinyl, brick, stucco, etc.—are shaped by geography. Which regions prefer which? @jbrec.com has the answers.
Source: US Census Bureau, Survey of Construction, 2024 Characteristics of New Housing (www.census.gov/construction...).

#TopographicalTuesday and belated #MappyMemorialDay! Where are 15-year (or shorter) fixed-rate mortgages most common among existing single-family mortgage holders? See below:
@jbrec.com clients can reach out for access to the underlying data!

#MappyMonday! Where are residential electricity prices rising (or falling) the fastest across the U.S.? @jbrec.com has the answers:
Source: lnkd.in/eyRiXeKs
Note: February 2025 vs February 2024
#jbrec #realestate #housing #utilities #electricity #inflation #gis #maps #geography #cartography
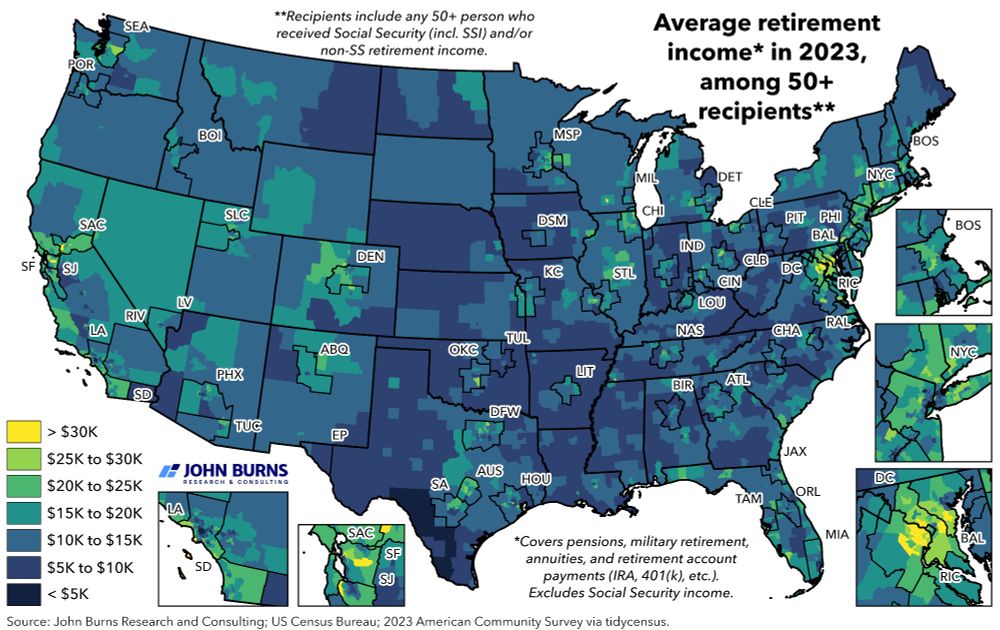
#MappyMonday! Recent stock market fluctuations have dented retirement accounts, prompting many retirees to pull back on discretionary spending. So, where are retirees drawing the largest retirement paychecks (excl. social security)? @jbrec.com has the answers:
05.05.2025 16:15 — 👍 0 🔁 1 💬 0 📌 0
#MappyMonday (from yesterday)! Housing affordability maps often use median income as a benchmark, but that measure usually includes homeowners, which can blur the picture for renter households. So, where is affordability most strained among the renter population? See below:
#housing #realestate

#MappyMonday! The Northeast has the oldest homes in the U.S. (in terms of when they were built). When it comes to effective age—a measure of how old a home is structurally/functionally—the picture looks different. So where are homes functionally the "oldest" and most in need of repairs? See below 👇
14.04.2025 12:11 — 👍 0 🔁 1 💬 0 📌 0


#MappyMonday What’s keeping homeowners in place? 👉 Mortgage rates under 5%:
As of 4Q24, 72.1% of outstanding single-family mortgages are sitting on a mortgage rate below 5%, down 0.8% from 3Q24. Over half (54.1%) have a rate under 4%.
Source: lnkd.in/e3uXGdHj
#realestate #housing #economics #gis

#MappyMonday! With recent discussions around federal workforce reductions, where do federal government employees (excluding military personnel and USPS workers) make up the largest share of the 18+ labor force? @jbrec.bsky.social has the answers:
#jbrec #housing #realestate #economics #gis #maps