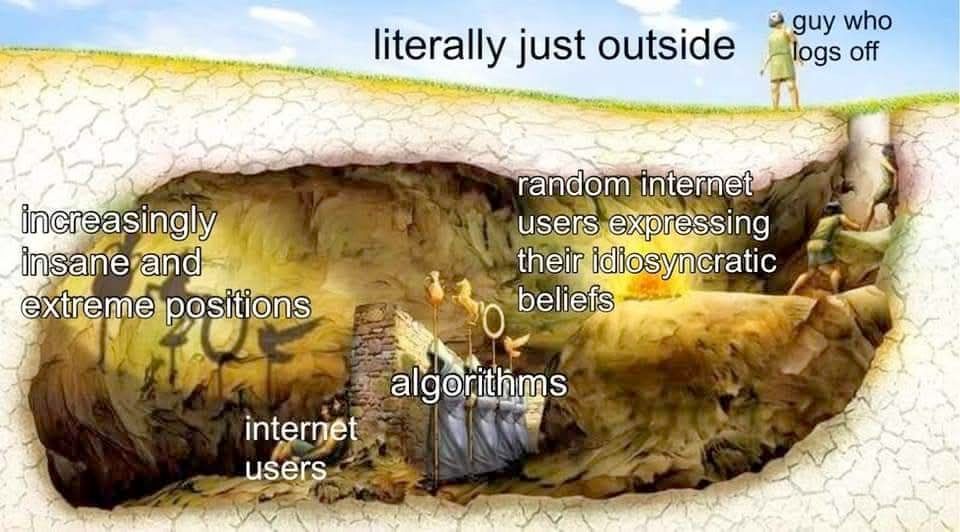
Plato's Cave allegory, illustrated. the shadows on the cave wall are captioned "increasingly insane and extreme positions", the prisoners labeled "internet users", the figures holding the shadow's shapes labeled "algorithms", the fire labeled "random internet users expressing their idiosyncratic beliefs". the space above the cave is labeled "literally just outside" and the philosopher freed from the chains of the physical world labeled "guy who logs off"
from "Classical Studies memes for Hellenistic teens" on FB
10.06.2025 19:57 — 👍 6842 🔁 1252 💬 74 📌 68
Thank you! This is cool stuff.
21.05.2025 19:00 — 👍 2 🔁 0 💬 0 📌 0
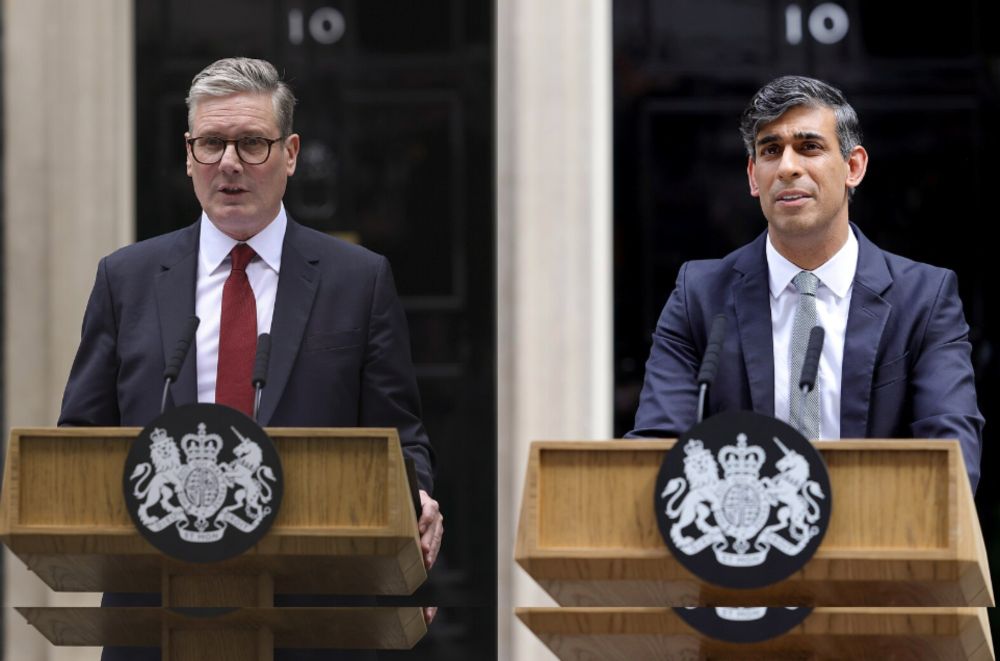
Posting Through It: Sir Keir Starmer and Rishi Sunak’s Social Media Strategy on Twitter in the 2024 General Election
Oliver Haythorne analyses Starmer and Sunak's attempts at self-fashioning via Twitter before the 2024 election, and why they failed.
Social media is predominantly a world of illusion 🪄 ✨ But our latest analysis of Starmer and Sunak’s (largely) unsuccessful attempts to self-fashion via Twitter in the run up to the 2024 election 🗳️ finds that no filter can manufacture charisma...
tinyurl.com/5y6p2mvy
#twitter #socialmediastrategy
09.04.2025 05:44 — 👍 3 🔁 1 💬 0 📌 0
my only question about people who get on X or tiktok and post that gpt helped them solve the reimann hypothesis is whether they are in their heart of hearts aware that they have no idea what's going on at any level, or if they're like true believers in their own shit
25.02.2025 13:46 — 👍 51 🔁 3 💬 5 📌 0
How Does Culture Impact Economic Growth?
bsky.app/profile/jose...
22.02.2025 14:35 — 👍 0 🔁 0 💬 0 📌 0
Summing up:
1) Culture matters economically
2) In Qing China, higher densities of sage temples were associated with lower rates of firm foundations in the 19th and 20th centuries
3) This holds when using sage birthplaces instead
4) This might be persistently impactful on cultural dynamism
9/
22.02.2025 14:34 — 👍 0 🔁 0 💬 1 📌 0
I'm not sure about that last set of results. I think it's more likely that the low rates of intellectual dynamism in areas that also had low rates of firm foundation had more to do with poverty and a lack of employment than culture by that point.
Some of his controls are also questionable.
8/
22.02.2025 14:34 — 👍 0 🔁 0 💬 1 📌 0
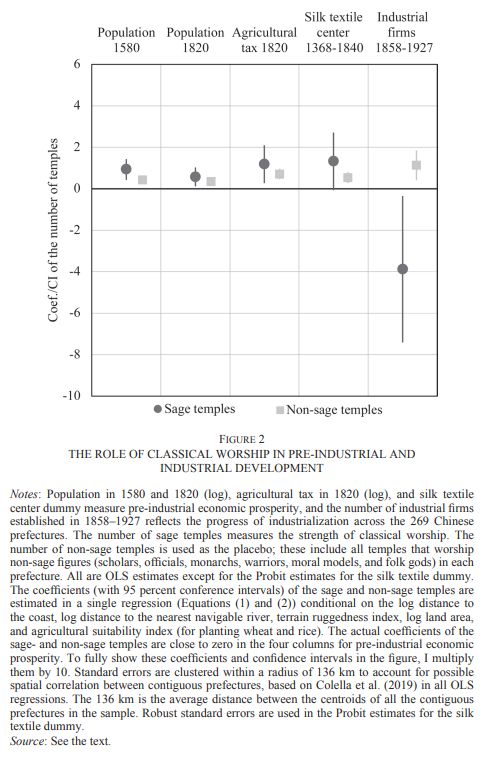
A table of results showing what is described
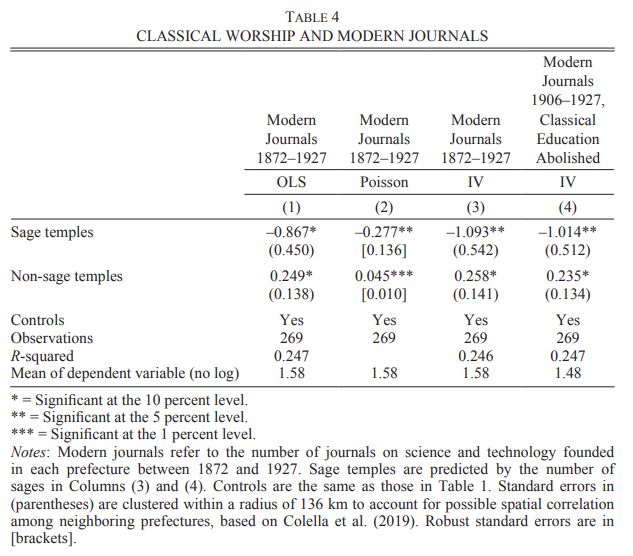
Ma argues that this association between traditionalism and low economic growth continues to hold today.
He finds that sage temples and birthplaces are also associated with low rates of journal publications and intellectual activity in modern history, perhaps showing cultural backwardness.
7/
22.02.2025 14:33 — 👍 0 🔁 0 💬 1 📌 0
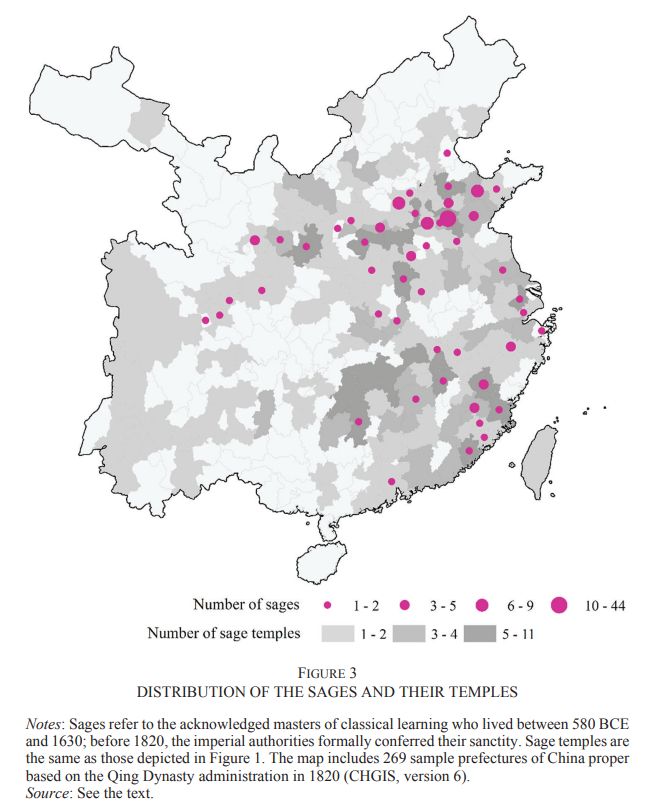
A map showing the distribution of sage birthplaces and their temples
A table of results showing what is described
However, it's possible that there's reverse causation.
As such, Ma looked at the link between firm foundations and the birthplaces of the sages, centuries or millennia earlier. That should be unrelated with characteristics of the area later when the shrines were built. The association holds.
6/
22.02.2025 14:32 — 👍 0 🔁 0 💬 1 📌 0
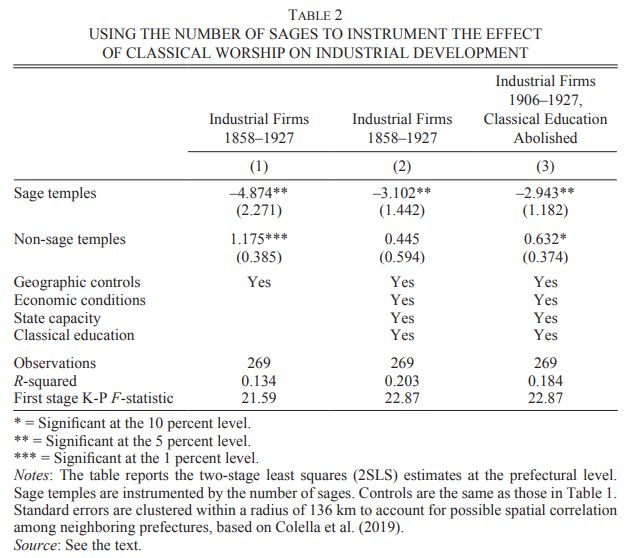
A graph of results showing what is described
A table of results showing what is described
He found initially that there was a negative association between the density of sage temples in an area and the rate of business foundations later in the 19th and 20th centuries.
This might show that areas which worshipped ancient wisdom were less likely to take up on modern economic ideas.
5/
22.02.2025 14:31 — 👍 0 🔁 0 💬 1 📌 0
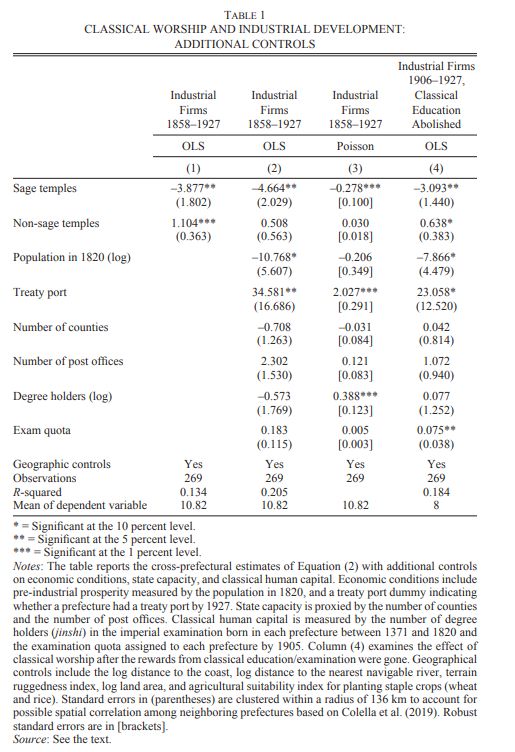
He put together a pretty detailed dataset of all the "sage temples" across China in the Qing period, plus a few other types of temples and some important socioeconomic correlates. This work alone is very valuable! It also allows him to track differences across space in China over a long period.
4/
22.02.2025 14:29 — 👍 0 🔁 0 💬 1 📌 0
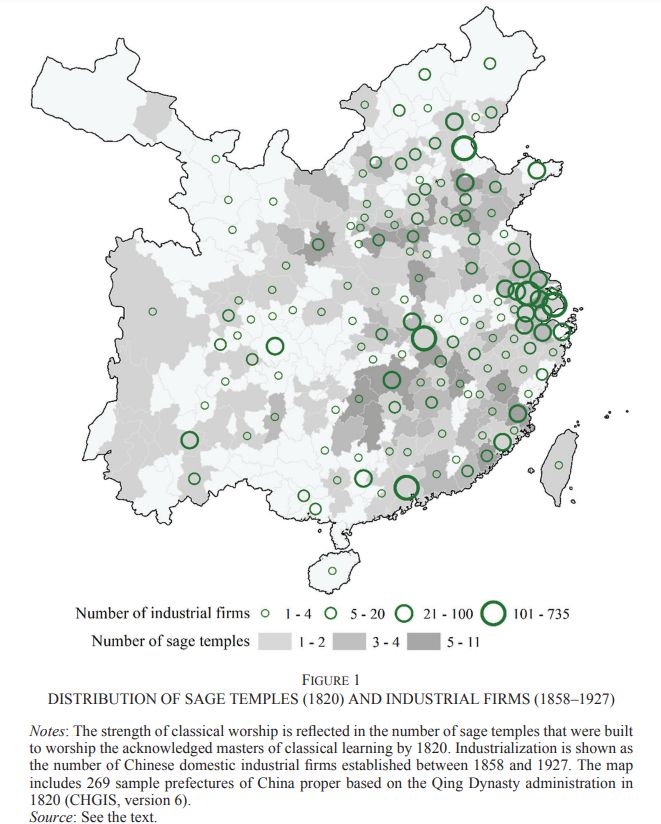
A map of sage temples against industrial firms
Ma Chicheng set out to investigate this in a recent paper in the Journal of Economic History.
He suggested that we might be able to use temples to the "sages", the founts of ancient knowledge, as proxies for more traditional forms of culture in Qing Chinese history.
3/
22.02.2025 14:29 — 👍 0 🔁 0 💬 1 📌 0
Economists are extremely interested in the question of culture for a few reasons.
It might help explain some puzzling discrepancies in growth rates between areas that are similar in all other observable respects.
It's also important for how economists theorize growth and change generally.
2/
22.02.2025 14:29 — 👍 0 🔁 0 💬 1 📌 0

Temple to Confucius/Kong Fuzi in Qufu
THREAD: How Does Culture Impact Economic Growth?
Economists are not famous for their discussions of culture and religion. However, increasingly they have come to recognize that culture might play a role in influencing long-term economic growth.
China might provide an interesting case study.
1/
22.02.2025 14:28 — 👍 0 🔁 0 💬 1 📌 1
 22.02.2025 13:40 — 👍 23 🔁 3 💬 1 📌 0
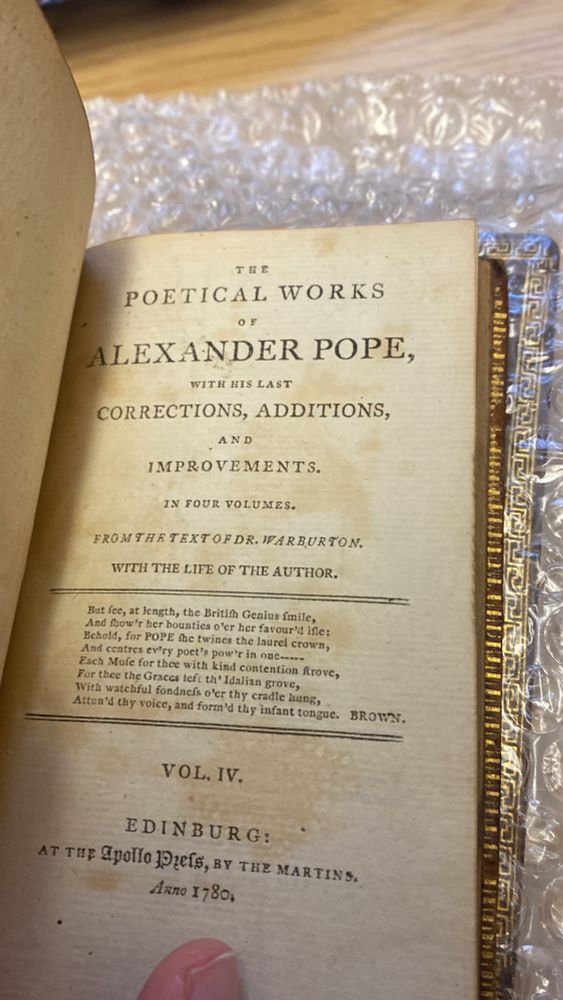
The title page of Alexander Pope’s collected works, 1780 edition, volume IV
Unbelievably excited to own this now…
20.02.2025 16:01 — 👍 0 🔁 0 💬 0 📌 0
What Do Cross-Gender Social Networks Look Like Across the World?
bsky.app/profile/jose...
17.02.2025 15:00 — 👍 0 🔁 0 💬 1 📌 0
A link to this exciting new paper:
Cross-Gender Social Ties Around the World:
www.nber.org/papers/w33480
9/9
17.02.2025 15:00 — 👍 0 🔁 0 💬 0 📌 0
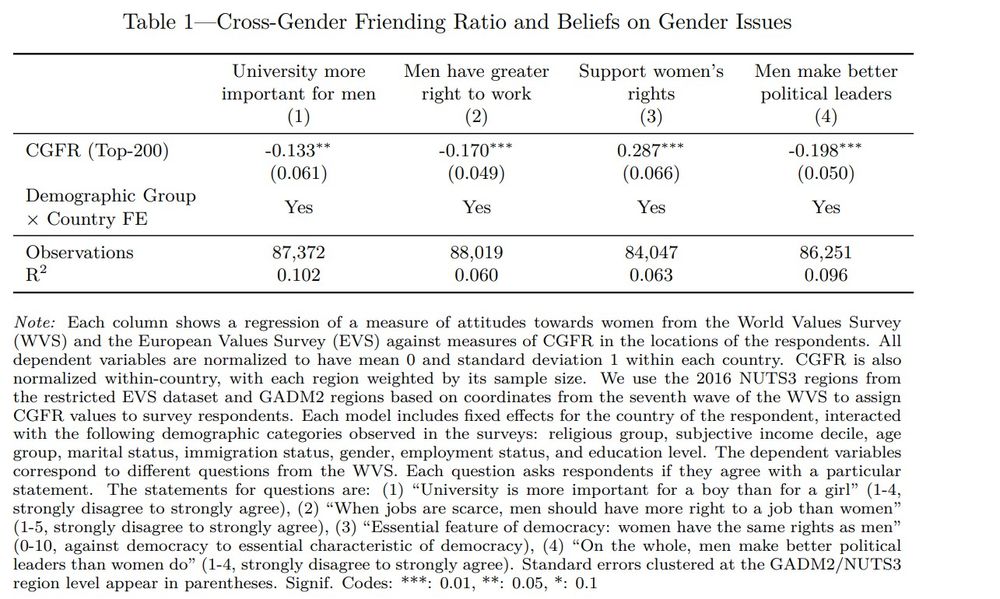
To sum up:
1) Facebook friending data can be used to construct the Cross-Gender Friending Ratio
2) The CGFR varies across regions of the world
3) It correlates strongly with feminist attitudes and female labour force participation
4) In the US, it is somewhat demographically polarized
8/
17.02.2025 14:59 — 👍 0 🔁 0 💬 1 📌 0
This is a very exciting new measure, and I'm sure it'll be used for lots of great research. The authors' regression results are preliminary, as they admit.
It's worth saying there may be selection biases: in very poor areas, only wealthier or better-educated people may have Facebook access.
7/
17.02.2025 14:59 — 👍 0 🔁 0 💬 1 📌 0
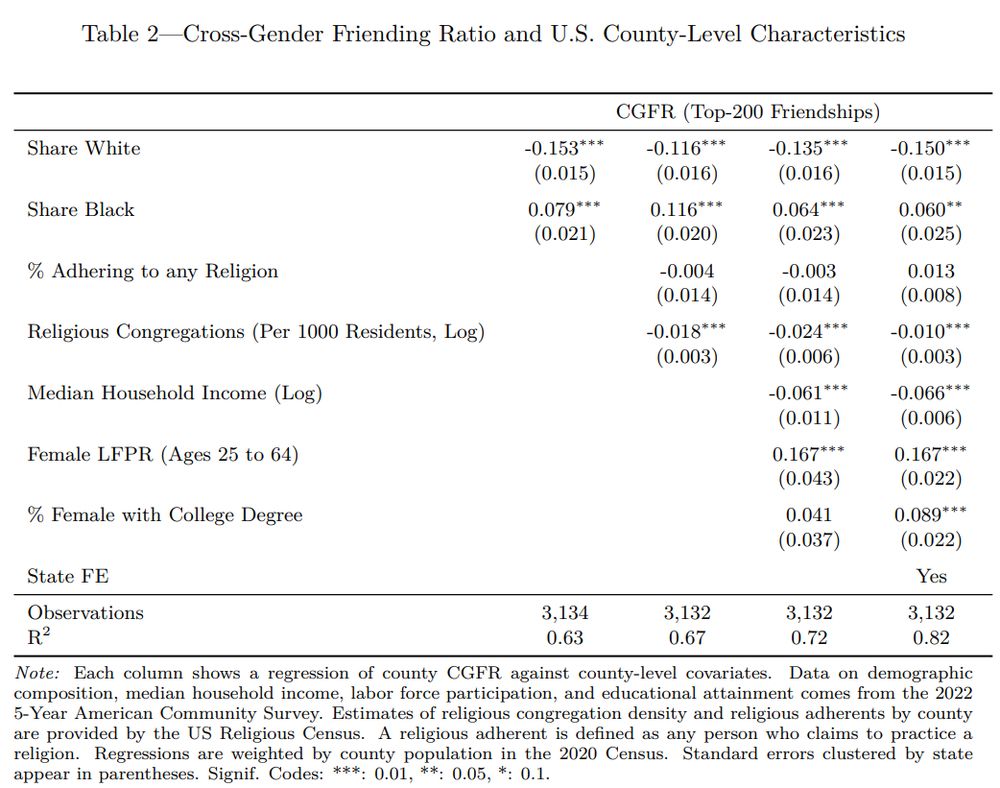
A table of results showing what is described
Looking more specifically at the US, there are some interesting socioeconomic and demographic correlations.
For example, it comes out that white people and rich people tend to have lower Cross-Gender Friending Ratios than poor, black, or Hispanic people. Religion's role is a bit more ambiguous.
6/
17.02.2025 14:59 — 👍 0 🔁 0 💬 1 📌 0
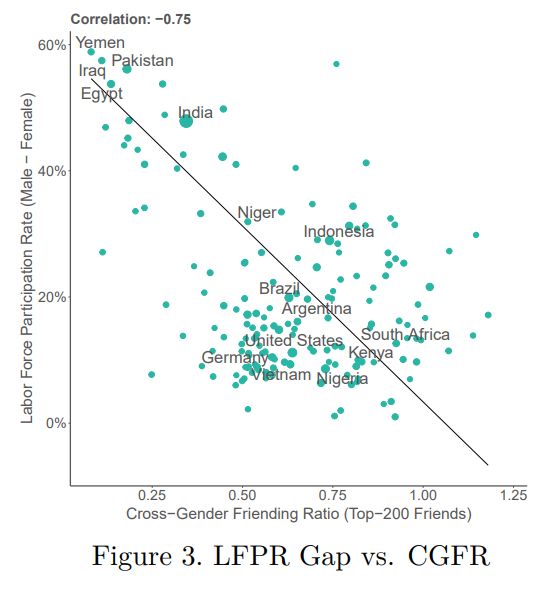
A graph of results showing what is described
A table of results showing what is described
The authors also did a few correlational analyses. These aren't super rigorous, but they're indicative.
For instance, having a higher Cross-Gender Friending Ratio usually means a country is more accepting of basic feminist ideas, and is likely to have higher female labour force participation.
5/
17.02.2025 14:58 — 👍 0 🔁 0 💬 1 📌 0
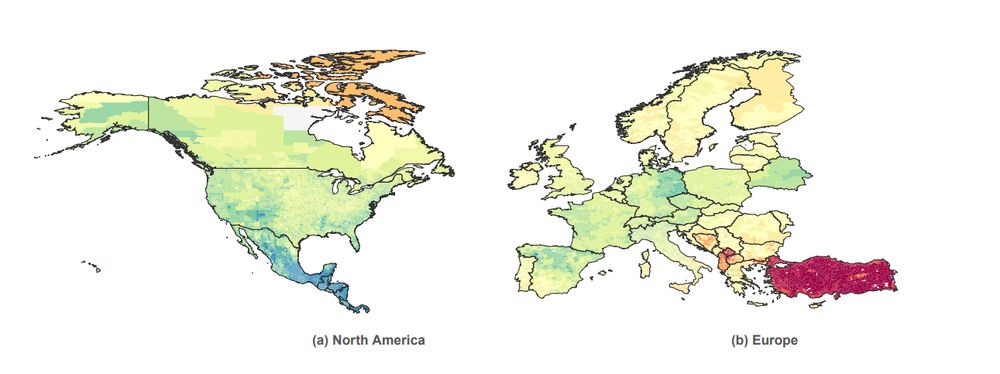
A pair of maps showing what is described
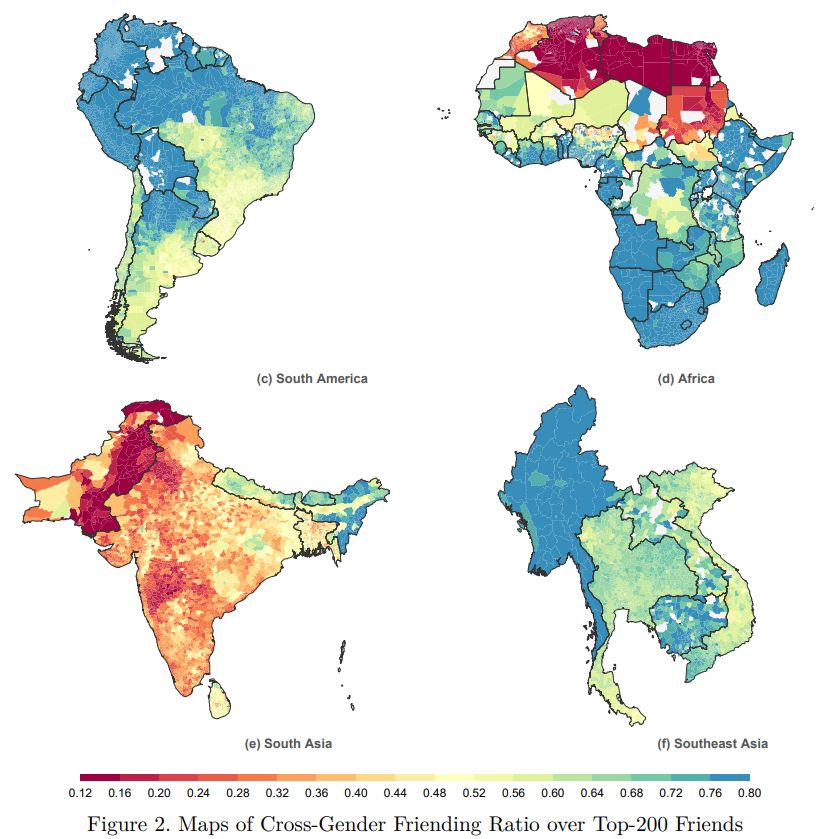
A set of four maps showing what is described, plus the scale
Looking broadly across the globe, interesting patterns appear.
Rates are lowest in traditionally Muslim areas like the Middle East and north Africa, and highest in Latin America and parts of Sub-Saharan Africa. Interestingly, Europe and the US are somewhere in the middle - perhaps surprisingly!
4/
17.02.2025 14:57 — 👍 0 🔁 0 💬 1 📌 0
In essence, they construct a measure based on Facebook friendships.
They use over a trillion friendship relations based on around 1.8 billion users to construct a measure, the Cross-Gender Friending Ratio: the ratio of female friends in men's networks to female friends in women's networks.
3/
17.02.2025 14:55 — 👍 0 🔁 0 💬 1 📌 0
A hot-off-the-press NBER Working Paper released today looks to answer this question.
It's important to social scientists, and has been for a very long time, because gross-gender social networks often control for social attitudes towards gender. Though they're important, measuring them is hard.
2/
17.02.2025 14:55 — 👍 0 🔁 0 💬 1 📌 0
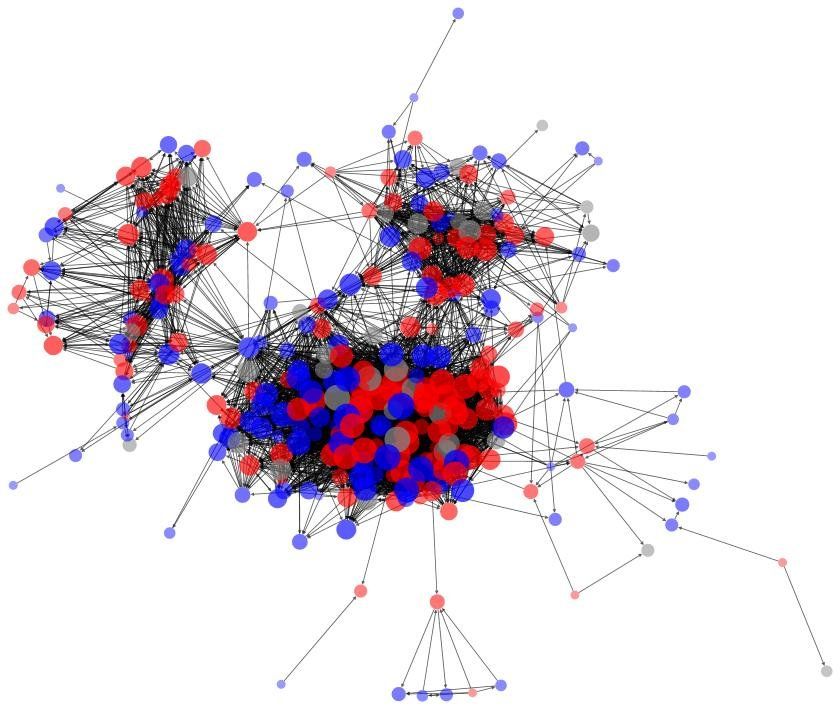
An image of a Facebook network, visualized as a graph
THREAD: What Do Cross-Gender Social Networks Look Like Across the World?
Gender often defines or colours our social networks and interactions. We might be more or less likely to make friends with someone because of their gender.
How does this look on the global scale, and how do we measure it?
1/
17.02.2025 14:55 — 👍 0 🔁 0 💬 1 📌 1
How Much Do We Really Want Equality?
bsky.app/profile/jose...
14.02.2025 13:55 — 👍 0 🔁 0 💬 1 📌 0
As ever, the paper under discussion:
Measuring Preferences for Income Equality and Income Mobility:
direct.mit.edu/rest/article...
10/10
14.02.2025 13:55 — 👍 0 🔁 0 💬 0 📌 0
So, to sum up:
1) On average, people would sacrifice c. $2,750 of average income to raise the income of the bottom 10%
2) They would only sacrifice c. $1,200 to raise the bottom 20%'s income mobility
3) Ideology shapes (or is shaped by) people's preferences on inequality
9/
14.02.2025 13:54 — 👍 0 🔁 0 💬 1 📌 0
Lecturer in LGBTQ+ History/History of Sexuality, University of Glasgow.
I wrote this book: https://global.oup.com/academic/product/teaching-gender-9780198937494
Sharing the Gospels missing from your Bible 🙋🏻♀️
https://othergospels.com
An independent politics blog founded in 2025 by two Oxford grads with too much time on our hands. We’re non-partisan but opinionated; encouraging of discussion; and committed to rigorous long-form analysis.
Our website: https://www.nonselectcommittee.com
Historian in WNC, working on THE ANDY GRIFFITH SHOW and the atomic gospel of Fred Kirby, teaching part-time at Lees-McRae College, opinions my own, available for professional consultation.
🌳📜 Genealogy (mine, or whoever's) ideally; these days, usually bile.
🟣 𐃆
גירא בעינא דשטנא
📍 Hamilton, ON (#HamOnt), Canada
🔗: pymundgenealogy.com
That's nothing, there was a guy in here yesterday with a chicken.
Canadian theologian with work on Barth, TRC, forgiveness, church leadership, Bonhoeffer, and film. Lifelong fan of the #Canucks and #LFC. he/him
🎬 http://letterboxd.com/joncoutts
✍️ http://thissideofsunday.blogspot.com
Philip McCouat writes in-depth articles on art, history and social change in the Journal of Art in Society at http://artinsociety.com
Art, architecture, and history from Late Antique, Early Christian, and the Byzantine eras
Associate Professor at Emory University.
Causal Inference | Difference-in-Differences | Econometrics. Dad x4
Economist, Enthusiast of Chess, Math, Music and similar items. Data Dude.
Some call me the space cowboy, some call me the gangster of love. Sober 9 years.
Known to rearrange thoughts in other people's brains.
Economic Historian of Medieval Europe.
Assistant Professor, LSE Economic History.
🇨🇦 in London.
Green campaigner • Climate and social justice • Disability and queer liberation • Aspiring ukulele player • Work @uk100.org • Views my own
Producer of cartoons! creator of #HazbinHotel + #HelluvaBoss & more! musical loving trash🎶Founder of SpindleHorse! I'm loud and I curse a lot!
Policy, political and economic analysis. The UK should be an R&D lab with an economy attached 🌐🚀🏳️🌈
Deputy editor at Foreign Policy, China nerd, gaming nerd, reads a lot
Where the House of Commons and the House of Lords scrutinise the work of the Government. Explore Parliament on a tour this summer.
linktr.ee/ukparliament
News & information from the UK Parliament’s second chamber. Produced by its staff to show how the Lords checks and challenges the UK government.
https://www.parliament.uk/business/lords/
Where elected MPs represent the public, legislate, and scrutinise the Government. Find out more about their work and how Parliament happens.