Hmm poster image seems to be a black square. That's fun.
Here's the intended image?

@erikbrockbank.bsky.social
Postdoc @Stanford Psychology
Hmm poster image seems to be a black square. That's fun.
Here's the intended image?
This project came together with a wonderful crew of collaborators, co-led by Logan Cross with @tobigerstenberg.bsky.social, @judithfan.bsky.social, @dyamins.bsky.social, and Nick Haber
12.08.2025 22:55 — 👍 0 🔁 0 💬 0 📌 0
Our work shows how LLM-based agents can serve as models of human cognition, helping us pinpoint the bottlenecks in our own learning.
Read the full paper here: tinyurl.com/mr356hyv
Code & Data: tinyurl.com/3napnpsm
Come check out our poster at CCN on Wednesday!
In sum: limitations in pattern learning in this setting aren't just about memory or reasoning power, but about considering the right strategy space.
These results also make a prediction: the same kind of verbal scaffolding might help humans overcome cognitive bottlenecks in the same task.
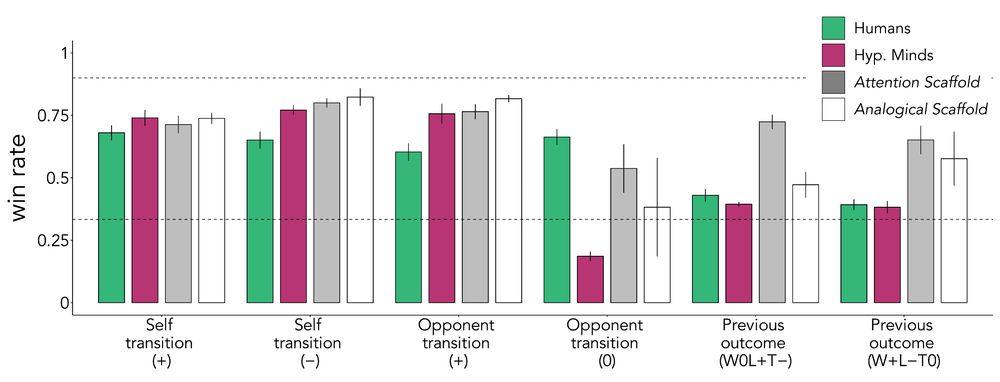
So, can we "teach" the model to think of better hypotheses?
By giving the model verbal scaffolding that directed its attention to relevant features (e.g., "pay attention to how the opponent's move changes after a win vs. a loss"), it discovered complex patterns it had previously missed.
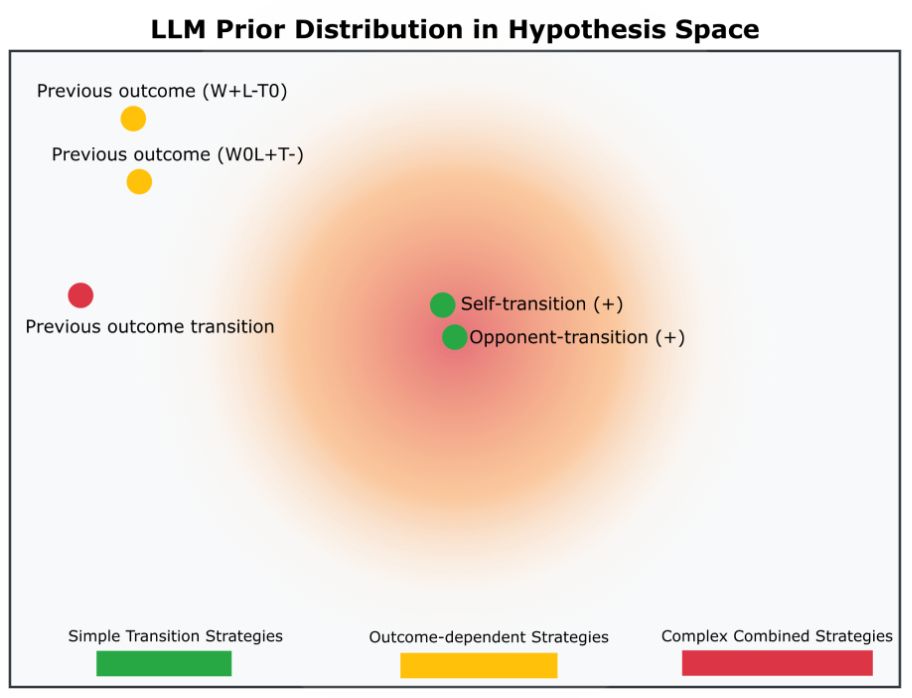
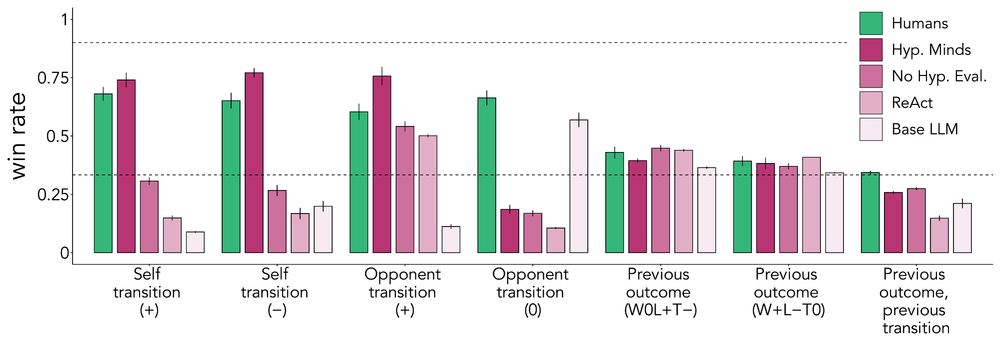
How can we help the model generate the right hypotheses? We started with simple interventions that people could do too: making the model generate more hypotheses or more diverse ones (increasing LLM temp.). Neither worked. HM was stuck searching in the wrong part of the hypothesis space.
12.08.2025 22:55 — 👍 0 🔁 0 💬 1 📌 0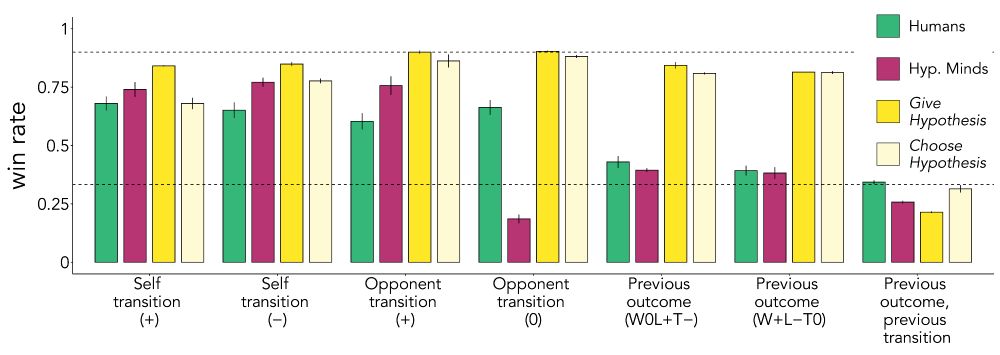
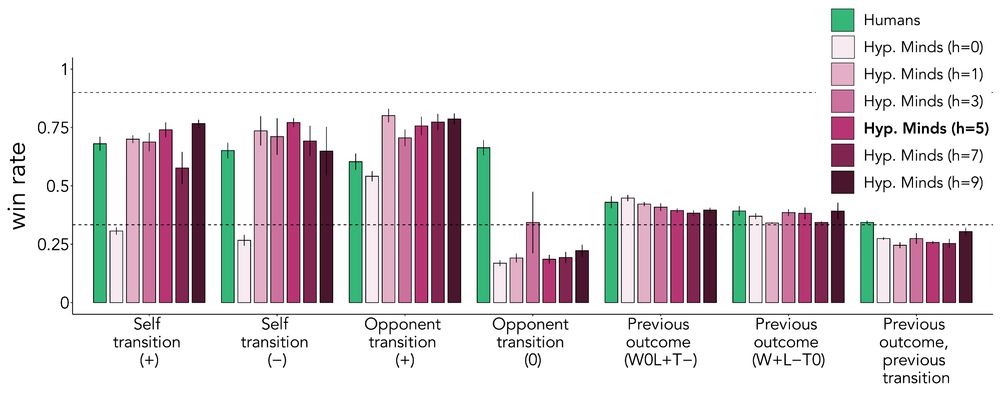
The answer seems to be Hypothesis Generation.
When we gave HM an explicit description of the opponent's strategy, its performance soared to >80% win rates against almost all bots. When we gave it a list of possible strategies, HM was able to accurately evaluate which one fit the data best.
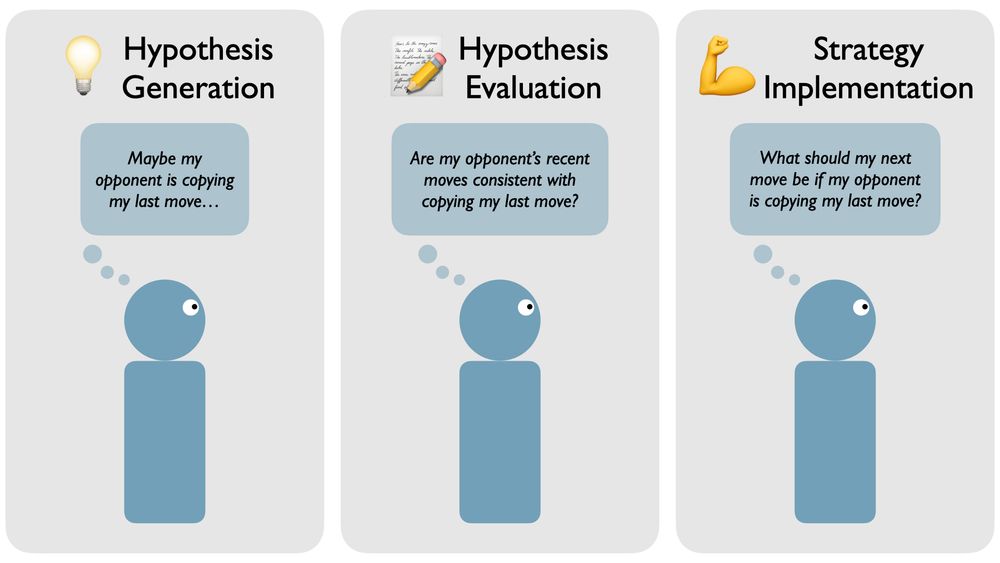
This led to our central question: What is the main bottleneck for both humans and our model?
* Coming up with the right idea? (Hypothesis Generation)
* Figuring out if an idea is correct? (Hypothesis Evaluation)
* Knowing what move to make with the right idea? (Strategy Implementation)
Here's where it gets interesting. When we put HM in the same experiment, it closely mirrored human performance: It succeeded against simple opponents and performed around chance against complex ones, suggesting HM may be mirroring key aspects of the cognitive processes in this task.
12.08.2025 22:55 — 👍 0 🔁 0 💬 1 📌 0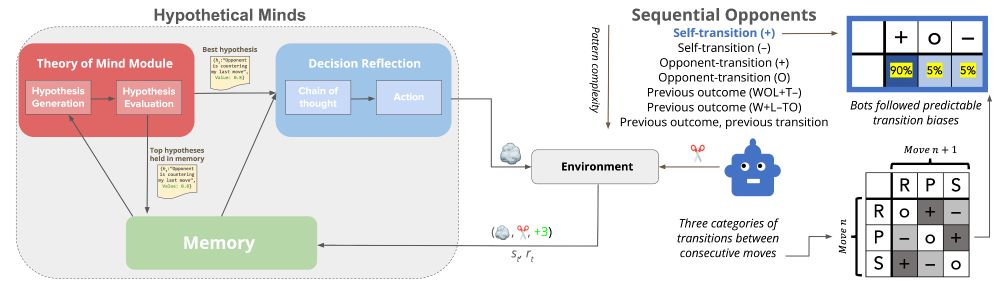
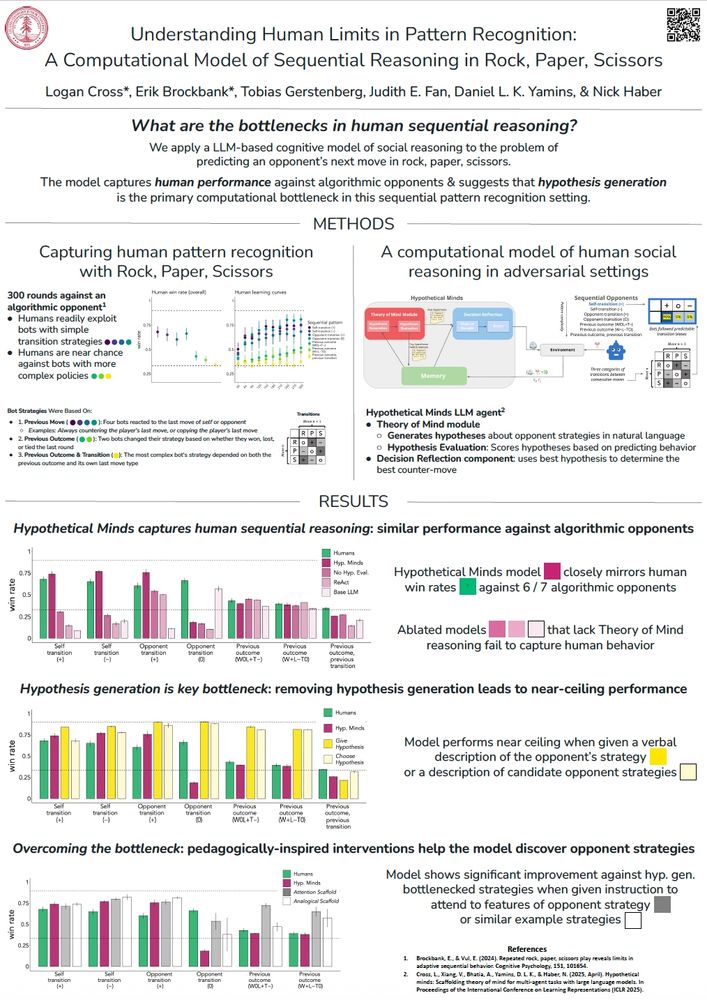
To find out, we deployed an LLM-based agent called Hypothetical Minds (HM) as a model of the cognitive processes needed to adapt to RPS opponents.
HM tries to outwit its opponent by generating and testing natural language hypotheses about their strategy (e.g., "the opponent copies my last move")
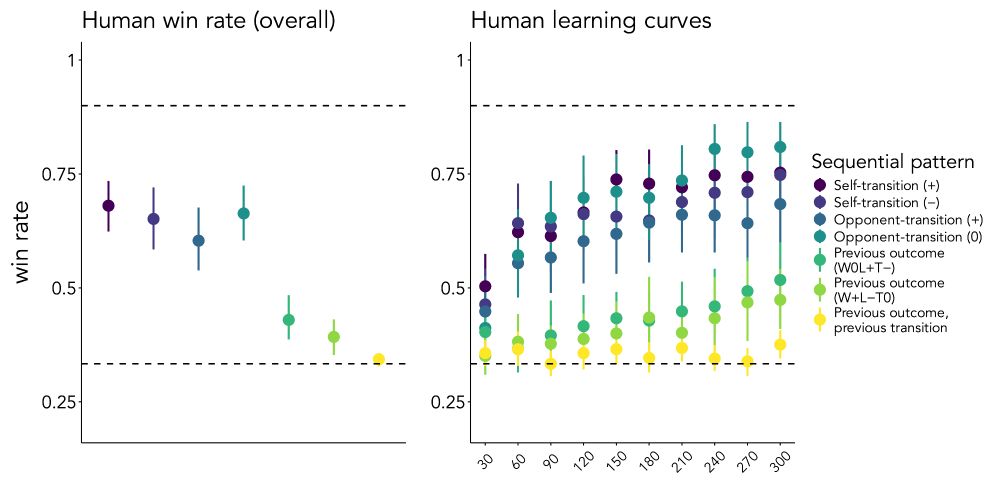
In RPS, you win by exploiting patterns in your opponent’s moves. We tested people’s ability to do this by having them play 300 rounds of RPS against bots with algorithmic strategies. The finding? People are great at exploiting simple patterns but struggle to detect more complex ones. Why?
12.08.2025 22:55 — 👍 0 🔁 0 💬 1 📌 0
How do we predict what others will do next? 🤔
We look for patterns. But what are the limits of this ability?
In our new paper at CCN 2025 (@cogcompneuro.bsky.social), we explore the computational constraints of human pattern recognition using the classic game of Rock, Paper, Scissors 🗿📄✂️
Awesome work led by @kristinezheng.bsky.social on how we can predict learning in data science classes.
Data science is a field that should be accessible and understandable for everyone, but many people struggle with it.
Come check out Kristine's poster at CogSci this week to learn about why :)
Since then, we’ve also run a study exploring how good *people* are at this same prediction task.
Come check out our poster at CogSci (poster session 1 on Thursday), or check out our video summary for virtual attendees, to get the full story :)
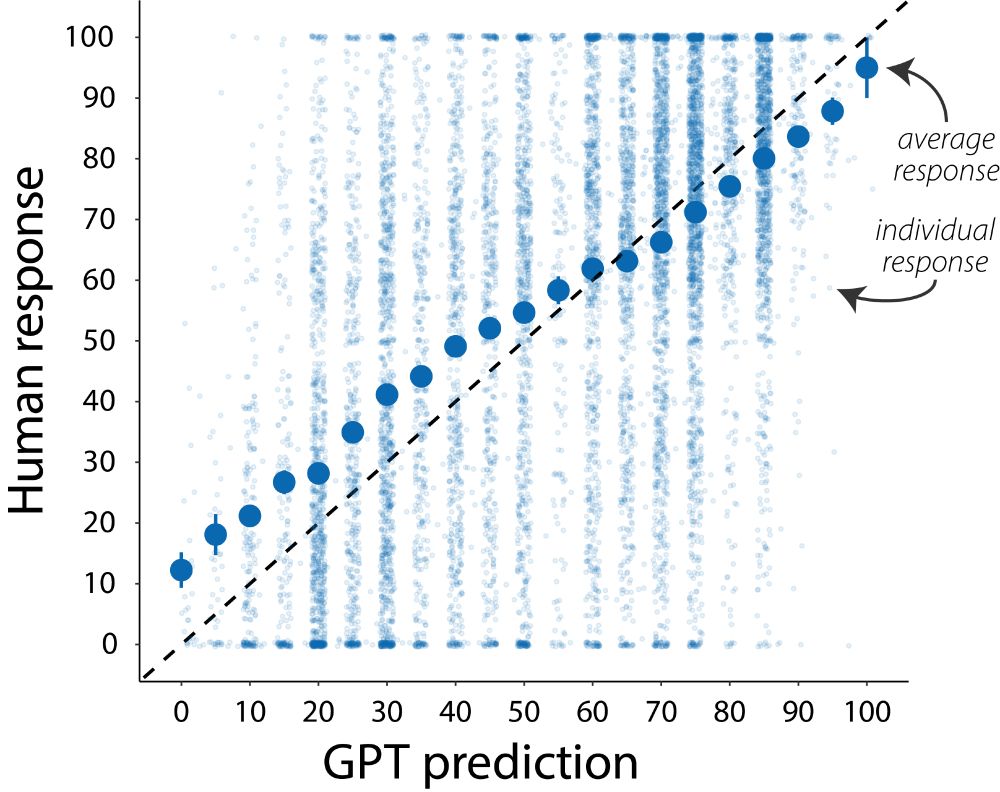
We had GPT-4o use each person’s written answers to guess their responses on the personality scales.
GPT does well, even when we correct for guessing the most typical responses.
This means in some cases, people’s answers to the questions contain information about what they are like.
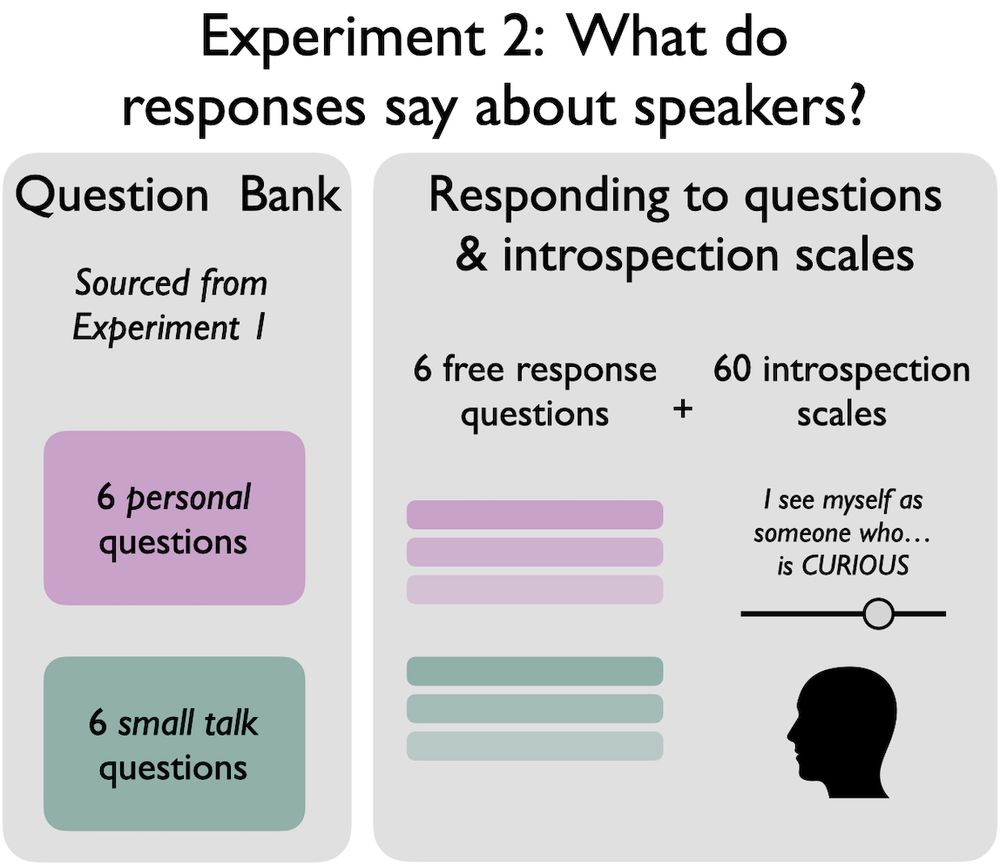
Psychologists often use sliding scale personality surveys to learn about people’s traits.
Do people learn the same thing about others from their answers to “deep” questions?
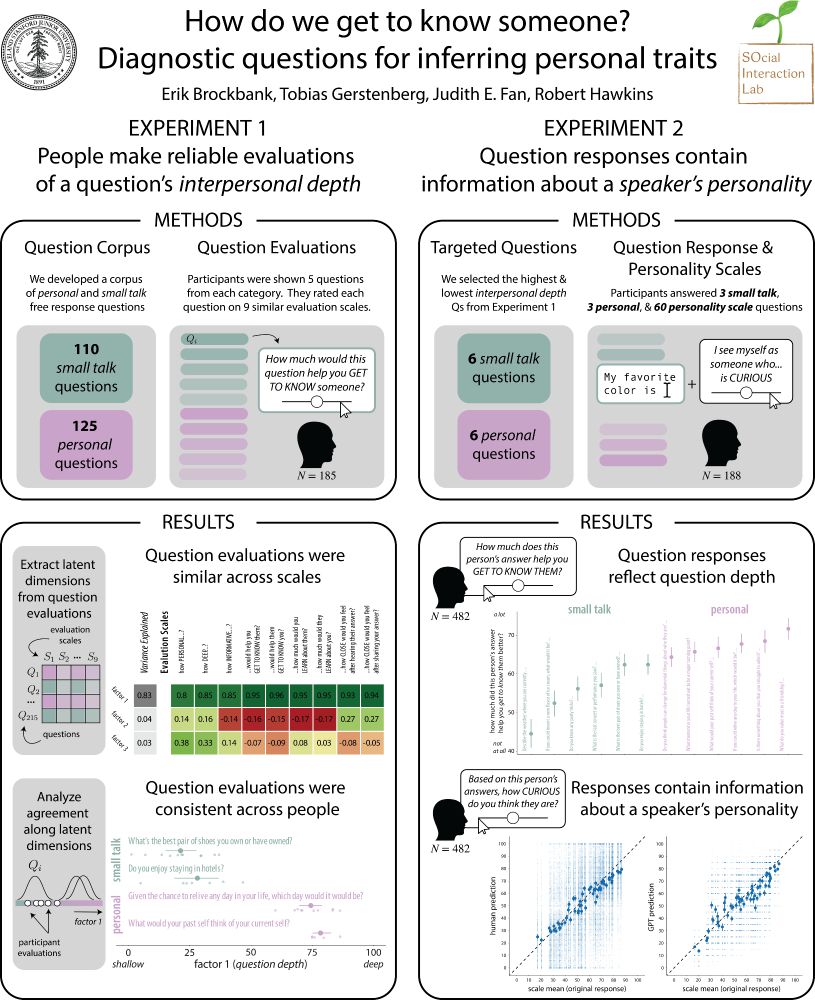
In our second study, online participants wrote answers to some of these questions and also completed a personality survey.
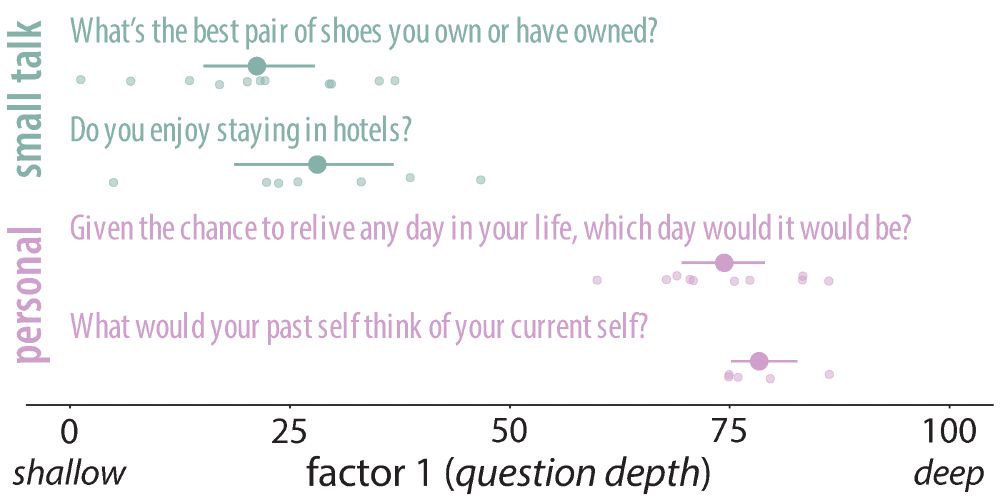
We find that the question ratings tended to be similar across all 9 scales and between different people.
If we combine the ratings for each question, we get a pretty good measure of its “interpersonal depth”, with “small talk” Qs at the low end and more “personal” Qs at the high end.
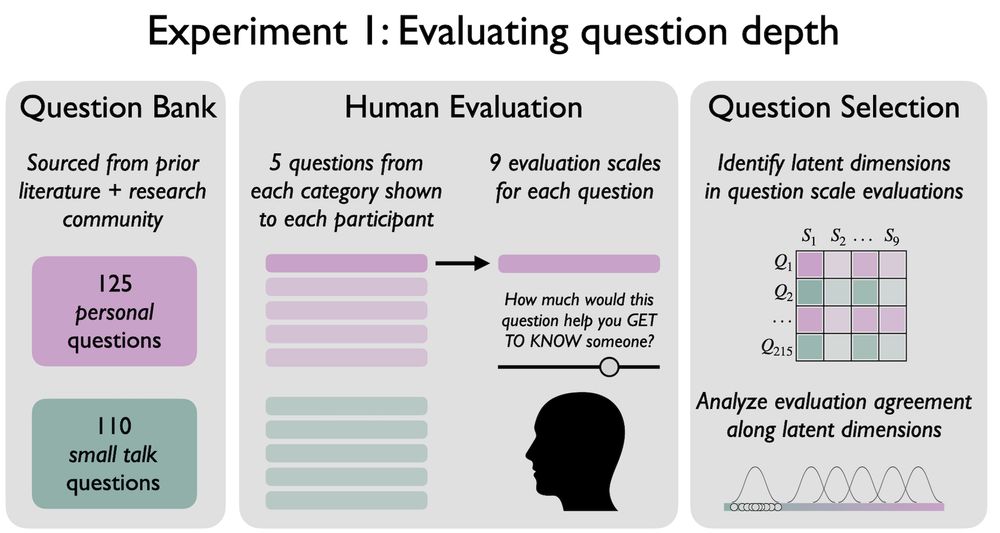
In our first experiment, we developed a corpus of 235 open-ended questions: half were “small talk” (“favorite sports team?”) and half were “personal” (“greatest fear?”).
We asked online participants to rate the Qs on different scales related to whether they would help them get to know a stranger.
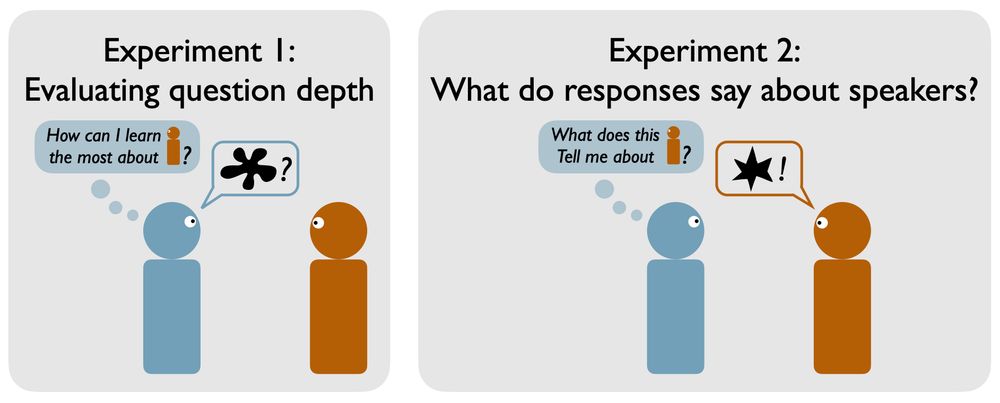
This project asks what kind of questions are most useful for getting to know others.
We made a bank of questions and in two studies:
1) people evaluated the questions for whether they would help get to know somebody
2) we measured what people’s answers reveal about their personality
"36 Questions That Lead To Love" was the most viewed article in NYT Modern Love.
Excited to share new results investigating these and other “deep questions” with @tobigerstenberg.bsky.social @judithfan.bsky.social & @rdhawkins.bsky.social
Preprint: tinyurl.com/bdfx5smk
Code: tinyurl.com/3v6pws4s
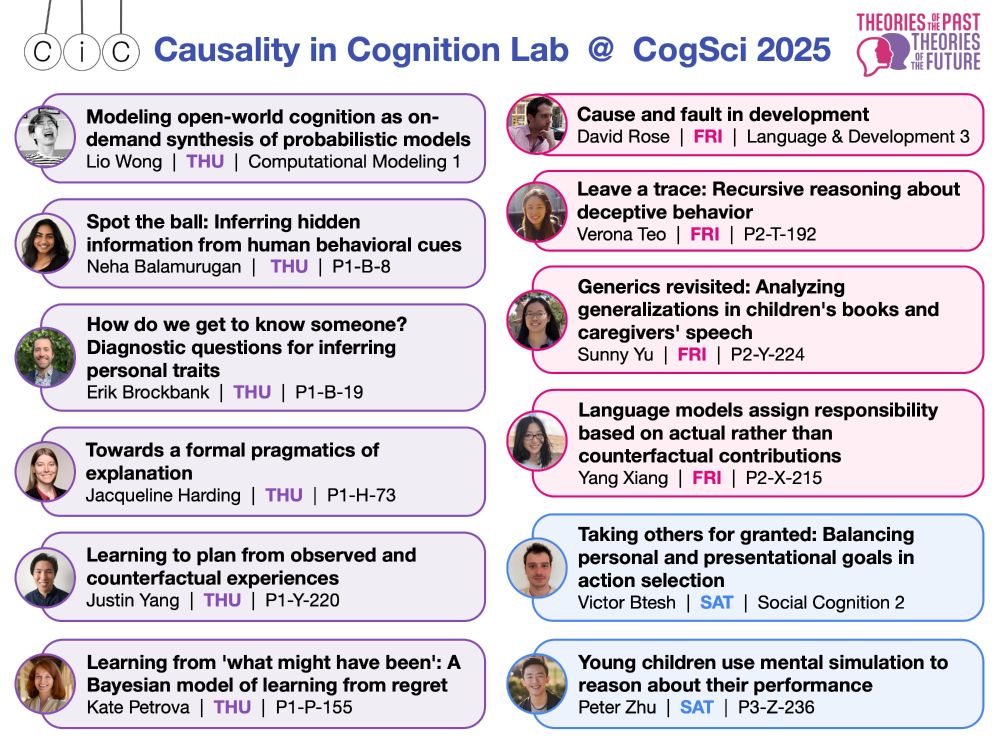
The Causality in Cognition Lab is pumped for #cogsci2025 💪
25.07.2025 15:47 — 👍 57 🔁 8 💬 0 📌 0Really fun project spearheaded by @veronateo.bsky.social, come check out our poster at CogSci!
29.07.2025 19:06 — 👍 1 🔁 0 💬 0 📌 0This is heartbreaking and barbaric
28.04.2025 20:31 — 👍 1 🔁 0 💬 0 📌 0Whoops I apparently have no idea how graphics work, please enjoy this hilarious inverted SVG situation and head to project-nightingale.stanford.edu to see the *real* graphic
07.03.2025 18:00 — 👍 6 🔁 1 💬 0 📌 0
Project Nightingale logo
We’re working on developing those now! Stay tuned for updates from us at Project Nightingale (project-nightingale.stanford.edu), a new collaborative effort to advance the science of how people reason about data!
07.03.2025 17:05 — 👍 5 🔁 0 💬 1 📌 0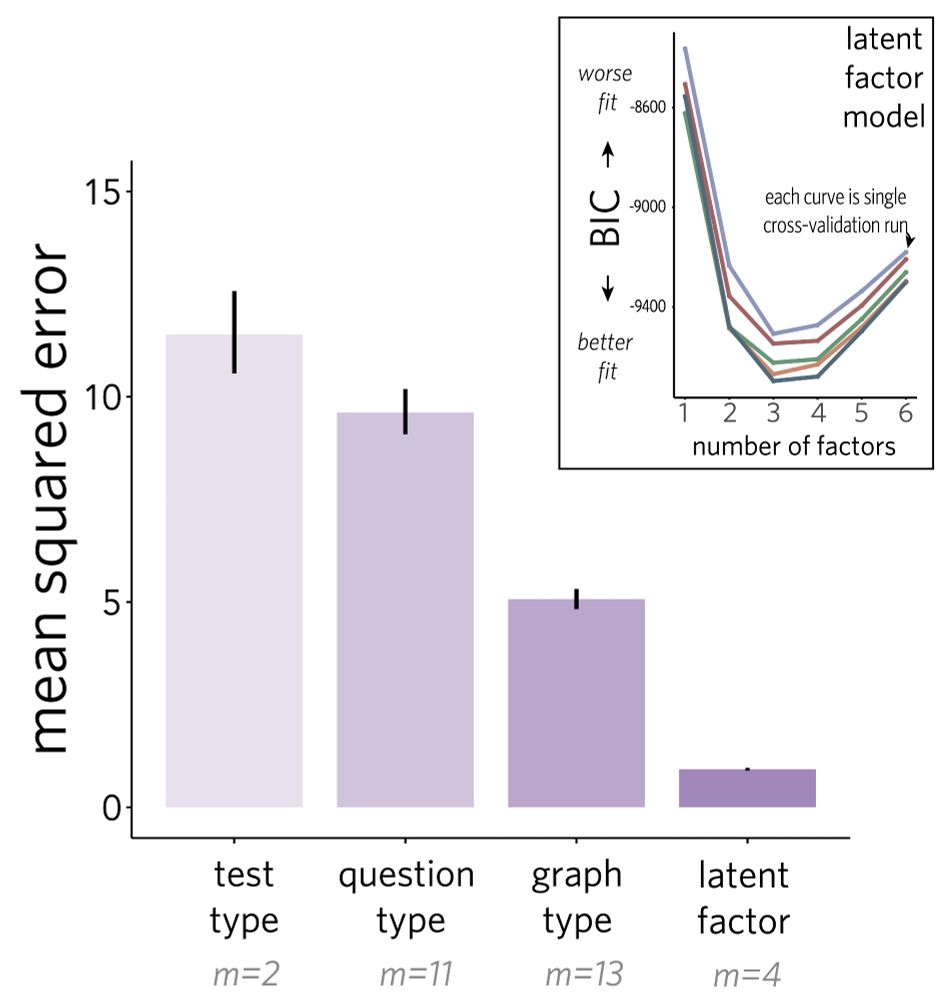
A bar plot with four factor analysis models on X (one for test type, question type, graph type, and a "latent factor" model). The mean squared error of predicting participants' responses is plotted on Y. Inset is a line plot showing cross validation runs in which the latent factor model consistently has the lowest BIC with 3-4 factors.
When we dug into the specific patterns of mistakes people made, we found that the best way to predict those patterns wasn’t the kind of plot (or type of question, e.g., “find the max”), but other underlying factors … but we need more comprehensive tests to identify them with certainty.
07.03.2025 17:05 — 👍 4 🔁 0 💬 1 📌 0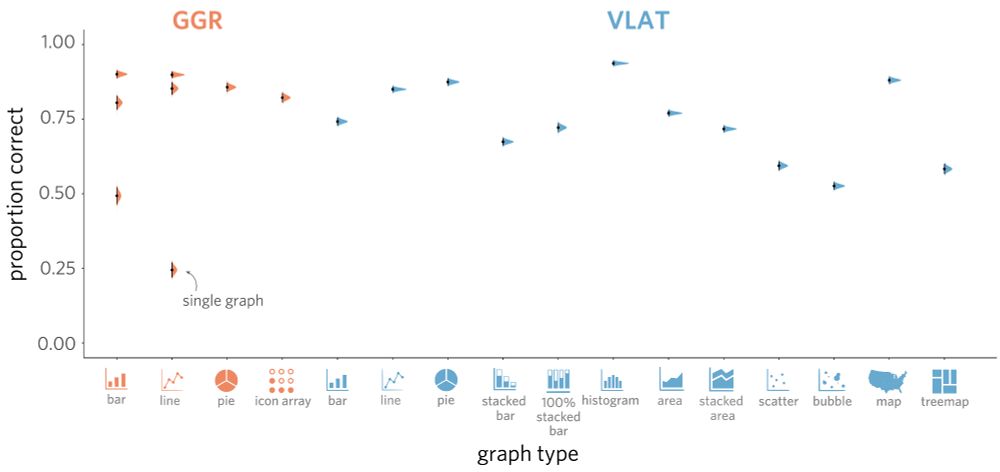
A plot with different graph types on X (e.g., bar plot, line plot) and the proportion correct for participants' responses on Y. The data is shown with right-angled gaussians around the mean proportion correct for each graph type. The gaussians are color coded to indicate each of the two assessments.
Maybe the two tests track how much easier some plots are to understand than others? If so, those plots should be reliably hard (or easy) across the board. But clearly there’s more going on here—performance wasn’t always consistent for a given kind of plot (e.g., bar charts) within or across tests.
07.03.2025 17:05 — 👍 3 🔁 0 💬 1 📌 0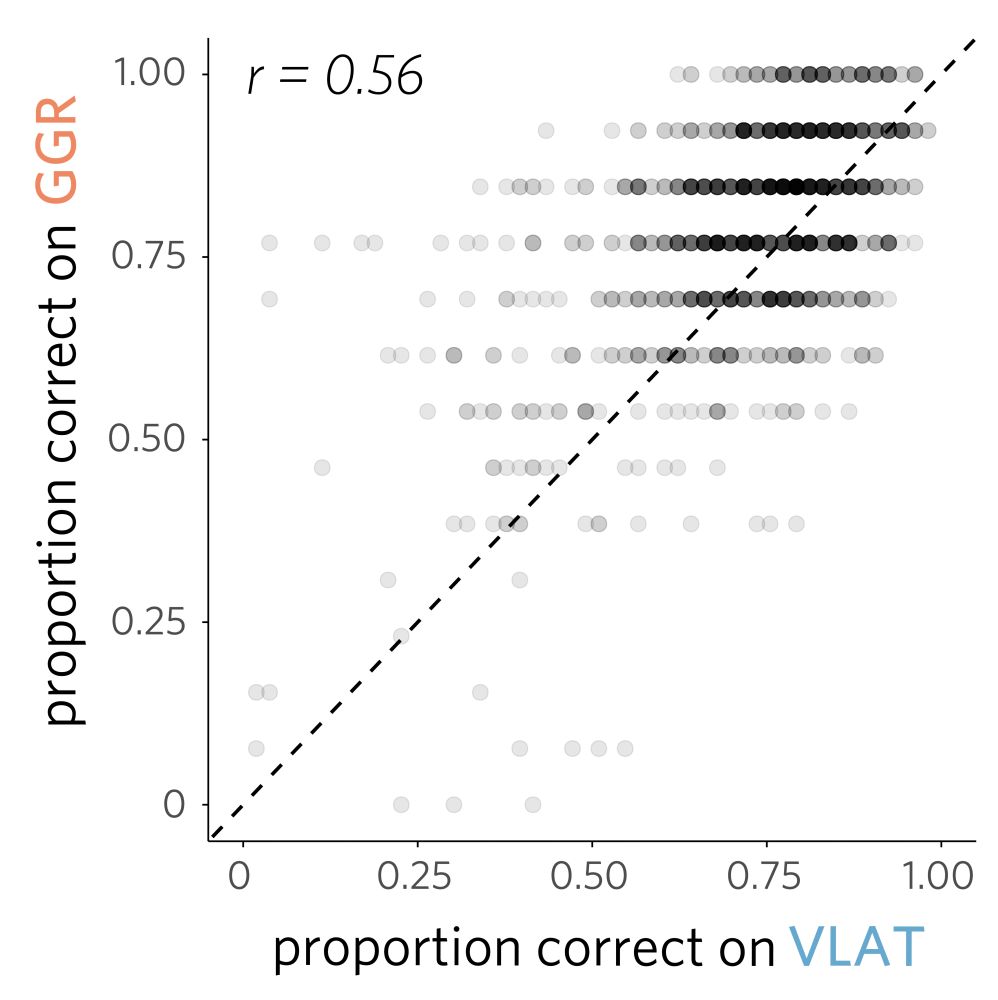
A scatterplot of participants' scores on each of the two assessments showing their correlation
We found that people who did well on one test often did well on the other… so maybe they are measuring similar things. What might those be?
07.03.2025 17:05 — 👍 3 🔁 0 💬 1 📌 0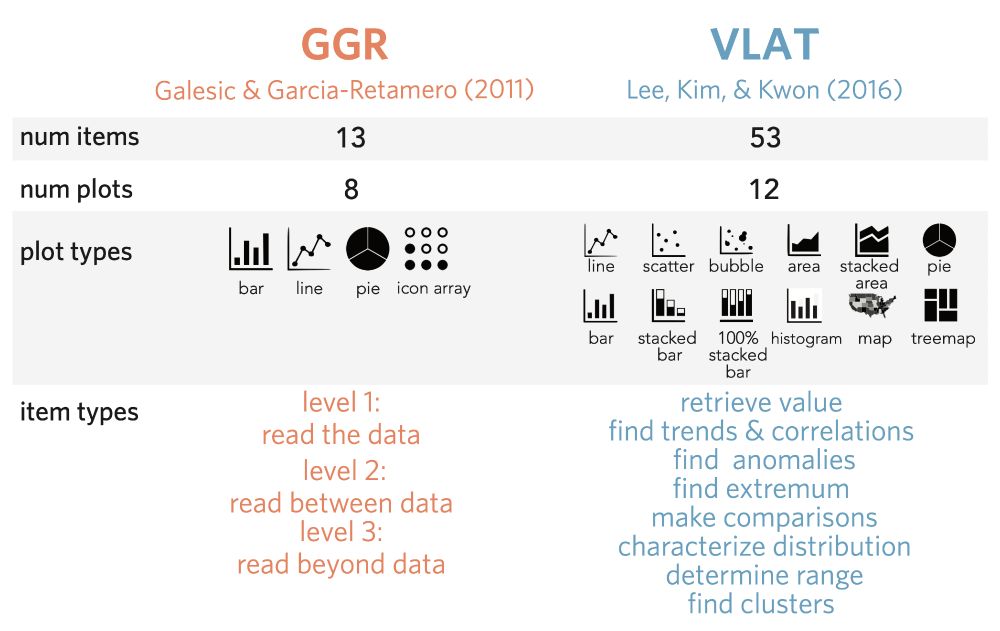
A graphic showing the key features of two data visualization literacy assessments: the number of items in each test, the number of plots, the types of plots, and the types of items (for example, "retrieve value")
What measures are out there? We took two commonly used tests—one proposed by Galesic & Garcia-Retamero, 2011 (“GGR”) and another from Lee, Kim, & Kwon, 2016 (“VLAT”)—and gave all 66 questions from both tests to a diverse group of U.S. adult participants (N=1,113).
07.03.2025 17:05 — 👍 4 🔁 0 💬 1 📌 0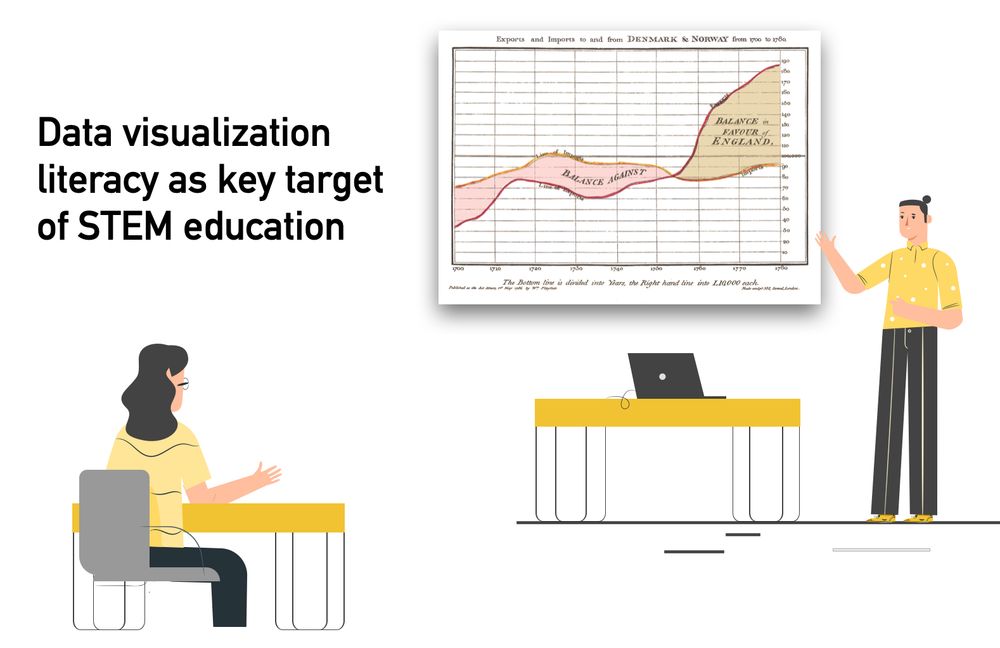
A graphic showing a student sitting in front of a teacher demonstrating a graph with the header "Data visualization literacy as key target of STEM education"
Learning to read is obviously important—that includes learning how to “read” data visualizations!
After all, plots exist to help us make sense of the vast, complicated world we live in. That's why you see them everywhere!
But to know if people understand them we need solid viz literacy measures.