The EUMETSAT Climate Symposium is from 28–30 October 2025.
The event will take place at darmstadtium Science and Congress Center in the heart of Darmstadt, Germany, 30km south of Frankfurt.
Register now to join us & celebrate 25 years of Climate@EUMETSAT: www.eventsforce.net/eumetsat/fro...
31.07.2025 08:43 — 👍 10 🔁 4 💬 2 📌 0
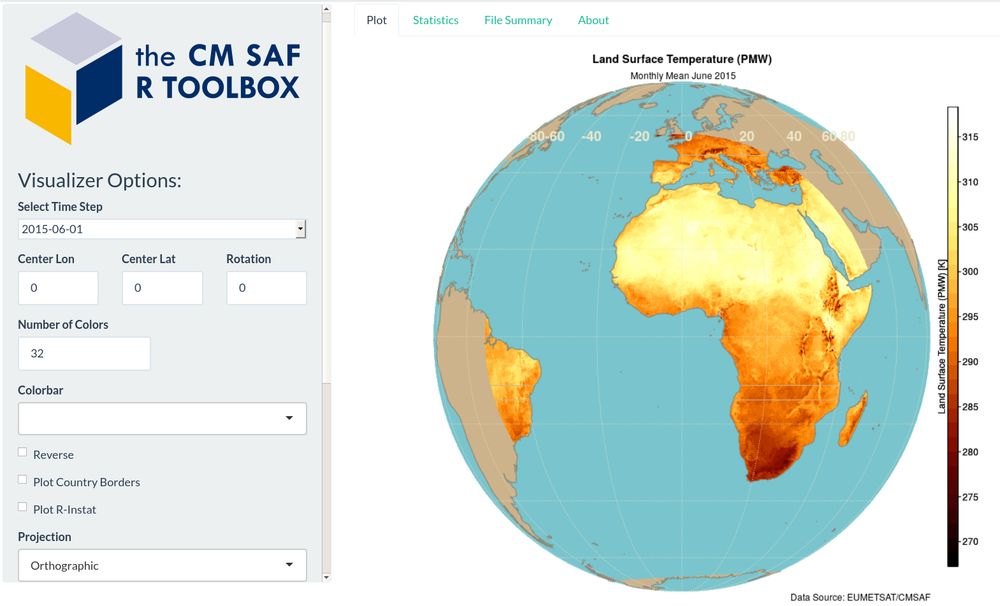
Screenshot of the R Toolbox visualization tab. It shows a map of the Land Surface Temperature.
We’d love to hear from you! Is there still demand for tools like the CM SAF R Toolbox? Would you find it valuable if we continue developing it further? We know a web-based version would be great, but the resources required for this are substantial. Let us know your thoughts!
18.07.2025 09:13 — 👍 3 🔁 0 💬 0 📌 0

Infographic on the main features of the CM SAF R Toolbox: Prepare, Analyze and Visualize.
🎉 Celebrating 10 years of the CM SAF R Toolbox! Launched in summer 2015, it has been downloaded over 80,700 times. A big thank you to all users for your continued support and feedback! Here's to more years of data analysis and climate insights.
👉 www.cmsaf.eu/R_toolbox
18.07.2025 09:11 — 👍 3 🔁 1 💬 1 📌 0
Today at #LPS25:
CM SAF presents 25 years of sustained satellite Climate Data Records - from clouds to radiation, precipitation, humidity & more.
Supporting climate services with high-quality ECVs and near-real-time updates.
🕦 11:30 | Session A.05.02
📍 Room 1.31/1.32
26.06.2025 04:19 — 👍 3 🔁 0 💬 0 📌 0
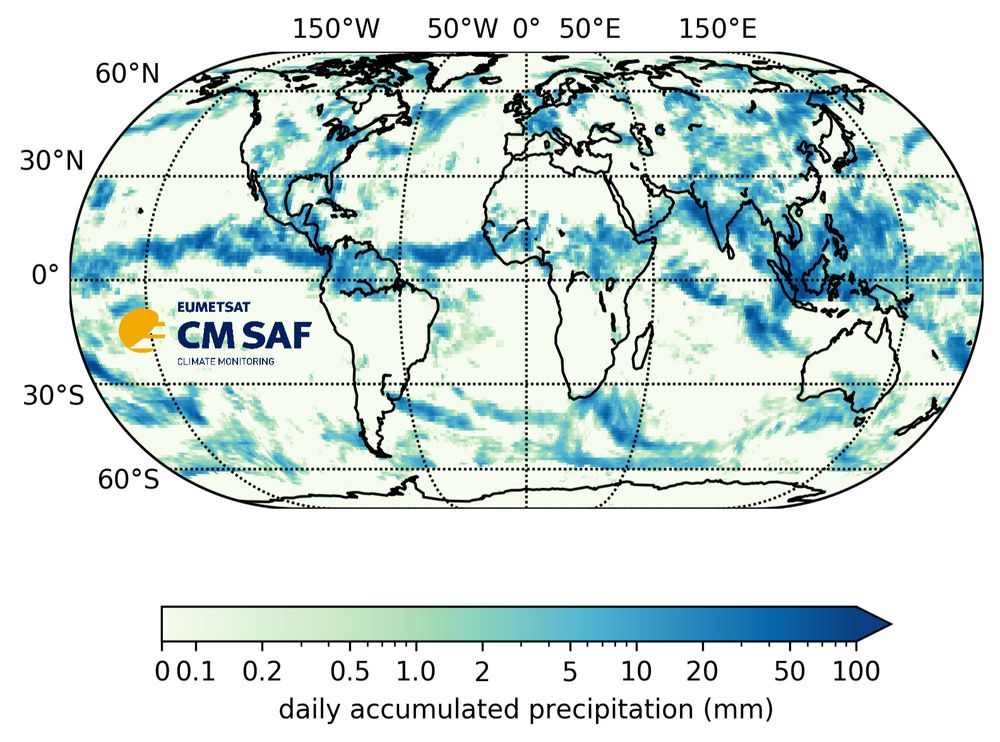
Global map of GIRAFE v1 daily accumulated precipitation on 2021/07/13
🌧️ Today at #LPS25:
We present GIRAFE v1 – a new global satellite-based precipitation climate data record with daily uncertainty estimates.
🕓 16:15 | Session A.07.08
📍 Room 1.15/1.16
Join us to learn more about the GIRAFE algorithm & validation!
24.06.2025 04:44 — 👍 3 🔁 0 💬 0 📌 0
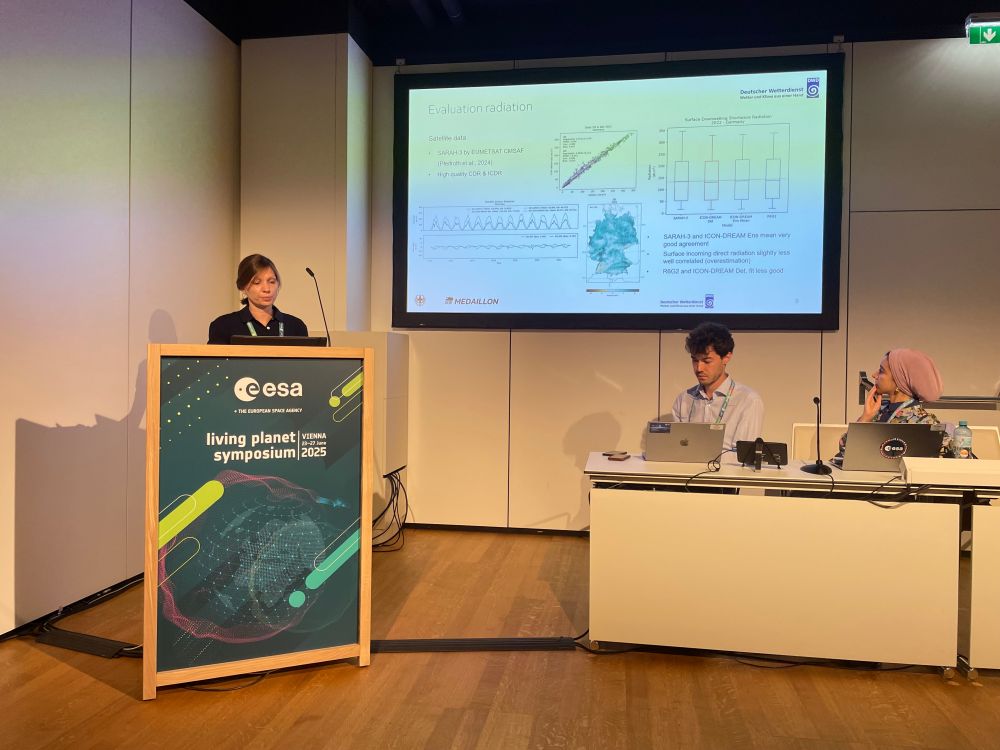
Helga is presenting SARAH-3 data, which are used within the Medaillon project.
Today at #LPS25:
Helga presents a multi-model ensemble approach to support Germany’s energy transition.
Satellite-derived solar radiation data from CM SAF’s SARAH-3 is combined with reanalysis wind data to assess energy potential under extreme weather.
#MEDAILLON
23.06.2025 19:42 — 👍 5 🔁 1 💬 0 📌 0
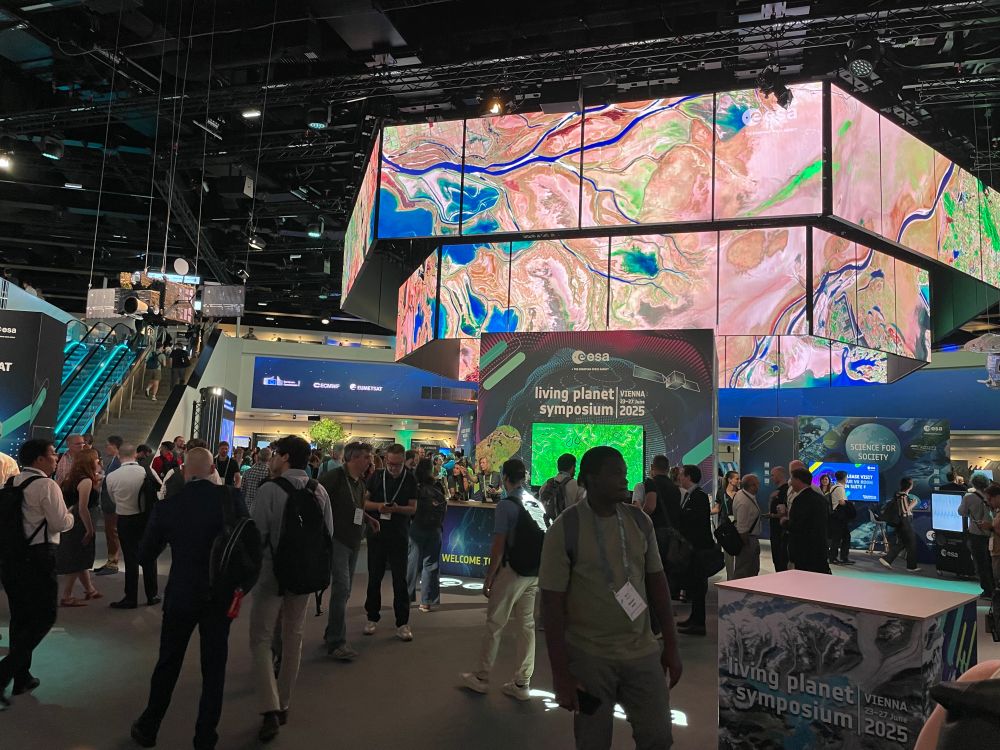
Picture of the LPS main hall.
Today marks the start of the ESA Living Planet Symposium 2025 in Vienna - the world’s largest Earth observation conference! 🌍
CM SAF experts and users are here to present satellite-based climate data and applications.
📍Find us in Vienna! #LPS25
23.06.2025 19:32 — 👍 6 🔁 0 💬 1 📌 0
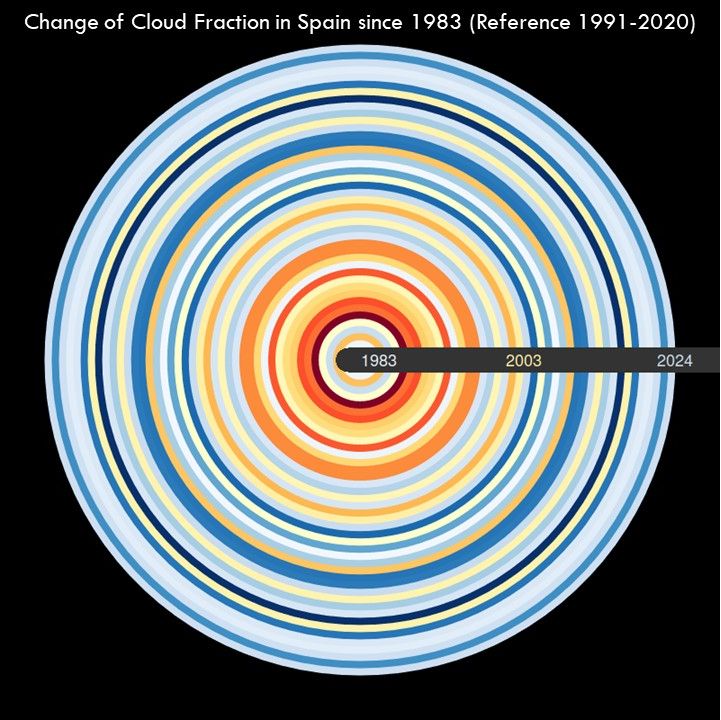
Circular stripe plot showing annual climate anomalies from 1983 to 2024. The plot shows cloud fraction over Spain. The colors range from red (more clouds) to blue (fewer clouds), indicating a decreasing trend in cloud cover.
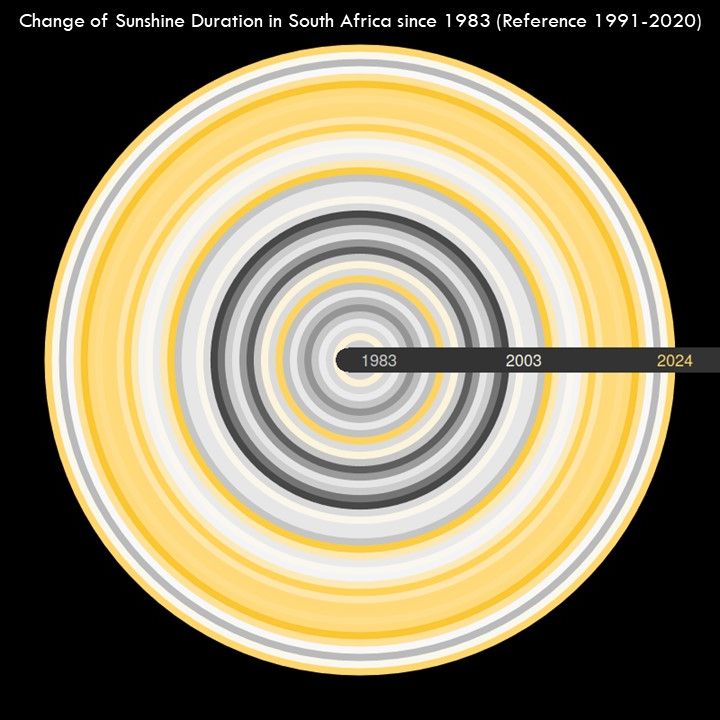
Circular stripe plot showing annual climate anomalies from 1983 to 2024.The plot shows sunshine duration over South Africa. Each stripe represents one year. The colors range from grey (less sunshine) to yellow (more sunshine), showing a general increase over time.
Today is #ShowYourStripes day!
We’re joining in with two examples from CM SAF satellite data:
☁️ Cloud fraction over Spain
☀️ Sunshine duration over South Africa
Each stripe shows the anomaly of a year since 1983 – a visual reminder of our changing climate.
👉 www.cmsaf.eu
21.06.2025 06:09 — 👍 3 🔁 1 💬 0 📌 0
D·A·CH 2025 Conference
Next week: the D·A·CH Meteorology Conference 2025 in Bern 🇨🇭
Experts from weather & climate meet to exchange ideas – incl. CM SAF users sharing how satellite-based climate data support their work.
Looking forward to inspiring talks!
👉 dach2025.oeschger.unibe.ch
20.06.2025 14:15 — 👍 1 🔁 0 💬 0 📌 0
Wherever you live in the world, your climate is getting warmer.
21st June is #ShowYourStripes day when we encourage everyone to use the warming stripes graphics to talk about climate change and how we are all already experiencing the consequences.
Download your stripes: www.ShowYourStripes.info
04.06.2025 13:46 — 👍 1000 🔁 395 💬 41 📌 24
The agenda is now online for Climate@EUMETSAT!
28–30 October 2025
Darmstadtium in Darmstadt, Germany.
Sessions will cover topics including climate policy, the future design of satellite climate products, & data access & utilisation.
Details & registration at: www.eventsforce.net/eumetsat/fro...
30.05.2025 11:08 — 👍 8 🔁 6 💬 2 📌 1
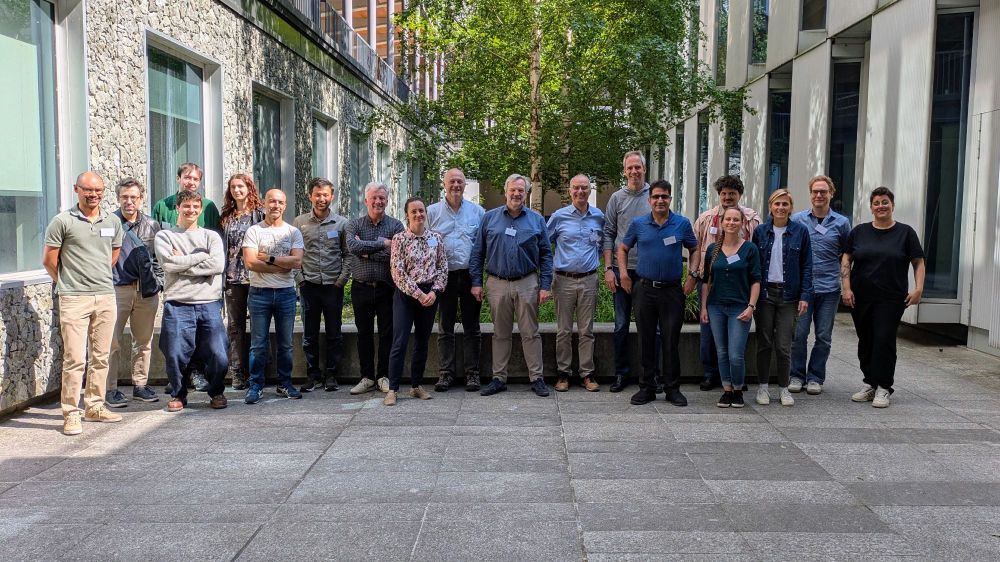
Group photo of the participants of the workshop on “global precipitation monitoring in a joint European effort”.
This week we are joining the workshop on “global precipitation monitoring in a joint European effort” hosted by Institut Pierre Simon Laplace @ipsl.bsky.social in Paris and look forward to discussing requirements, production and use cases of precipitation datasets for climate analysis and services.
15.05.2025 09:33 — 👍 2 🔁 1 💬 0 📌 0
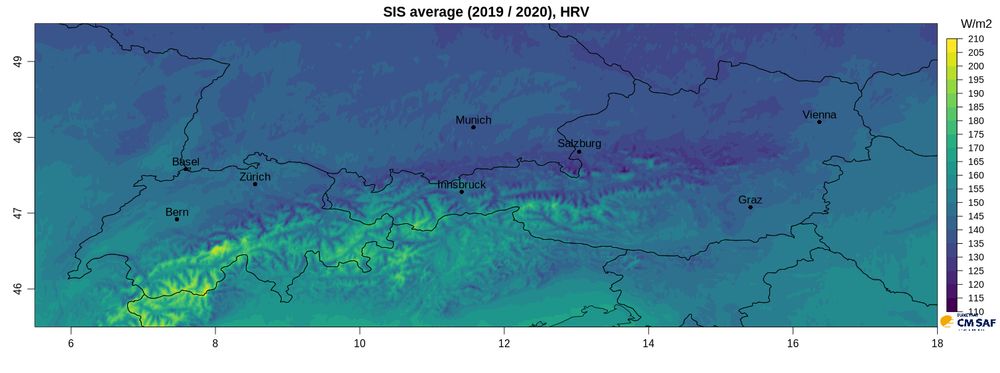
High resolution solar radiation HANNA data over the Alps. The average of the surface solar incoming radiation over the years 2019 to 20020 shows small scale variations due to clouds, snow cover, altitude and terrain shadow.
🌞 Just released: HANNA – high-res solar radiation data for Europe!
15-min resolution, \~1 km grid, derived from Meteosat rapid scans with terrain-aware processing.
Perfect for PV modeling, now available for 2019–2020
via CM SAF.
More: contact.cmsaf@dwd.de
14.05.2025 15:00 — 👍 3 🔁 1 💬 0 📌 0
Correlations and trends of the surface solar radiation, the cloud coverage and the NAO. – A case study for the North Atlantic, Europe and North Africa - Meteorologische Zeitschrift — Schweizerbart sc...
🌤️ A new study uses CM SAF SARAH-3 & CLARA-A3 to analyse 1983–2020 trends in solar radiation & cloud cover over Europe and North Atlantic.
The findings show rising solar radiation in the north & complex links to NAO.
📖 Read more: doi.org/10.1127/metz...
06.05.2025 09:52 — 👍 3 🔁 0 💬 0 📌 0
Looks like space agrees! 🌍
Our satellite-based data also show a strong sunshine duration anomaly over the UK in April 2025.
Sneak peek here 👉 bsky.app/profile/cm-s...
05.05.2025 11:47 — 👍 1 🔁 1 💬 0 📌 0
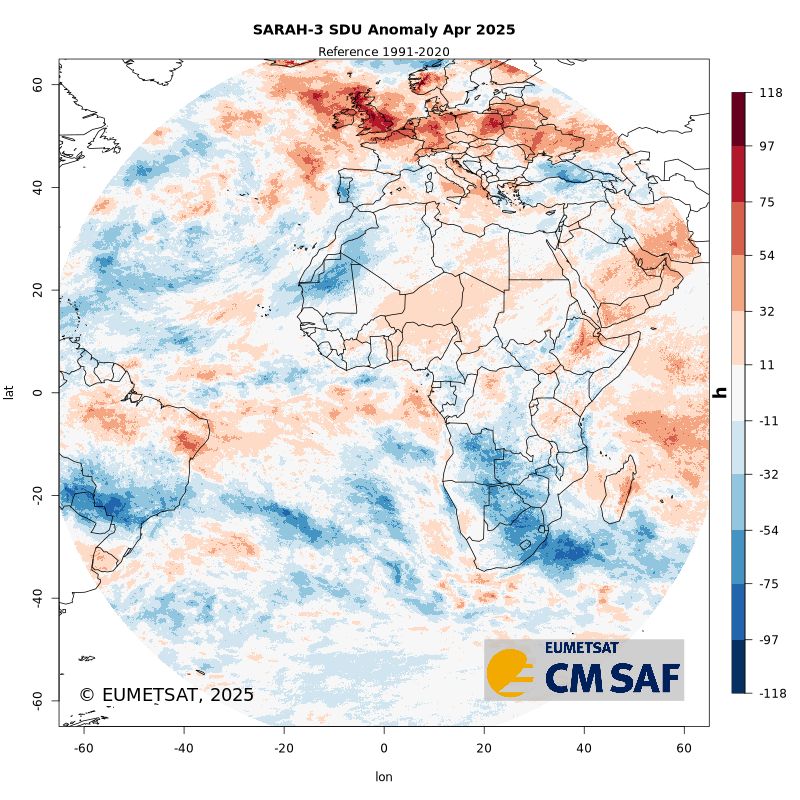
Anomaly of CM SAF SARAH sunshine duration (SDU) for April 2025 in reference to 1991-2020. There are strong positive values over the UK and Central Europe.
🌞 Sneak peek: CM SAF's upcoming demonstrational anomaly service!
Shown: SDU anomaly for April 2025 — strong positive values over the UK & Central Europe.
Got thoughts or feedback? We'd love to hear from you!
#Sunshine #ClimateData #SatelliteObservations
05.05.2025 11:38 — 👍 2 🔁 1 💬 0 📌 1
A graphic for the event with the text: Climate Symposium; From space to climate services: co-creation in action; Darmstadt, Germany; 28-30 October 2025/
🎉 Join us in celebrating 25 years of Climate@EUMETSAT!
Registration is open for the symposium 'From Space to Climate Service: Co-creation in Action'
28 – 30 October 2025
Darmstadtium in Darmstadt, Germany. 🇩🇪
Full details at: www.eventsforce.net/eumetsat/fro...
23.04.2025 13:03 — 👍 12 🔁 3 💬 0 📌 0
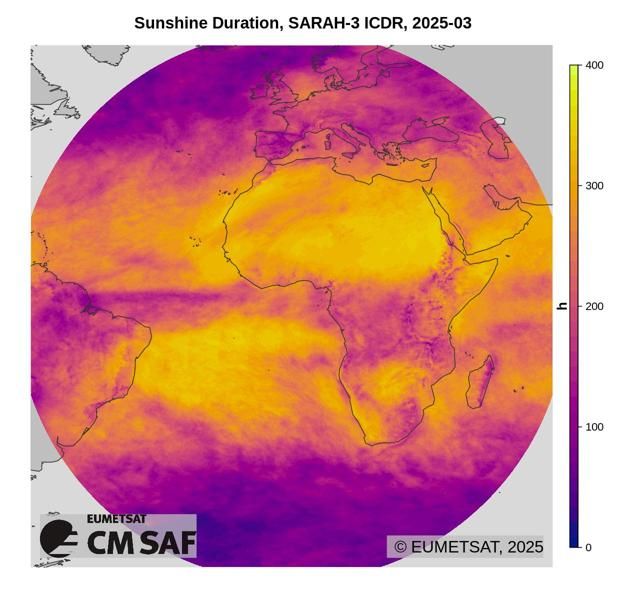
Example CM SAF product: Sunshine duration for March 2025 from the SARAH-3 Climate Data Record. It shows the distribution of accumulated sunshine for this month.
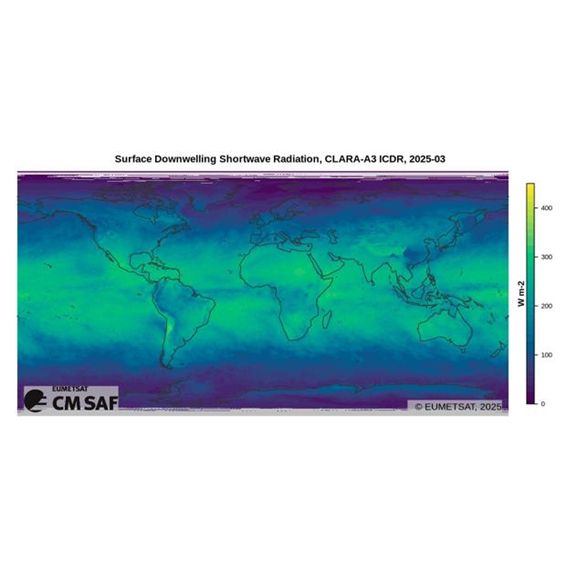
Example CM SAF product: Surface Downwelling Short-wave Radiation (SIS) for March 2025 from the CLARA-A3 Climate Data Record. It shows the global distribution of SIS.
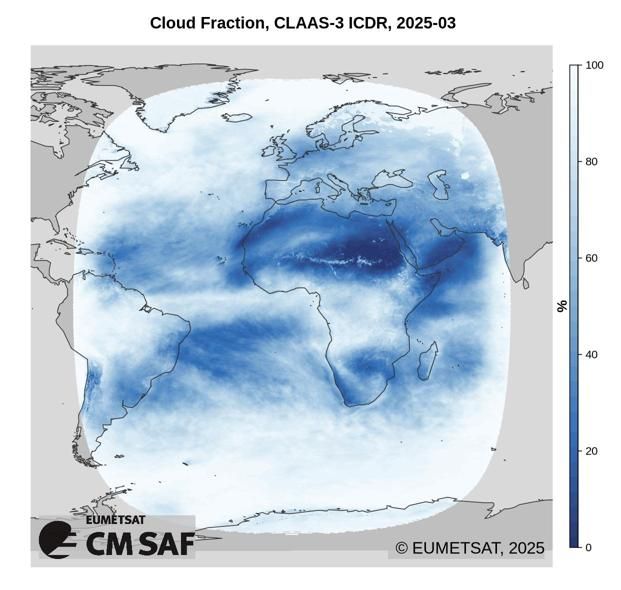
Example CM SAF product: Cloud Fraction for March 2025 from the CLAAS-3 Climate Data Record. It shows the distribution of clouds within the region covered by the Metosat SEVIRI instrument.
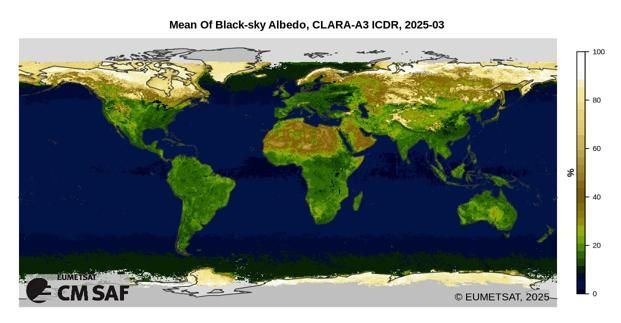
Example CM SAF product: Surface albedo in March 2025 by the CLARA-A3 Climate Data Record. It shows the global distribution of surface albedo.
📢 CM SAF is now on Bluesky! ☁️
We provide satellite-based climate data on key parameters of the Earth’s energy and water cycle – including:
☀️ radiation (surface & TOA), sunshine duration
☁️ cloud fraction
🌧️ precipitation, water vapour
🌎 surface albedo and more.
🔗 Explore our data: cm-saf.eumetsat.int
25.04.2025 08:58 — 👍 5 🔁 2 💬 0 📌 0
We’ve landed on Bluesky! Follow us for the latest on climate data and services. #ClimateData #SatelliteData #EarthObservation #ClimateServices
25.04.2025 08:48 — 👍 4 🔁 0 💬 0 📌 0
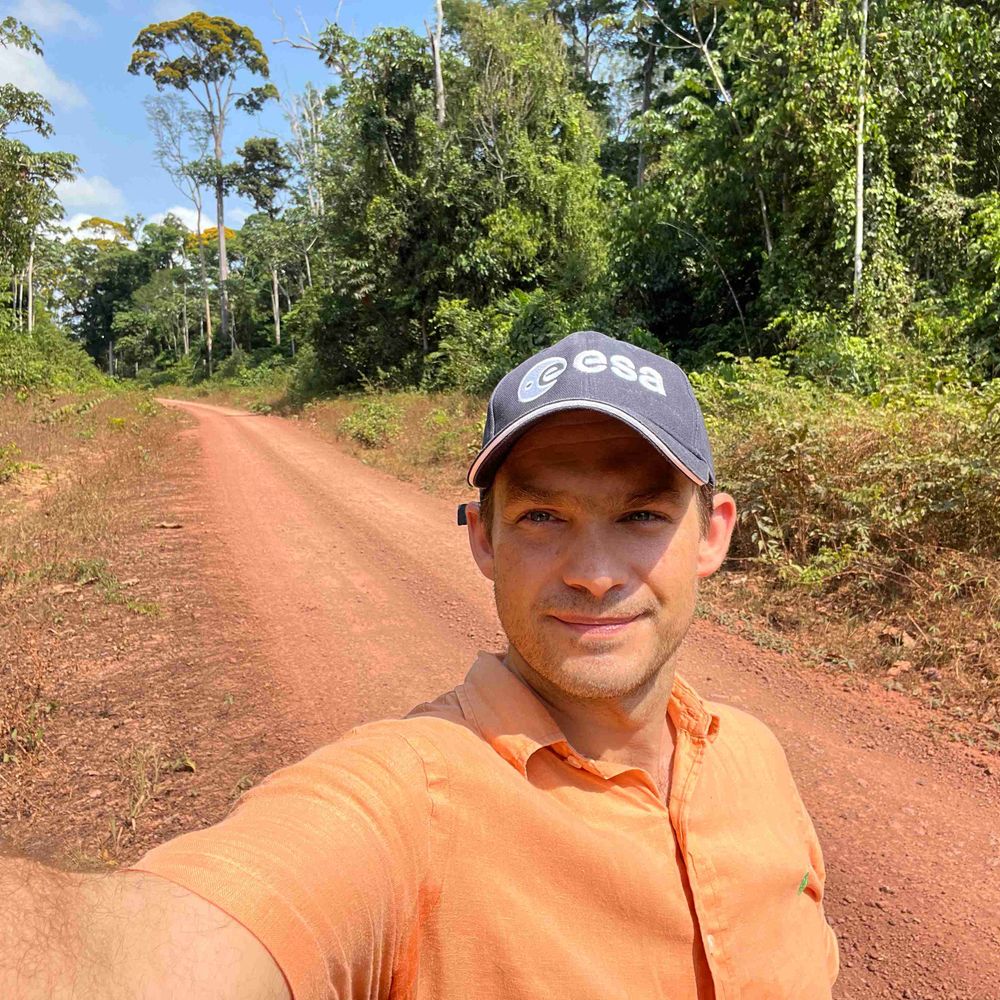
Head of the Actionable Climate Information section at the European Space Agency
Professor at ETH Zurich, IPCC WGI Vice-chair.
#Climate #Extremes #Land.
Citizen/mum/scientist. Personal account.
https://www.ipcc.ch/report/ar6/wg1/downloads/report/IPCC_AR6_WGI_Chapter11.pdf
Twitter/X: @SISeneviratne
https://www.iac.ethz.ch/people/sonia
European operational #satellite agency for monitoring weather, #climate and the environment from #space 🛰
eumetsat.int
Canada’s leading climate change policy research organization.
climateinstitute.ca
The World Climate Research Programme (WCRP) – Leading the way in tackling global climate challenges.
🔗 Learn more: https://www.wcrp-climate.org/
Follow us on all platforms: Facebook, LinkedIn, Bluesky, TikTok & X
Climate scientist, professor of Physics of the Oceans in Potsdam. Opinions my own.
🇬🇧 🇪🇺 physicist, philosopher, lead https://www.worldweatherattribution.org/, author of Climate InJustice https://greystonebooks.com/collections/current-affairs-politics/products/climate-injustice, she/her
Environmental data and Earth Observation - tailor-made software solutions, information products and expert advice
https://www.brockmann-consult.de
EUMETSAT's Ocean and Sea Ice Satellite Application Facility. 🛰
We are the dedicated @eumetsat.bsky.social centre for processing satellite data at the ocean-atmosphere interface.
Climate scientist at the National Centre for Atmospheric Science, University of Reading | IPCC AR6 Lead Author | MBE | Views own | https://edhawkins.org
Warming Stripes: http://www.ShowYourStripes.info
European Space Agency's Climate Team, often posting about ESA's Climate Change Initiative programme - climate.esa.int
Satellites, Sea, and Society! Bridging gaps between data providers and users @EUMETSAT & beyond. DEI, Mental Health, Open Science, Cooking, Wine, & LEGO. Views my own.
Climate scientist at Germany's national meteorological service (Deutscher #Wetterdienst, https://bsky.app/profile/dwdderwetterdienst.bsky.social). #Hydrometeorology, climate data & monitoring of climate change. Views are my own.
Intergovernmental Panel on Climate Change
Official UK Met Office account. Get the weather in your hand with our app: http://linktr.ee/MOContent
Senior scientist at Finnish Meteorological Institute 🛰 #EarthObservation, #Satellites, #AirQuality, #Climate 🌍 Former forecasting meteorologist🌤
Satellite images past and present (mostly related to the space industry) 🛰️ Declassified spy satellite images 🕵️ Open data 👏
spacefromspace.com
Climate scientist, director ICARUS Climate Research Centre, Maynooth University, Ireland, author IPCC AR6, member Ireland's climate change advisory council, Chair GCOS AOPC. www.peter-thorne.net
Future Earth liaison with ESA, climate science and remote sensing for a sustainable planet 🌎 #sci comm