Explore the full interactive version here: public.tableau.com/views/OHSNAP...
Hover over any county to see SNAP rates, poverty levels, and voting results.
Curious what patterns stand out in your state? Let me know what you find.
#Analytics #SNAP #EconData #GovShutdown
04.11.2025 14:50 — 👍 1 🔁 0 💬 0 📌 0
This dashboard combines SNAP participation, poverty, unemployment, income, and inequality data against election results.
It highlights where economic hardship & political alignment collide. Who might be most exposed if congressional support for SNAP lapses?
#DataVisualization
04.11.2025 14:50 — 👍 2 🔁 0 💬 1 📌 0
The data paints a complex picture:
1. In the top 20% of counties by SNAP participation, ~50% of votes went to Trump, 253k more than Harris.
2. The median SNAP rate sits at 11.6%, yet 100+ rural/suburban counties exceed 25%.
3. If reserves run dry, millions could face delayed benefits.
#PublicPolicy
04.11.2025 14:50 — 👍 0 🔁 0 💬 1 📌 0
OH SNAP! Nearly 42 million Americans rely on food assistance through SNAP. Those benefits are now at risk as the 2025 government shutdown drags on.
I built an interactive dashboard exploring how economic vulnerability and political alignment intersect across U.S. counties.
#DataViz #SNAP #Tableau
04.11.2025 14:50 — 👍 1 🔁 0 💬 1 📌 0
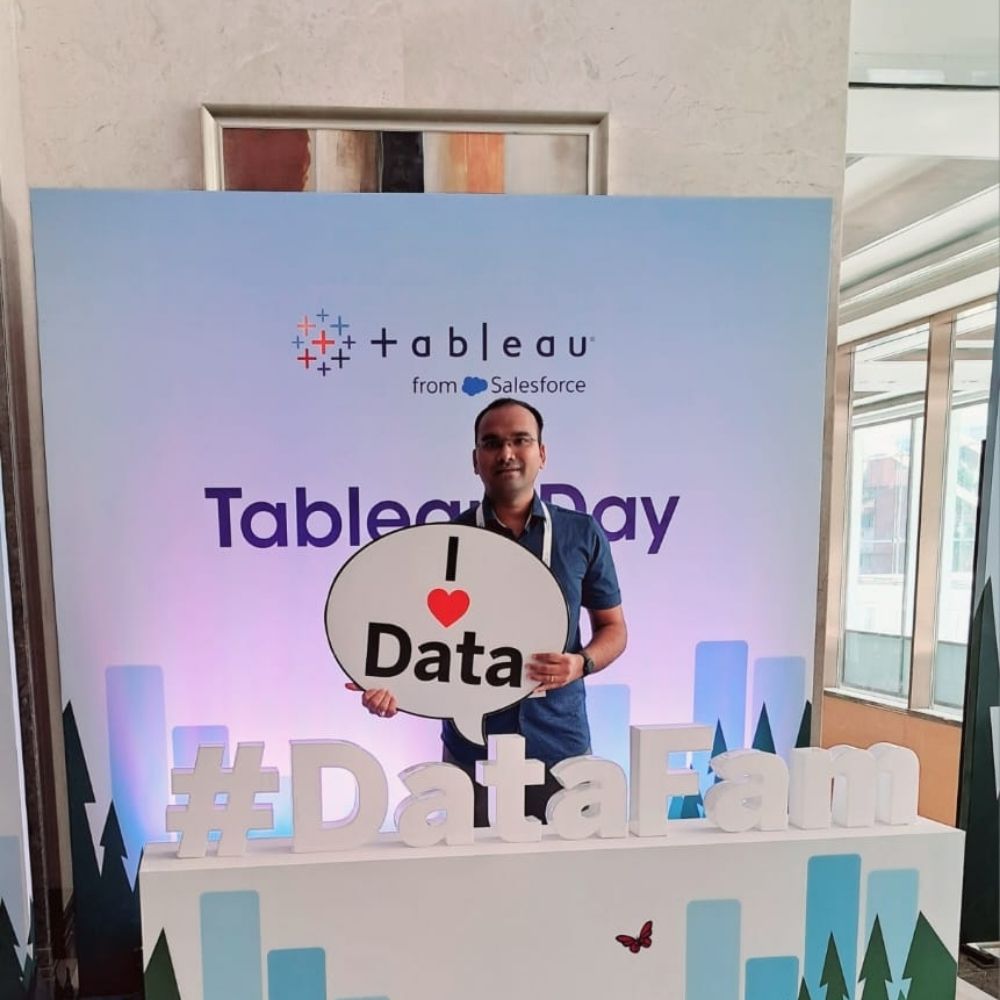
I encourage you to follow these members of the #DataFam on Tableau Public, explore their work and get connected with them through social media. Also, check out their blogs, podcasts, and more!
💻: Data gathered with the Tableau Public API
#Tableau #TableauPublic
public.tableau.com/views/Tablea...
09.08.2025 17:23 — 👍 0 🔁 0 💬 0 📌 0

For my 700th public visualization built with Tableau, learn more about the members of this cohort. Explore their bios, stats, and work.
Here are some stats:
- 93 authors
- 12,617 vizzes
- 552 #VizOfTheDay or #VOTD
- 148M+ views
- 343K+ favorites
- On average, 6+ years of experience
09.08.2025 17:23 — 👍 0 🔁 0 💬 1 📌 0

Last September, @tableaupublic.bsky.social unveiled the 2024 class of Tableau Public Ambassadors (the current cohort of Featured Authors).
These individuals create and amplify compelling data stories, foster community, and provide feedback to millions of users around the world.
09.08.2025 17:23 — 👍 0 🔁 0 💬 1 📌 0
Interact with this dashboard on @tableaupublic.bsky.social and download it to your desktop for the best performance on draft day!
Gamelog data and projections accurate as of July 5, 2025.
Original inspiration: Curtis Harris
🔗: public.tableau.com/app/profile/...
18.07.2025 19:19 — 👍 0 🔁 0 💬 0 📌 0

So what's new with this year's version? Here are five improvements:
1. Blended Scoring: Combining gamelogs + ESPN/CBS projections for smarter, customized rankings.
2. Performance Distribution Charts: Box-plots by position to help you visually spot upside, outliers, or sleepers.
18.07.2025 19:19 — 👍 0 🔁 0 💬 1 📌 0


Click on players to add them to your team or to remove them from the draft board. Analyze your team and the best available players with ease!
Play in a non-standard league which uses non-traditional scoring? Customize this calculator from the score adjustment page!
18.07.2025 19:19 — 👍 0 🔁 0 💬 1 📌 0

Excited for the upcoming NFL season? 🏈
I updated my Fantasy Football dashboard using Tableau to help you identify high-performers and dominate your league. Quickly identify consistent players to draft with ease and confidence!
Data: Pro Football Reference, ESPN, CBS Sports
#DataFam
18.07.2025 19:19 — 👍 1 🔁 0 💬 2 📌 0
Economist @ Minneapolis Fed's Opportunity & Inclusive Growth Institute. There's a graph for that. Views are my own. (she/her) https://albrightalex.com/
Creating & writing about data vis for @datawrapper.de
Information designer and entrepreneur passionate about data, innovation, and pushing the boundaries of design through experimentation.
https://linktr.ee/editgyenge
🤔 Ponders Plants, Science, Data & Art.
💚🌳🌴🌲💚
Data Visualization Designer | Tableau Public Ambassador | #COYI https://public.tableau.com/app/profile/adedamola8122/vizzes
Tableau Visionary | Tableau Forums Ambassador | WOW co-lead | Footie Mum
Data visualization (esp Tableau), Photography (esp events)
Person: *being problematic*
Jeff- here’s a graph to prove why you’re wrong
- Caroline Hancock
https://www.jeffhancockphotography.com/
https://public.tableau.com/app/profile/jeff.hancock8040/vizzes
Data Digger, Insight Bringer 📊 | Data Analyst | SQL | Tableau | Workshop Facilitator | Open to New Opportunities
Demography nerd at Pew Research Center
Global religious change, sociology
I'm a data guy. Tableau expert. Saving businesses money!
www.sapphireanalytics.co.uk
Analytics specialist in 🇨🇦. Tableau-certified data analyst 📊. Researcher. Hobby photographer.
Data tools 📈: #Tableau, #SQL, #Rstats, #Python, #Excel, #CRManalytics
https://public.tableau.com/app/profile/julia.m.28/vizzes
Edinburgh based Tableau developer | Scotland #TUG co-lead | Unoriginal BS Handle
https://public.tableau.com/app/profile/tom.fowler6133/vizzes
#DataViz Enthusiast #DataFam #Tableau | Business Analyst | MSc in Applied Math | Diving Instructor | DIY & Interior Design Geek | Yogi
https://public.tableau.com/app/profile/raisa.hannus/vizzes
Leader at #bhubaneswar TUG
Data enthusiast , who loves to play with data
Data Visualisation // Tableau, Power BI // #Datafam
Following all things data viz, Tableau, & public health