

Posted a short blog post with updated data (and public repo with data) of current state of Econ job market:
paulgp.com/2025/10/08/j...
@allbriteallday.bsky.social
Economist @ Minneapolis Fed's Opportunity & Inclusive Growth Institute. There's a graph for that. Views are my own. (she/her) https://albrightalex.com/


Posted a short blog post with updated data (and public repo with data) of current state of Econ job market:
paulgp.com/2025/10/08/j...
Society of Labor Economists (SoLE) Annual Conference will be May 1-2, 2026 in Denver, Colorado. Submission portal is now open! Deadline for submissions is October 31--don't forget to submit! It will be a great conference! (organized by me and @jrothst.bsky.social)
mailchi.mp/sole-jole/so...

Models as Prediction Machines: How to Convert Confusing Coefficients into Clear Quantities Abstract Psychological researchers usually make sense of regression models by interpreting coefficient estimates directly. This works well enough for simple linear models, but is more challenging for more complex models with, for example, categorical variables, interactions, non-linearities, and hierarchical structures. Here, we introduce an alternative approach to making sense of statistical models. The central idea is to abstract away from the mechanics of estimation, and to treat models as “counterfactual prediction machines,” which are subsequently queried to estimate quantities and conduct tests that matter substantively. This workflow is model-agnostic; it can be applied in a consistent fashion to draw causal or descriptive inference from a wide range of models. We illustrate how to implement this workflow with the marginaleffects package, which supports over 100 different classes of models in R and Python, and present two worked examples. These examples show how the workflow can be applied across designs (e.g., observational study, randomized experiment) to answer different research questions (e.g., associations, causal effects, effect heterogeneity) while facing various challenges (e.g., controlling for confounders in a flexible manner, modelling ordinal outcomes, and interpreting non-linear models).

Figure illustrating model predictions. On the X-axis the predictor, annual gross income in Euro. On the Y-axis the outcome, predicted life satisfaction. A solid line marks the curve of predictions on which individual data points are marked as model-implied outcomes at incomes of interest. Comparing two such predictions gives us a comparison. We can also fit a tangent to the line of predictions, which illustrates the slope at any given point of the curve.

A figure illustrating various ways to include age as a predictor in a model. On the x-axis age (predictor), on the y-axis the outcome (model-implied importance of friends, including confidence intervals). Illustrated are 1. age as a categorical predictor, resultings in the predictions bouncing around a lot with wide confidence intervals 2. age as a linear predictor, which forces a straight line through the data points that has a very tight confidence band and 3. age splines, which lies somewhere in between as it smoothly follows the data but has more uncertainty than the straight line.
Ever stared at a table of regression coefficients & wondered what you're doing with your life?
Very excited to share this gentle introduction to another way of making sense of statistical models (w @vincentab.bsky.social)
Preprint: doi.org/10.31234/osf...
Website: j-rohrer.github.io/marginal-psy...
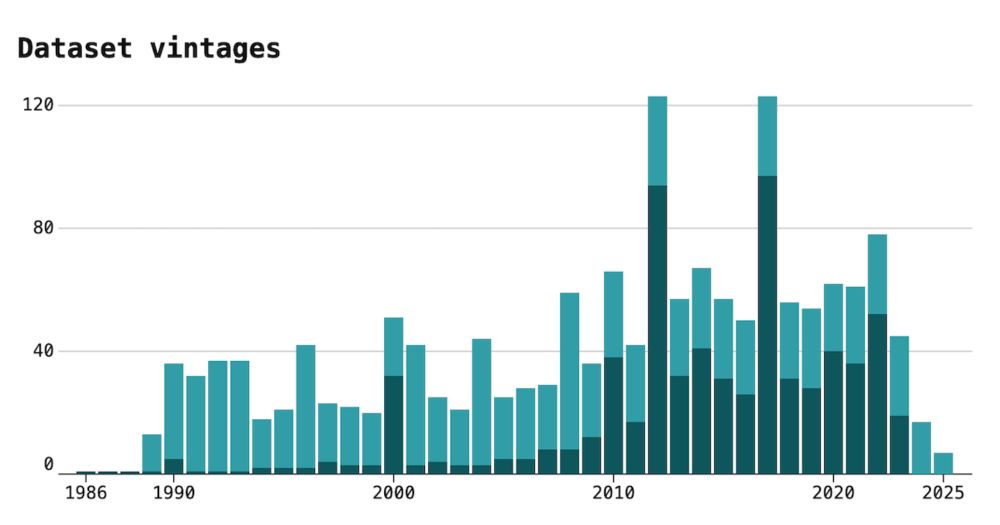
🚀 I made a tracker that shows when the Census Bureau adds or removes datasets from their APIs.
Dashboard at www.hrecht.com/census-api-d... and follow @censusapitracker.bsky.social for major updates.
I've been wanting to build this for years but now seemed an especially important time to keep track.

Academics responding to referee reports
08.07.2025 19:20 — 👍 5 🔁 0 💬 0 📌 0TLDR: AI caused a lot more job posts, but no more jobs!
While the intervention did save employers time, the welfare loss to jobseekers from time wasted on applications is 6x the size of the welfare gain to employers. Suggests widespread use of LLMs can harm market efficiency.
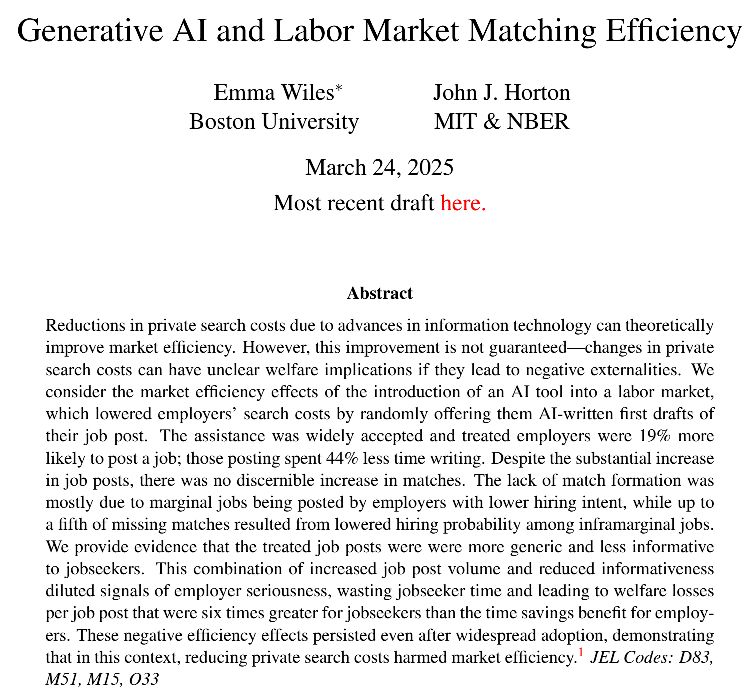
🚨 New paper alert, with @johnjhorton.bsky.social! Using an experiment run on a large online labor market, we provide evidence that providing employers access to an AI-written first draft of a job post harms the efficiency of the market.
emmawiles.github.io/storage/jobo...

Is AI liberating human programmers—or programming them right out of their jobs?
At @wired.com we kept hearing conflicting accounts, so we surveyed 730 coders and developers at every career stage about how (and how often) they use AI chatbots on the job:
www.wired.com/story/how-so...
Tagging one of the three authors here: @joakimweill.bsky.social
14.04.2025 21:21 — 👍 1 🔁 0 💬 1 📌 0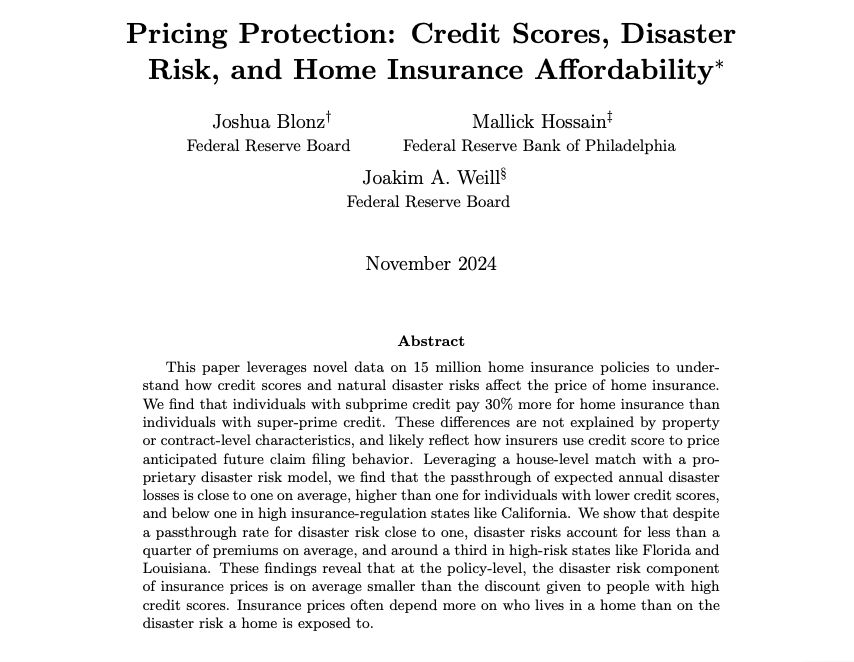
This paper leverages novel data on 15 million home insurance policies to understand how credit scores and natural disaster risks affect the price of home insurance. We find that individuals with subprime credit pay 30% more for home insurance than individuals with super-prime credit. These differences are not explained by property or contract-level characteristics, and likely reflect how insurers use credit score to price anticipated future claim filing behavior. Leveraging a house-level match with a proprietary disaster risk model, we find that the passthrough of expected annual disaster losses is close to one on average, higher than one for individuals with lower credit scores, and below one in high insurance-regulation states like California. We show that despite a passthrough rate for disaster risk close to one, disaster risks account for less than a quarter of premiums on average, and around a third in high-risk states like Florida and Louisiana. These findings reveal that at the policy-level, the disaster risk component of insurance prices is on average smaller than the discount given to people with high credit scores. Insurance prices often depend more on who lives in a home than on the disaster risk a home is exposed to
Important paper on the home insurance market. Authors use novel data on 15 million insurance policies + document many new descriptive facts.
For instance, "the average person’s homeowners insurance [costs] 17% of their monthly principal and interest payment."
papers.ssrn.com/sol3/papers....
The Deportation Data Project collects and posts public, anonymized U.S. government immigration enforcement datasets. A public good provided by academics and lawyers at Berkeley, UCLA, Stanford, Yale, and Columbia.
07.03.2025 01:57 — 👍 84 🔁 44 💬 1 📌 0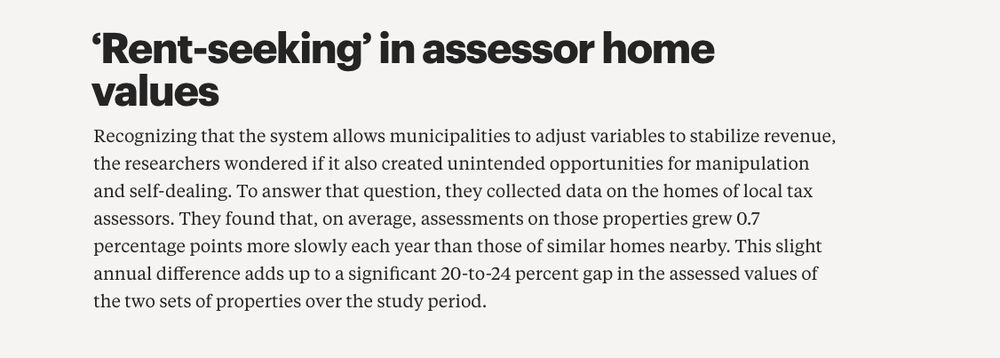
Image reads: "Recognizing that the system allows municipalities to adjust variables to stabilize revenue, the researchers wondered if it also created unintended opportunities for manipulation and self-dealing. To answer that question, they collected data on the homes of local tax assessors. They found that, on average, assessments on those properties grew 0.7 percentage points more slowly each year than those of similar homes nearby. This slight annual difference adds up to a significant 20-to-24 percent gap in the assessed values of the two sets of properties over the study period."
Also, the authors "find that local tax assessors: 1) have tax assessments on their own properties significantly lower than neighboring properties; and 2) these tax assessments grow significantly slower than neighbors – lowering their tax bills." 👀
Image via: www.library.hbs.edu/working-know...
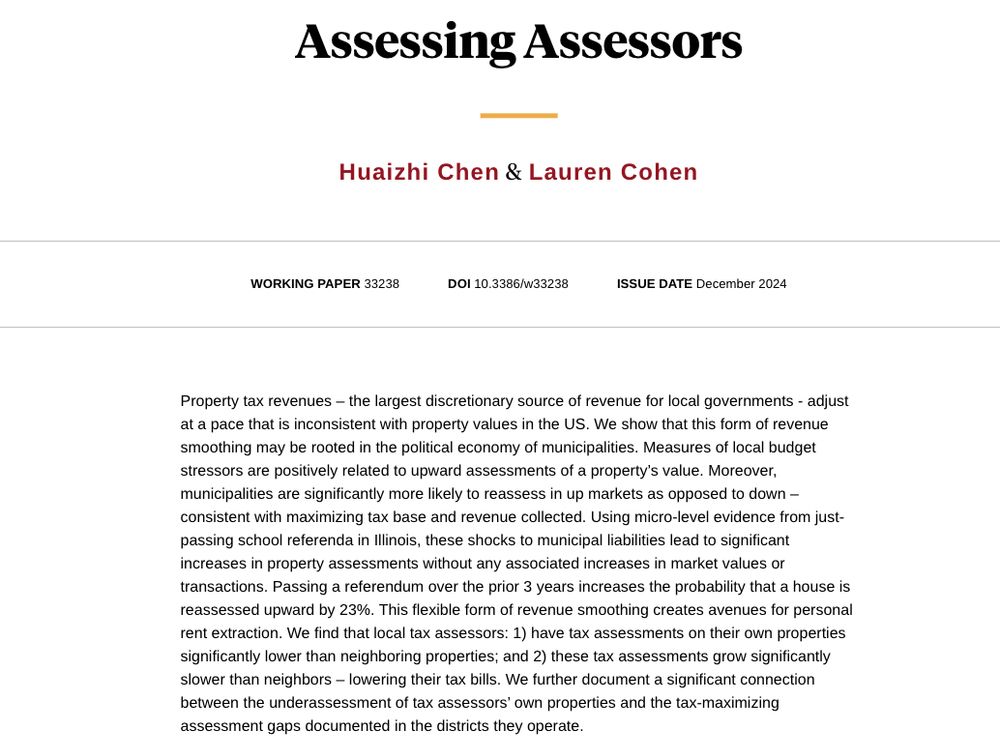
image shows abstract of the nber working paper. here's the abstract: "Property tax revenues – the largest discretionary source of revenue for local governments - adjust at a pace that is inconsistent with property values in the US. We show that this form of revenue smoothing may be rooted in the political economy of municipalities. Measures of local budget stressors are positively related to upward assessments of a property’s value. Moreover, municipalities are significantly more likely to reassess in up markets as opposed to down – consistent with maximizing tax base and revenue collected. Using micro-level evidence from justpassing school referenda in Illinois, these shocks to municipal liabilities lead to significant increases in property assessments without any associated increases in market values or transactions. Passing a referendum over the prior 3 years increases the probability that a house is reassessed upward by 23%. This flexible form of revenue smoothing creates avenues for personal rent extraction. We find that local tax assessors: 1) have tax assessments on their own properties significantly lower than neighboring properties; and 2) these tax assessments grow significantly slower than neighbors – lowering their tax bills. We further document a significant connection between the underassessment of tax assessors’ own properties and the tax-maximizing assessment gaps documented in the districts they operate."
TIL "property tax revenues adjust at a pace that is inconsistent with property values in the US."
And this revenue smoothing is not symmetric: "municipalities are significantly more likely to reassess in up markets as opposed to down."
H/t @nber.org WP by Chen & Cohen: www.nber.org/papers/w33238
🚨🚨
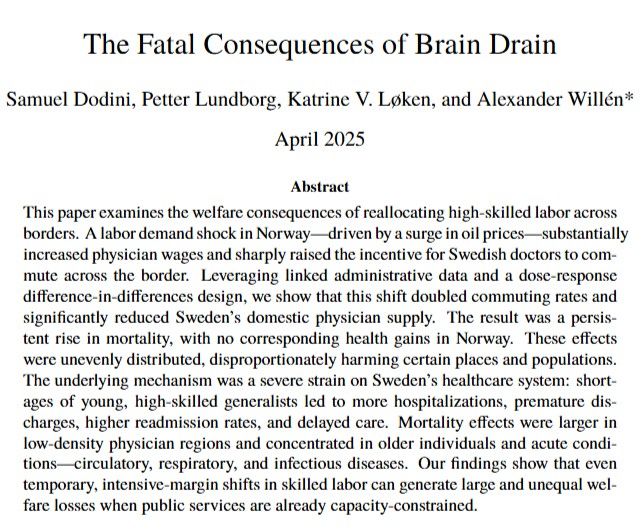
What happens when you take a bunch of human capital out of a local economy? Is brain drain a real thing? And what are the consequences? In a new paper, we shed light on this in the context of highly developed economies: Sweden and Norway. #Econsky
Migration data is critical in the health, environmental, and social sciences.
We're releasing a new dataset, MIGRATE: annual flows between 47 billion pairs of US Census areas. MIGRATE is:
- 4600x more granular than existing public data
- highly correlated with external ground-truth data
1/2
Grateful for small joys these days, like a little more sunlight every day. Fun little map I made last week 📊
18.03.2025 23:50 — 👍 37 🔁 7 💬 2 📌 0NEW PAPER: "Examining the role of training data for supervised methods of automated record linkage: Lessons for best practice in economic history" with Jonas Helgertz and Joe Price now forthcoming (and nicely proofed) at Explorations in Economic History 🧵 authors.elsevier.com/c/1kiv03I~dW...
05.03.2025 14:59 — 👍 25 🔁 6 💬 2 📌 0If you:
- received your PhD in 2017-2024 &
- have early-stage research you're looking to present
=> submit to the ✨Early Career Workshop✨!

Hey #econsky! FYI: our @oiginstitute.bsky.social annual research conference is Nov 13-14, 2025!
- Nov 13 is the main conference day ft. keynote by David Card
- Nov 14 is a workshop day for early career researchers
Learn more + submit here (deadline: 4/11): www.minneapolisfed.org/institute/co...

I just found out that @epi.org has updated and modernized its invaluable archive of State of Working America data and tabulations. Check it out! data.epi.org
HT: @benzipperer.org
Happy to share that @annabindler.bsky.social & I will organize the 16th #TWEC Transatlantic Workshop on the Economics of Crime in Berlin.
Save the date: 26-27 September 2025.
CfP follows next month #econsky
Based on feedback from past participants, potential applicants, and mentors, the CeMENT workshop will now be held June 30 - July 2, 2025, at the Federal Reserve Bank of Chicago. To apply, go to: www.aeaweb.org/about-aea/co...
Deadline to apply is March 15.

📣 Submit your crime paper by Feb 14.
🔸 4th Workshop on the Economics of Crime for Junior Scholars
🔸 29-30 May, 2025
🔸 Quattrone Center, UPenn
🔸 Keynote: @amandayagan.bsky.social
🔹 Send your paper to:
WEC.Jr.Econ@gmail.com
@emmarackstraw.bsky.social
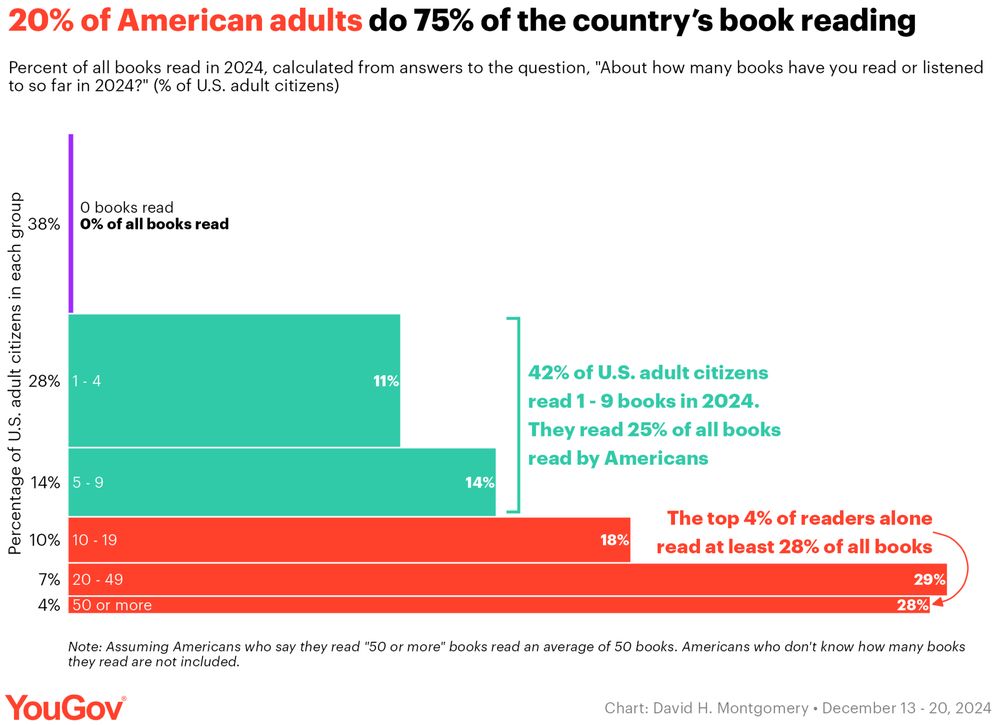
A bar/area chart with the title, "20% of American adults do 75% of the country's book reading."
2/ If you combine most Americans not reading much and a few reading a lot, you've got some Power Law nonsense developing! The 4% of adults who read 50 or more books did at least 28% of ~all the country's reading~ — more than the bottom 80% combined.
The top 20% read 75% of all books.
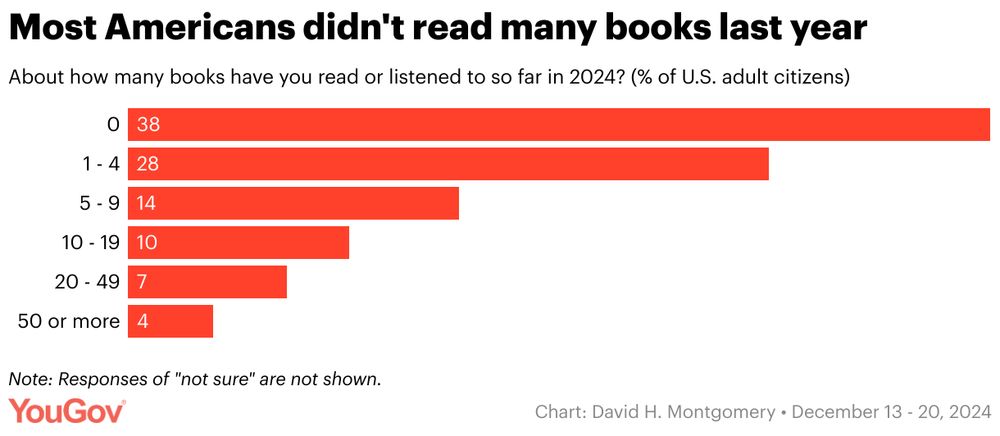
Bar chart with the title "Most Americans didn't read many books last year"
At the end of the year, I ran a poll for @today.yougov.com asking people how many books they read in 2024. The answer is not many! The median American read ~2 books~ last year; 38% of Americans didn't read ANY.
But... 1/
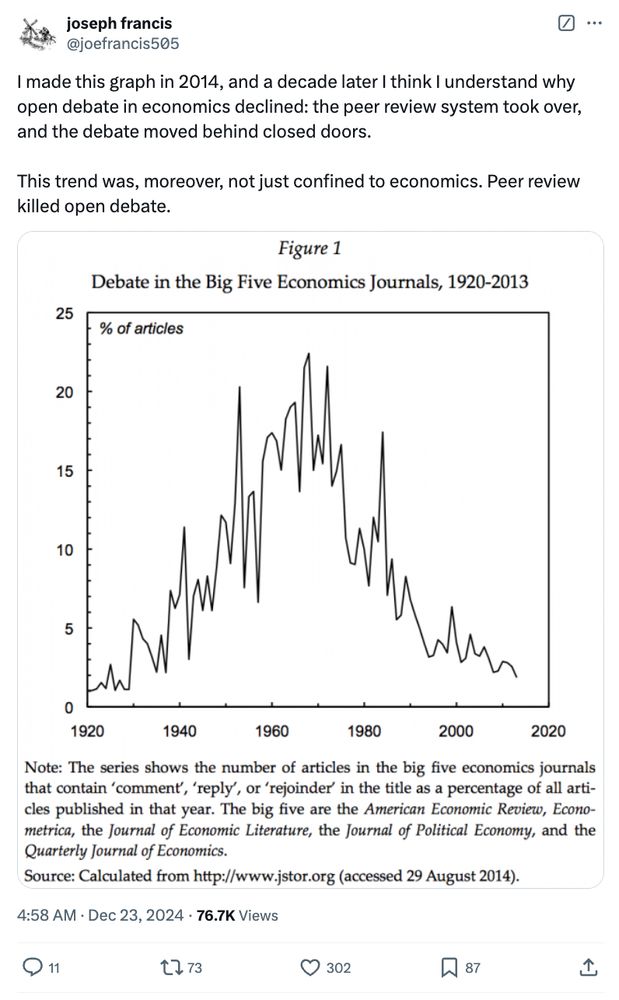
In economics, editors, referees, and authors often behave as if a published paper should reflect some kind of authoritative consensus.
As a result, valuable debate happens in secret, and the resulting paper is an opaque compromise with anonymous co-authors called referees.
1/
Students at Brown have used the Google Maps API to create a live tracker for traffic flows under congestion pricing in NYC. It includes a real-time diff-in-diff type comparison between NYC, Boston, and Chicago:
www.congestion-pricing-tracker.com
As I am now handling papers at AEJ:Policy again, I want to encourage authors of papers that identify partial equilibrium effects to consider (in a rigorous manner) how they relate to policy effects or general equilibrium effects.
11.01.2025 16:10 — 👍 90 🔁 34 💬 3 📌 5Nice! Will def check out your post if I ever switch to #quarto 😅
15.01.2025 17:02 — 👍 1 🔁 0 💬 0 📌 0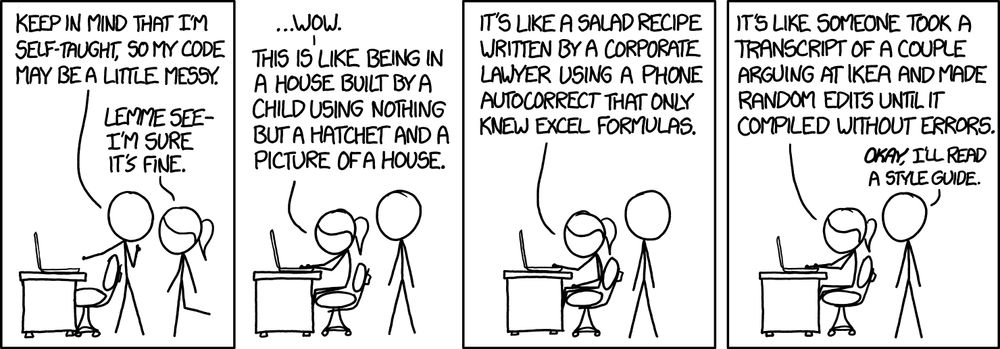
Me (today) revisiting some old code written by me (years ago)
@xkcd.com