Elon Musk is boosting the British right - and this shows how
Elon Musk is boosting the British right - and this shows how
A magnificent piece of work. Comprehesive, revelatory & shocking. Journalism this good is always rare & precious but never moreso than at times like this. Latter day Lord Haw Haws being plumped, preened & delivered to your doorstep in plain sight by a Nazi-saluting goon
news.sky.com/story/the-x-...
06.11.2025 09:16 — 👍 2082 🔁 965 💬 105 📌 60

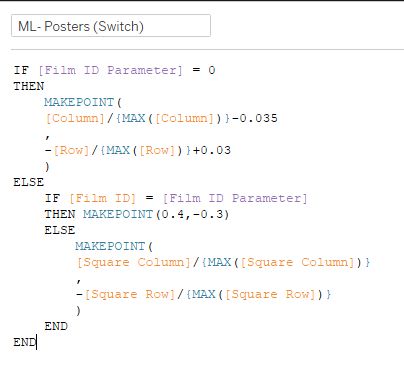
Made some more accidental #Tableau art, as part of speculatively making something for #IronViz
Haven't quite figured out why I've made it, but i like.
#DataFam 📊
03.11.2025 14:49 — 👍 1 🔁 0 💬 0 📌 0
British.
16.10.2025 17:03 — 👍 8329 🔁 2840 💬 345 📌 643

New coffee mug day from @cyclinglegends.bsky.social
15.08.2025 07:21 — 👍 2 🔁 1 💬 0 📌 0

England v India Fifth Test, Day One Report Card
Featuring preposterous nonsense, not playing any bowlers, wayward Tongues and DIY Morpheus off the long run
England v India Fifth Test, Day One Report Card, featuring preposterous nonsense, not playing any bowlers, wayward Tongues and DIY Morpheus off the long run #ENGvIND 🏏
newsletter.danliebke.com/p/england-v-...
31.07.2025 22:26 — 👍 3 🔁 4 💬 1 📌 1
and now Kallis...
25.07.2025 10:59 — 👍 1 🔁 0 💬 0 📌 0
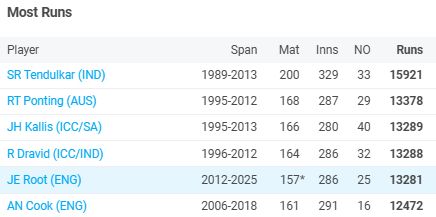
nicely packed 2-5, with Joe Root now above Dravid in all time test runs. charging on...
25.07.2025 10:58 — 👍 0 🔁 0 💬 1 📌 0
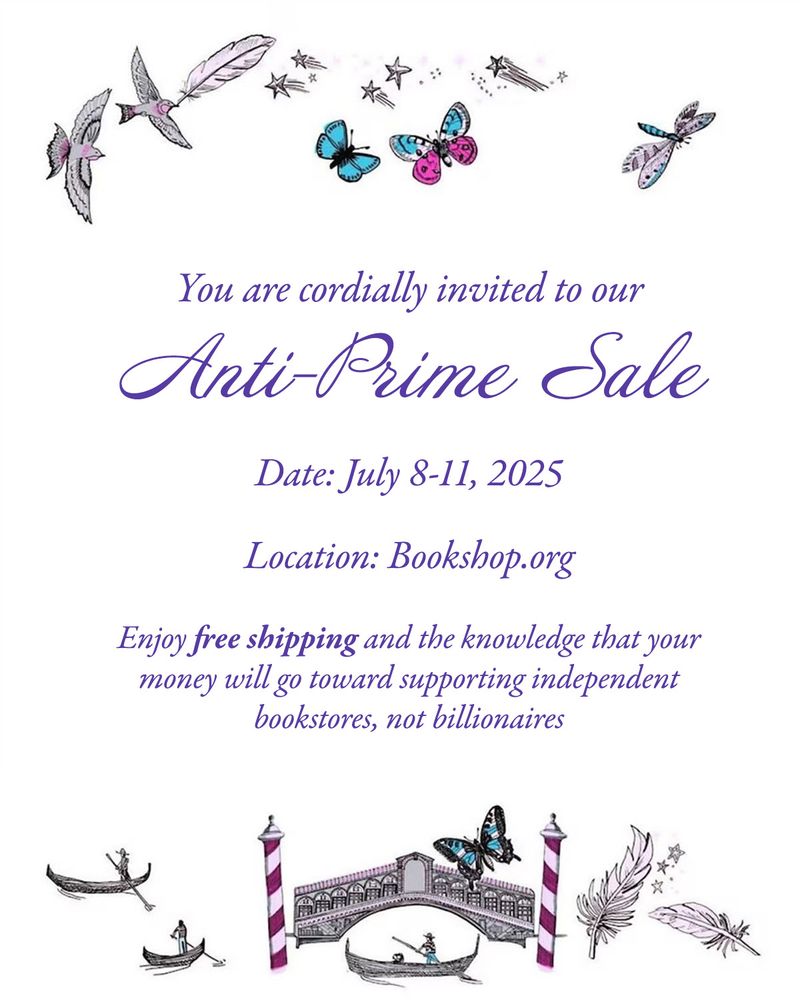
You are cordially invited to our Anti-Prime Sale, where every purchase will financially support bookstores, NOT billionaires 🥳
08.07.2025 14:05 — 👍 4599 🔁 2740 💬 40 📌 231
New galaxy map for #starwars
#dataviz for #astrosky and nerds like me #scifi
www.starwars.com/star-wars-ga...
24.06.2025 15:14 — 👍 1 🔁 1 💬 0 📌 0
fascinating and, to excuse the chose of word, sobering analysis and explainer.
23.06.2025 14:47 — 👍 1 🔁 0 💬 0 📌 0
Nice write up. This came up in a recent Scotland User Group.
"Make it fun".
I think this is really important factor on honing skills but also pushing boundaries. Similarly, on personal projects, if it stops being fun, then its either time to push to publish, or archive, right!
19.06.2025 13:05 — 👍 1 🔁 0 💬 0 📌 0
Going green gonna make map go green.
Amazing initiative and hard to argue with
19.06.2025 10:17 — 👍 0 🔁 0 💬 0 📌 0
Great project.
Some terrifying results and the climate reparations interactive visuals are powerful.
17.06.2025 09:49 — 👍 2 🔁 0 💬 0 📌 0
This was really interesting.
Sane, and measured, without the hyperbole that ~85%* of AI content seems to be.
From myself in a BI Role, embracing new tools whilst honing craft in existing tooling is a forever balancing act (sometimes limited by tech stack)
*made up stat
11.06.2025 08:24 — 👍 2 🔁 1 💬 1 📌 0
 09.06.2025 14:49 — 👍 0 🔁 0 💬 0 📌 0

Screenshot of a daily Mail Headline
What do we think?🤔
Hmm…. A Daily Mail headline so clearly designed to make you furious.
Being shared by salivating Tory MPs who love a good rage farming story!
So, what’s going on here?
Let’s take a look!👀
🧵
1/13
08.06.2025 12:30 — 👍 1156 🔁 590 💬 69 📌 91
Just how big were the dinosaurs, is a question my kids keep asking me.
This Dataviz 📊 looks at comparing Dinosaur sizes, using @johandegroot.bsky.social funnel area charts for inspiration.
public.tableau.com/app/profile/...
#Tableau #Datafam #dataviz
08.06.2025 20:52 — 👍 2 🔁 0 💬 1 📌 0
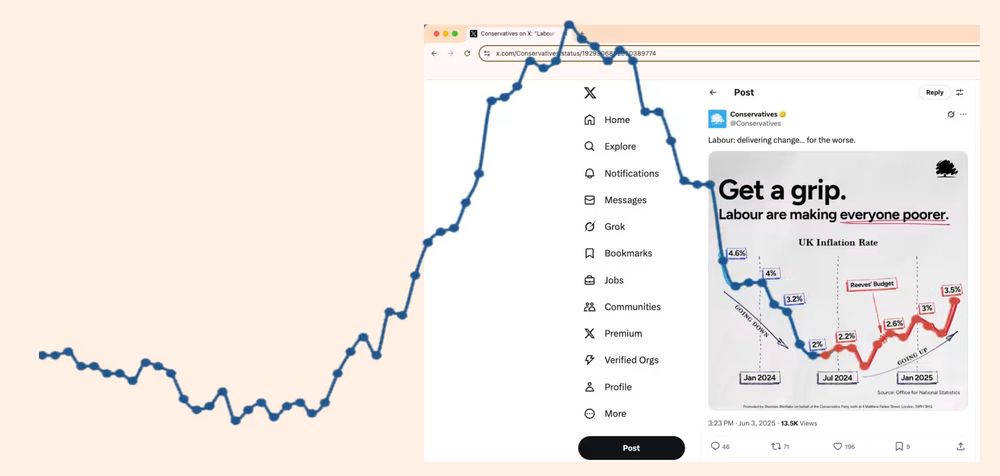
Politicians shouldn't rage-bait chart geeks. on.ft.com/4jrlz8h
04.06.2025 08:23 — 👍 323 🔁 100 💬 6 📌 7
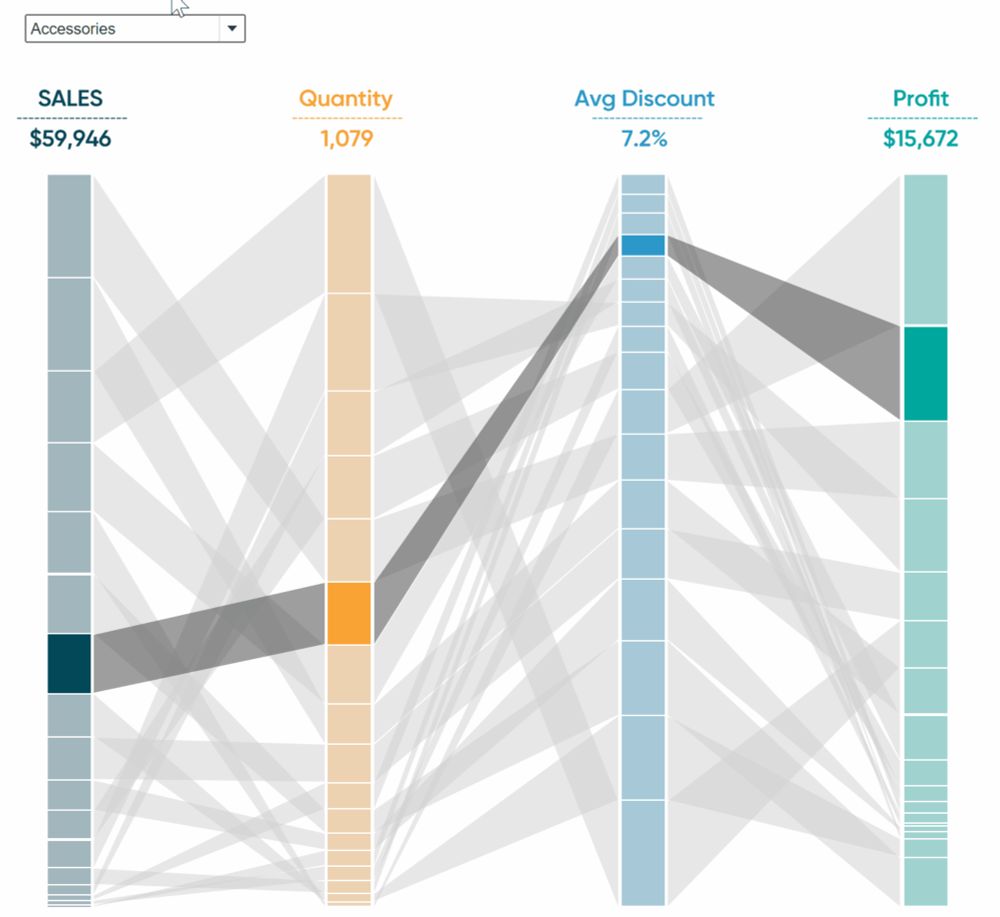
Introducing Sankey Bump Charts in Tableau
The Sankey Bump Chart in Tableau compares how a single dimension member ranks over several different measures.
hat tips to
PlayFair for Sankey Bump guide playfairdata.com/introducing-...
@tableaumatthijs.bsky.social for kick off on it
@johandegroot.bsky.social for the guidance and feedback
@trebor-rolyat.bsky.social for *really* bringing Map Layers into my horizon
05.06.2025 10:29 — 👍 2 🔁 0 💬 0 📌 0
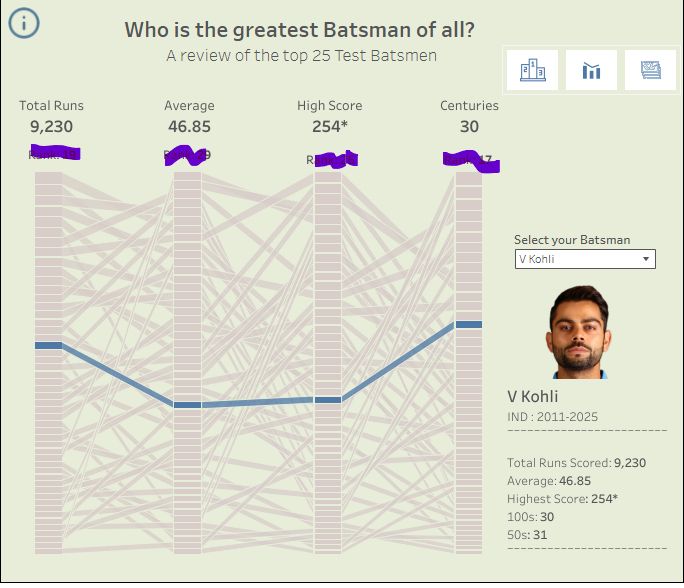
spoilers removed for actuals on Virat....
05.06.2025 09:08 — 👍 1 🔁 0 💬 1 📌 0
Haven't published a #Tableau #Dataviz in a little while.
When Virat Kohli announced his retirement, prompted me to investigate the top 25 Test Cricket Batsmen off all time.
Some Sankey Bump Charts and Map Layers. 📊
Let me know what you think #datafam !
public.tableau.com/app/profile/...
05.06.2025 09:07 — 👍 1 🔁 0 💬 1 📌 0
smoooooth!
nice work @johandegroot.bsky.social
03.06.2025 13:25 — 👍 0 🔁 0 💬 0 📌 0
Might finally be #maplayers convert in #tableau
so. much. control.
26.05.2025 15:30 — 👍 1 🔁 0 💬 0 📌 0
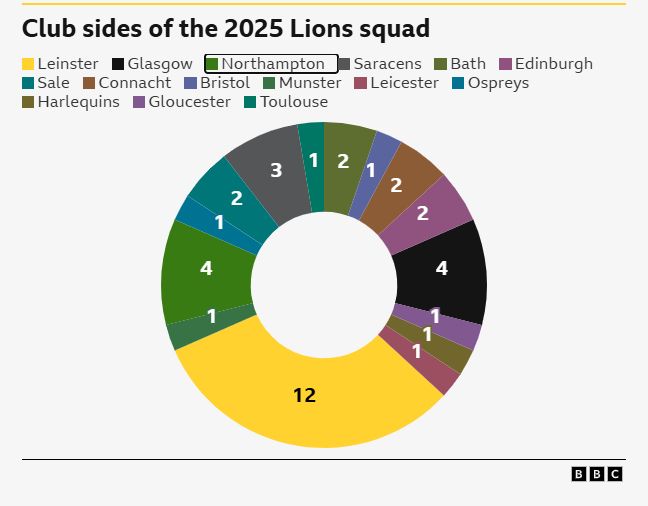
Chart Crimes from BBC this morning
www.bbc.co.uk/sport/rugby-...
09.05.2025 08:06 — 👍 1 🔁 0 💬 0 📌 0
I've referenced this back since seeing you do this at DataFam so many times
07.05.2025 13:46 — 👍 1 🔁 0 💬 0 📌 0
This is so good @datavizlouis.bsky.social
@dopemeat.bsky.social ... take a look at this
29.04.2025 06:59 — 👍 1 🔁 0 💬 1 📌 0
@darraghmurray.bsky.social its been pretty spectacular seeing how this particular viz-evolution has capture imagination of analysts, regardless of their tool of choice. Nice collaboration
11.04.2025 06:44 — 👍 2 🔁 0 💬 1 📌 0
"messing around" 😆
you're producing consistently great stuff
10.04.2025 15:31 — 👍 0 🔁 0 💬 1 📌 0
@trebor-rolyat.bsky.social your animation in the Val Kilmer Tableau dashboard is superb, really pleasing on the eye.
Had a look how you achieved it, and it is elegant. smart stuff
10.04.2025 15:11 — 👍 1 🔁 0 💬 1 📌 0
lots of really sane hints and tips here from @johandegroot.bsky.social
Hide “0” values - thats a nice one to add into the toolbelt!
04.04.2025 11:14 — 👍 1 🔁 0 💬 0 📌 0
The UK's only reader-funded, independent newspaper that truly sits outside of the established system.
Subscribe for exclusive content in the Byline Times monthly print edition: subscribe.bylinetimes.com
Visit our free daily news site: bylinetimes.com
NEW Fearless, independent journalism covering culture, politics and tech
Join us! Sign up for our free twice-weekly newsletter. ⚡️⬇️
We rely on supporters to fund our work. Please also consider upgrading to membership of the Nerve… 🙏
thenerve.news
🏏 Mostly cricket. Fast cyclist, medium-pace bowler, slow runner.
Podcast host:
https://cantbowlcantthrow.com/ @hitchpodonline.com
Commentates: @guerillacricket.bsky.social & CA
Molecular Biologist. Debunker of myths. Proud European. 🇩🇰🇪🇺🇬🇧
www.emmamonk.co.uk
https://monkdebunks.substack.com
www.linkedin.com/in/emma-monk-780686190
https://medium.com/@info_28174
Green Party Leader (England & Wales)
London Assembly Member.
Chair of London's Fire Committee.
🏳️🌈
https://podcasts.apple.com/podcast/id1837201724?i=1000724643828
Founder and CEO, Bookshop.org; co-Creator and Publisher, Literary Hub; co-founder and Chairman, Electric Literature
Investigative journalist. Ex-Guardian/Observer. Now co-founder brand new all-women journalist collective, www.thenerve.news. Tech justice stuff: www.the-citizens.com. Personal newsletter: www.broligarchy.substack.com
Healthcare data analyst.
Aspiring Munroist.
— Founder of Our World in Data
— Professor at the University of Oxford
Data to understand global problems and research to make progress against them.
📊 Data visualisation specialist.
💻 #RStats | #Python | #D3.
🎨 Generative artist.
🏃♀️ Runner.
Website: https://nrennie.rbind.io/
She/her. Views my own.
Harnessing the power of technology and data to produce quality local data journalism at scale.
Find out more: pa.media/radar/
Fact Checker @pamedia.bsky.social
📨 sonja.tutty@pamediagroup.com
Data Visualization Enthusiast and Learner | Tableau Developer |
5 x #VOTD
Profile - https://public.tableau.com/app/profile/aakarsh
design enthusiast | tableau visionary | iron viz finalist '23 | ✈️🐠🥁📊
Internet Shenanigans: https://linktr.ee/brrosenau
Where stuck vizzes find new life. Three Tableau Ambassadors troubleshoot unfinished projects with fun, flair, and data geekery.
Find us on YouTube at https://www.youtube.com/@UnfinishedVizness
funny cricket > good cricket
(non-cricket stuff at @danliebke.com)
Spy. Dammit! Ex-spy.
Is it about work? Please contact: Rob Aslett roba@avalonuk.com
Avi pic by Clara Wolden. Background pic designed by Gentleman Jim Gloster.
Esoteric aficionado of random knowledge and human shortcut for Google. Love all things data, Old Time Radio, Wikipedia, Tableau. Forever appreciative of the #datafam.
Might contain an Infinite Improbability Drive.
Words and smiles.Partridge, Thick of It, Veep,Death of Stalin, Dr Strangelove on stage, Podcast #StrongMessageHere. https://www.bbc.co.uk/sounds/brand/m0024cp6?partner=uk.co.bbc&origin=share-mobile Patron of Child Poverty Action Group, @cpaguk.bsky.social.
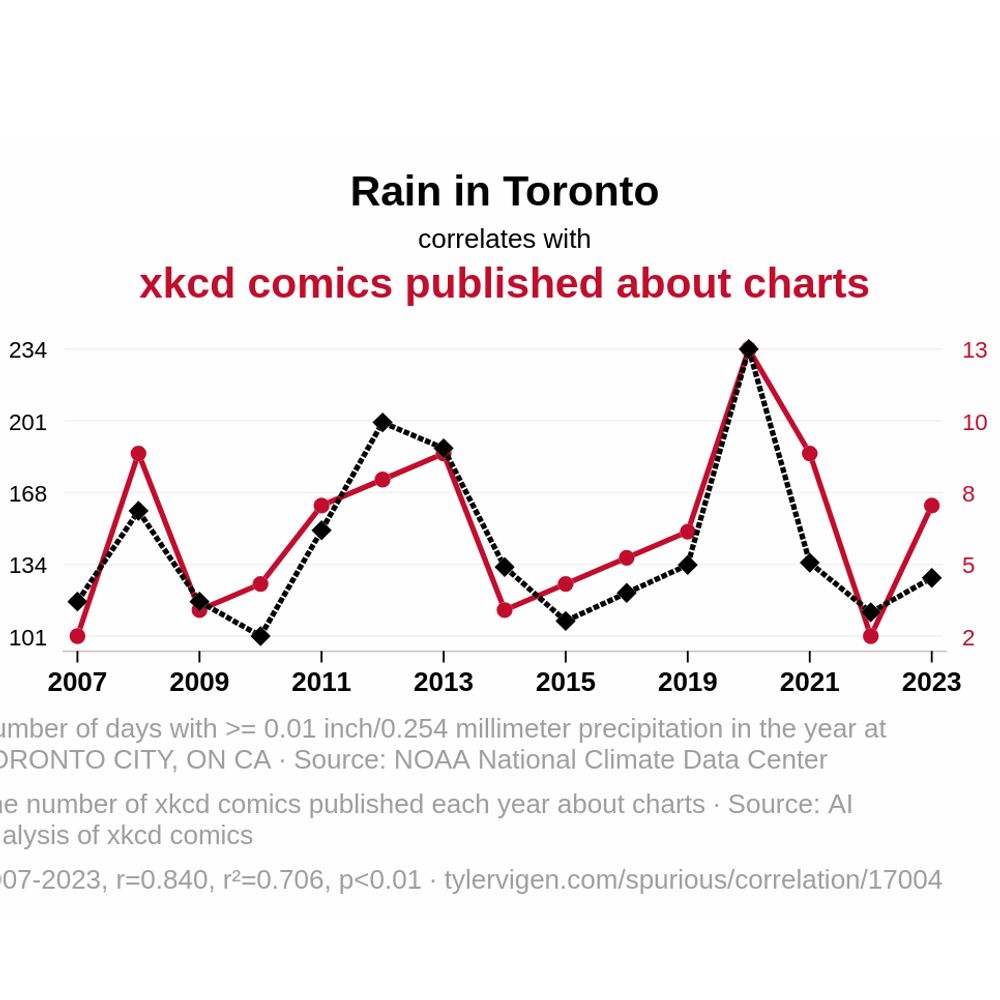
Correlation is not causation: your daily dose of spurious correlation.
Made with @trotsky.pirhoo.com using Tyler Vigen's charts.