On this page
What’s the difference between statistical significance and substantial significance?
Can we measure substantial significance with statistics?
What are all the different ways we can look at model coefficients?
Print the object name
Use summary()
Use tidy() from the {broom} package
Use model_parameters() and model_details() from the {parameters} and {performance} packages
Make nice polished side-by-side regression tables with {modelsummary}
Make automatic coefficient plots with modelplot() from {modelsummary}
Plot model predictions and marginal effects
Automatic interpretation with {report}
Posted a helpful little set of FAQs about regression for my causal inference class, including illustrations of statistical vs. substantive signficance and all the different things you can do with #rstats model objects
evalsp26.classes.andrewheiss.com/news/2026-02...
03.02.2026 19:49 — 👍 69 🔁 11 💬 3 📌 1
Happy to share our recent article on causal inference in science studies. It aims to introduce causal thinking to the science of science community with an example from Open Science.
27.01.2026 10:36 — 👍 8 🔁 2 💬 1 📌 0
📜 Paper: https://arxiv.org/pdf/2601.00037
Interested in what's new in causality and causal machine learning?
Check our Causal Python Weekly Newsletter (FREE): https://causalpython.io
5/5
14.01.2026 09:29 — 👍 2 🔁 1 💬 0 📌 0
His conclusion is that "causality in physics is (...) indispensable in practice but (...) elusive in principle"
He calls causality "a concept we think we cannot do without, but one that our best equations are surprisingly reluctant to describe."
Would you agree?
4/
14.01.2026 09:29 — 👍 1 🔁 1 💬 0 📌 0
Perhaps this difficulty indirectly inspired Bertrand Russell's 1913 statement that "causality is a relic of the past".
But is it?
In his freshly updated paper, Alessandro De Angelis offers us a brief tour of the history of causality in physics, from Galileo to quantum mechanics, and more.
3/
14.01.2026 09:29 — 👍 1 🔁 1 💬 0 📌 0
"(...) it is evident that (the) degree of speed will not go on increasing when its cause of increase is taken away"
The idea that causality is somehow "obvious" or "evident" is not new and perhaps, among other things, it reflects a conceptual difficulty in dealing with the topic.
2/
14.01.2026 09:29 — 👍 1 🔁 1 💬 0 📌 0

Is Causality a "Working Hypothesis"?
The notion of causality has a turbulent history in physics.
In a posthumously published part of his Two New Sciences, one of Galileo’s fictional protagonists, Salviati, says:
1/
#CausalSky #ScienceSky #EconSky #MLSky
14.01.2026 09:29 — 👍 1 🔁 2 💬 4 📌 0
When A/B Tests Aren’t Possible, Causal Inference Can Still Measure Marketing Impact
In many real‑world settings, running a randomized experiment is simply impossible. We’ll walk through Diff‑in‑Diff, Synthetic Control, and Meta’s GeoLift. We show how to prep your data, and provide ready‑to‑run code.
When A/B Tests Aren’t Possible, Causal Inference Can Still Measure Marketing Impact
In many real‑world settings, running a randomized experiment is simply impossible. We’ll walk through Diff‑in‑Diff, Synthetic Control, and Meta’s GeoLift. We show how to prep your data, and …
#hackernews #meta #news
14.01.2026 11:25 — 👍 1 🔁 1 💬 0 📌 0

arXiv:2403.06783v1 Announce Type: new
Abstract: The Mann-Whitney-Wilcoxon rank sum test (MWWRST) is a widely used method for comparing two treatment groups in randomized control trials, particularly when dealing with highly skewed data. However, when applied to observational study data, the MWWRST often yields invalid results for causal inference. To address this limitation, Wu et al. (2014) introduced an approach that incorporates inverse probability weighting (IPW) into this rank-based statistics to mitigate confounding effects. Subsequently, Mao (2018), Zhang et al. (2019), and Ai et al. (2020) extended this IPW estimator to develop doubly robust estimators.
Nevertheless, each of these approaches has notable limitations. Mao's method imposes stringent assumptions that may not align with real-world study data. Zhang et al.'s (2019) estimators rely on bootstrap inference, which suffers from computational inefficiency and lacks known asymptotic properties. Meanwhile, Ai et al. (2020) primarily focus on testing the null hypothesis of equal distributions between two groups, which is a more stringent assumption that may not be well-suited to the primary practical application of MWWRST.
In this paper, we aim to address these limitations by leveraging functional response models (FRM) to develop doubly robust estimators. We demonstrate the performance of our proposed approach using both simulated and real study data.
arXiv📈🤖
A doubly robust estimator for the Mann Whitney Wilcoxon Rank Sum Test when applied for causal inference in observational studies
By
10.01.2026 01:34 — 👍 1 🔁 1 💬 0 📌 0
This is an impressive project. My reaction to what it shows though is that survey experiments have gotten out of hand in polisci. I will blog more on this, but I do not think survey experiments are emblematic of the credibility revolution. Some are already interpreting as such, which is a problem.
03.12.2025 04:34 — 👍 75 🔁 11 💬 8 📌 5
A blog post giving a more thorough take on survey experiments and the credibility revolution: cyrussamii.com?p=4168
03.12.2025 17:23 — 👍 79 🔁 36 💬 6 📌 6
[2025-12-01] 📚 Updates in #CML
(1) Counterfactual Explanation for Multivariate Time Series Forecasting with Exogenous Variables
(2) A Sensitivity Approach to Causal Inference Under Limited Overlap
🔍 More at researchtrend.ai/communities/CML
01.12.2025 03:41 — 👍 1 🔁 1 💬 0 📌 0
On the reading list it goes!
30.11.2025 15:38 — 👍 8 🔁 3 💬 0 📌 0

Causal inference and the metaphysics of causation - Synthese
The techniques of causal inference are widely used throughout the non-experimental sciences to derive causal conclusions from probabilistic premises. This poses a philosophical question. What in the n...
New paper out in Synthese—a metaphysical theory of causation designed to explain statistical causal inference. Basically a summary of a 100,000-word book (Causation: Science, Statistics and Metaphysics) that'll go into production with CUP soon. Watch this space link.springer.com/article/10.1...
30.11.2025 14:03 — 👍 61 🔁 11 💬 1 📌 2

Data Walks Reveal Residents' Mixed Feelings on Privacy
How do Long Beach residents feel about data collection in their city? Gwen Shaffer's data walks reveal surprising insights.
Until tech gives more agency to citizens, smart cities are a dumb idea for democracy. "While cities may disclose how they collect data, they rarely offer ways to opt out." "Residents want agency" #privacy #AIEthics
spectrum.ieee.org/smart-city-p...
30.11.2025 16:21 — 👍 470 🔁 118 💬 17 📌 10


The default prior for the intercept in both {rstanarm} and {brms} are very wide.
Counterintuitively - being on the logit scale, this is actually translates to a **strong** prior that p(y=1) is near 1 or near 0.
Always check your priors!
#rstats
18.11.2025 14:01 — 👍 107 🔁 21 💬 11 📌 6
A quick (1000 words) read to enjoy with your morning coffee or afternoon tea:
"Psychology wants to stay WEIRD, not go WILD"
Why hasn't psychology diversified it samples, methods, theories, etc.? Because it doesn't want to. osf.io/preprints/ps...
13.11.2025 14:59 — 👍 72 🔁 33 💬 3 📌 2
 07.01.2025 19:09 — 👍 193 🔁 23 💬 2 📌 3
Case Study: Causal inference for observational data using modelbased
#statstab #458 Causal inference for observational data using {modelbased}
Thoughts: IPW, g-computation, and more. Learning OS and ways to compute ATE for (more accurate, but still not great) inference.
#gcomputation #ipw #iptw #observational #inference
easystats.github.io/modelbased/a...
12.11.2025 20:23 — 👍 2 🔁 1 💬 0 📌 0

Can Game Theory Help Us with Causal Discovery?
What's Your Guess?
In this week's issue of Causal Python Weekly, expect a solid mix of history, fresh discoveries, and good teaching:
1/
#CausalSky #EconSky #StatSky #MLSky #EpiSky
02.11.2025 10:19 — 👍 7 🔁 4 💬 1 📌 1

Grid display of 6 coefficient plots showing the effects of different emotion manipulation instrument types when used to manipulate six different emotions.
We were wrong about the strength of more personalized instruments! Vignette instruments had the largest treatment effects on emotions that we studied, except for anger. Images (we looked photographs from affective image inventories) tended to work well, too.
(9/17)
13.08.2025 18:15 — 👍 3 🔁 1 💬 1 📌 0
This paper:
1. Shows that the big challenges in emotions experiments are instrumental variable challenges: weak instruments, violations of the exclusion restriction, compliance.
2. Identifies emotion manipulations that work even in online surveys.
(4/17)
13.08.2025 18:15 — 👍 4 🔁 1 💬 1 📌 0

Abstract of a paper written by Amanda Weiss and Ekin Dursun and titled "Robust Emotion Manipulation for Surveys: Evidence from Three Experiments."
The abstract reads: "A large number of experiments investigate the effects of emotions on critical political outcomes, including policy attitudes, support for authoritarians, tolerance, and political participation. The success of these experiments depends on emotion manipulations: Manipulations must be strong enough to shift one target emotion while also being specific enough shift other confounders only minimally. In this project, we identify emotion manipulations that fulfill these imperatives. First, using causal graphs, we show that in such experiments, emotions are intermediate outcomes of randomly assigned emotion manipulation instruments—not randomized treatments themselves. Then, we present evidence from three experiments (total N = 6, 649) on the effectiveness of vignettes, autobiographical emotional memory tasks, images, and more for inducing anger, gratitude, fear, political anger, political gratitude, and political cynicism. We show that vignettes are reliable instruments in terms of both strength and specificity. We also investigate compliance with emotion manipulation instruments and find that pre-treatment attitudes toward research may moderate treatment effects.
🚨 Updated working paper!
Ekin Dursun and I ask what instruments best manipulate emotions on surveys (osf.io/56h4g).
We find that vignettes really work! They have large effects on emotions of interest & smaller effects on emotions *not* of interest.
But as always, it's complicated.👇
(1/17)
13.08.2025 18:15 — 👍 47 🔁 15 💬 2 📌 1
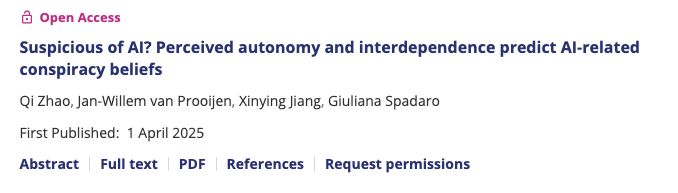
New paper online!🎉
We introduce a new concept: AI-related conspiracy theory, which claims that powerful humans use AI for malicious purposes or AI itself eventually controls humans.
Yes, this is inspired by the movie “the Matrix”.👻
bpspsychub.onlinelibrary.wiley.com/doi/full/10....
01.04.2025 17:30 — 👍 3 🔁 1 💬 0 📌 0
Building things. Chasing vert.
Artist, naturalist and social scientist
East Anglia
Sentientism, food policy for desired/anticipated consumption patterns, plant-based food for climate, consumption behaviour, history and reporting of global goals, framing.
It's shaharyarranjah1 content creator and software engineer and artificial intelligence engineer Learn full stack web development machine learning deep learning computer vision llm data science data analyst etc connect with us
News and research from Sage Journals at Sage. #SageJournals
journals.sagepub.com
NYU Politics prof. Methods to inform policy. Governance, conflict, institutions. cyrussamii.com
Economics Professor at Chapman University. President of ASREC. Author of Rulers, Religion and Riches http://amzn.to/3luy5qe and How the World Became Rich http://amzn.to/2ZZJetD
https://www.jaredcrubin.com/
https://www.howtheworldbecamerich.com/
Digitalization & Pol Behavior LMU_Muenchen | Democracy and Populist Attitudes | Open Science | 🚵♂️🐶
Tea drinking assistant professor of cognitive psychology at Stanford.
https://cicl.stanford.edu
Assistant Professor of Economics at UCL and Director of UCL CNET
Political Economy | Inequality | Capitalism | Fractals | Sampling
Website: mranaldi.com
Music: mranaldi.com/music
Lecturer at University of Exeter (https://psychology.exeter.ac.uk/people/profile/index.php?username=mu246) • Social and Political Psychology • Co-Editor-in-Chief of Global Environmental Psychology (https://gep.psychopen.eu/index.php/gep)
Social psychologist @LSE studying cooperation and conflict across cultural divides
Assistant Professor in Management Science at Aalto University, studying computational decision science. http://users.aalto.fi/ileppane
Assistant Professor, Work and Organizational Psychology at University of Amsterdam. Research on Financial Scarcity, Inequality, Decisions.
Assistant Professor at Aarhus University | investigating how scarcity and economic inequality influences financial and moral judgment & decision-making
Website: https://www.au.dk/en/chel@mgmt.au.dk
University of Plymouth (UK); Max Planck Institute for Human Development, Berlin; Decision Making Researcher
Full professor of Applied Math @ Universidad Carlos III de Madrid. Member of Interdisciplinary Group on Complex Systems (GISC). Research on complex systems, mostly but not only social. https://anxosanchez.eu
Assistant Professor in Sociology at @rug.nl | Interdisciplinary researcher interested in social networks, cooperation, and social and economic inequality | Assistant director of the ENDOW project: endowproject.github.io 🏳️🌈
Social Psychologist/Neuroscientist. Faculty at IDG/McGovern Institute Beijing Normal University. Personal Website: mirrorneuronwang.com