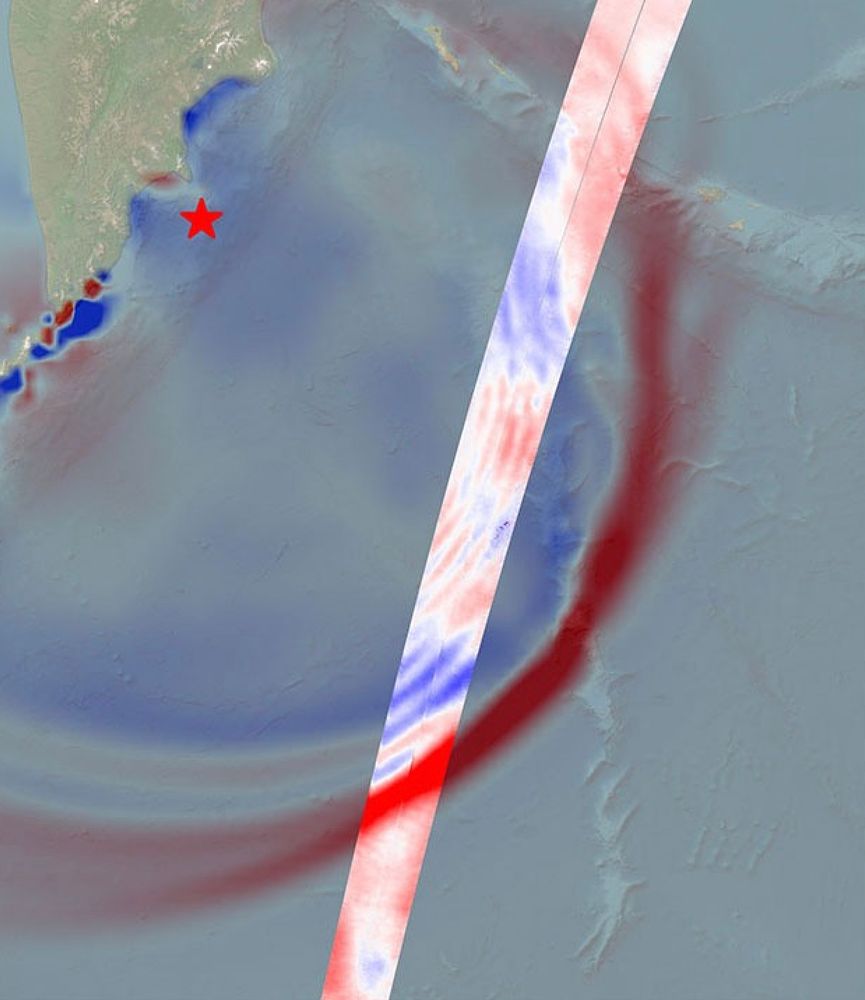
This is incredibly cool: NASA/CNES's SWOT satellite captured a live view of the leading edge of the tsunami formed by the 8.8 magnitude Kamchatka Peninsula earthquake!
www.nasa.gov/missions/swo...
@pearoid.bsky.social
Urban Planning, GIS and Cartography musings www.spatialoverlay.xyz

This is incredibly cool: NASA/CNES's SWOT satellite captured a live view of the leading edge of the tsunami formed by the 8.8 magnitude Kamchatka Peninsula earthquake!
www.nasa.gov/missions/swo...
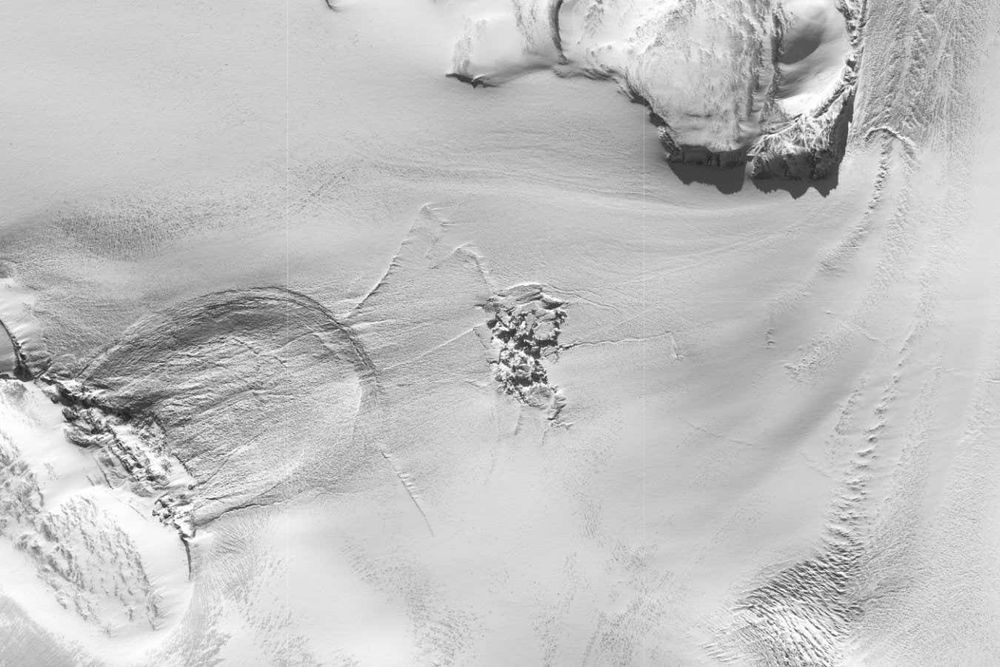
A subglacial lake erupted from 85m below the surface of the Greenland ice sheet, apparently because of pressure caused by the increasing buildup of meltwater www.newscientist.com/article/2490...
31.07.2025 07:37 — 👍 46 🔁 18 💬 3 📌 5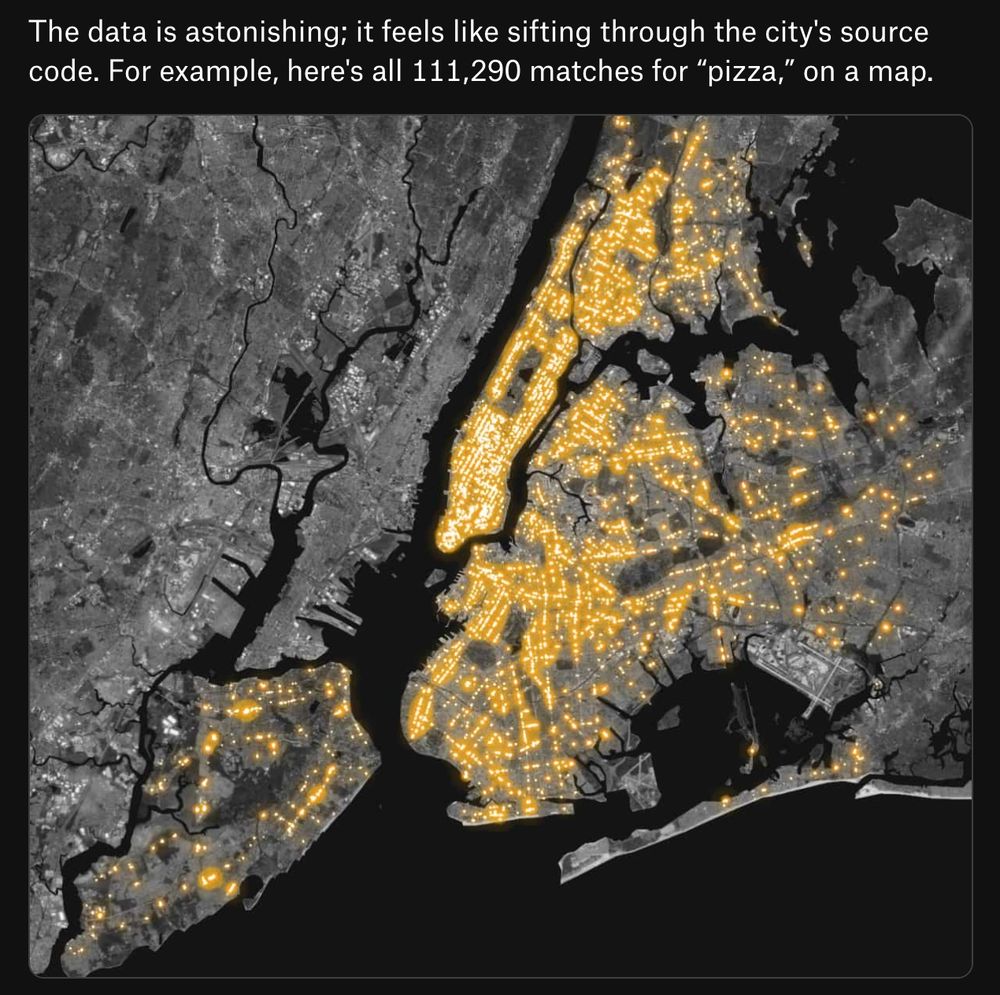
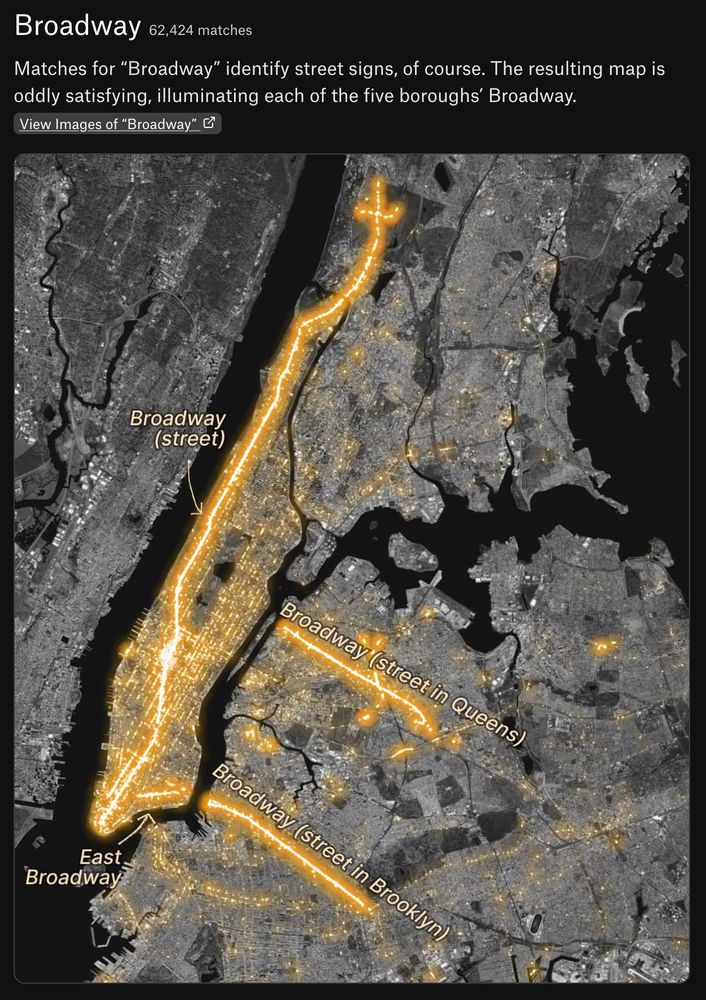
Love these maps of "street-text sightings" in the Pudding's latest piece
pudding.cool/2025/07/stre...

Interesting article: www.theguardian.com/us-news/2025...
22.07.2025 00:27 — 👍 1 🔁 0 💬 0 📌 0My bad!
21.07.2025 14:23 — 👍 1 🔁 0 💬 0 📌 0What's the stop called please?
21.07.2025 07:23 — 👍 1 🔁 0 💬 1 📌 0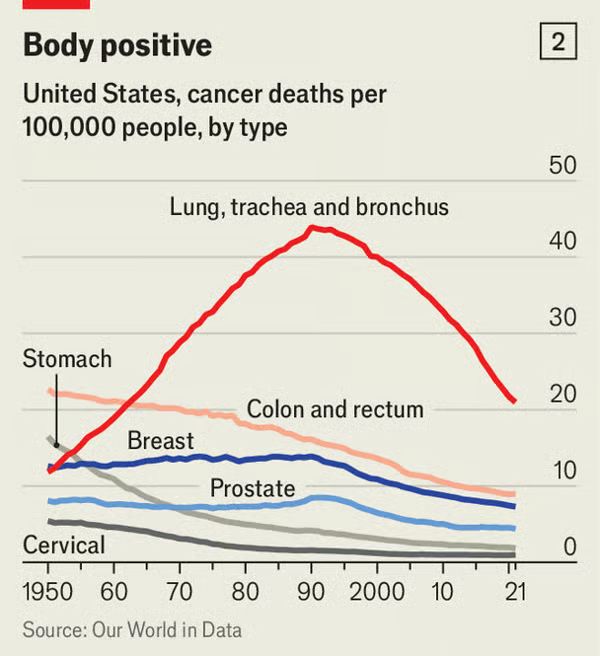
Line chart from The Economist showing cancer deaths by type in the US. Fatal cases of lung, trachea and bronchus cancer have been falling steeply since peaking in 1990
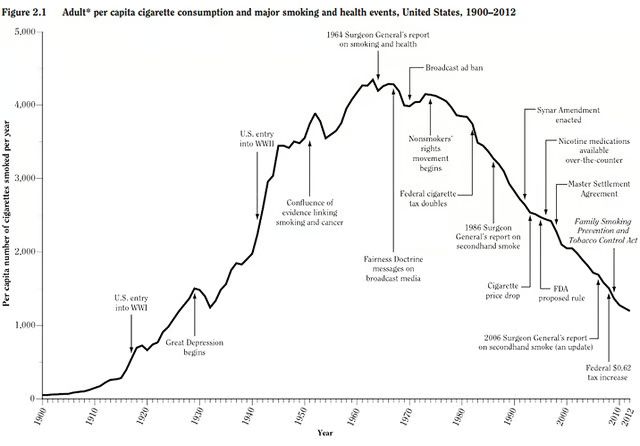
Line chart from Jason Kottke called "The rise and fall of American smoking". Adult cigarette consumption in the US has been falling sharply since peaking in the 1960s
A fantastic chart from our cover Briefing on the impressive progress the world is making on averting cancer, and an unrelated chart on cigarette consumption
www.economist.com/briefing/202...

More than 2,100 pubs across the country have closed since 2005, according to a new report
14.07.2025 05:38 — 👍 4 🔁 3 💬 5 📌 0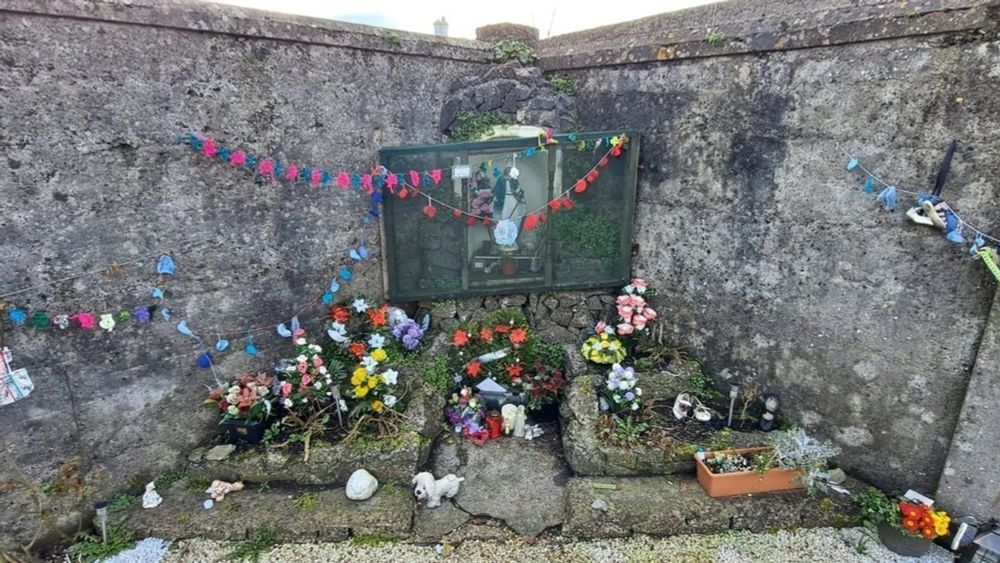
Excavation work is due to commence at the site of the former mother-and-baby home in Tuam, Co Galway
14.07.2025 05:32 — 👍 48 🔁 16 💬 0 📌 1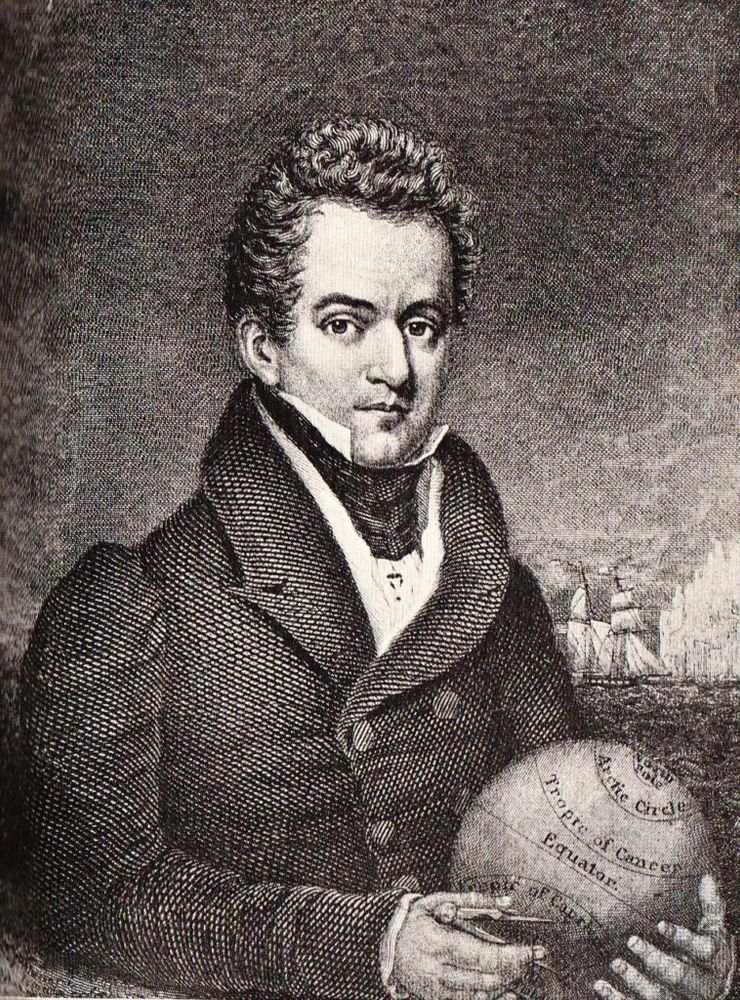
Benjamin Morrell portrait
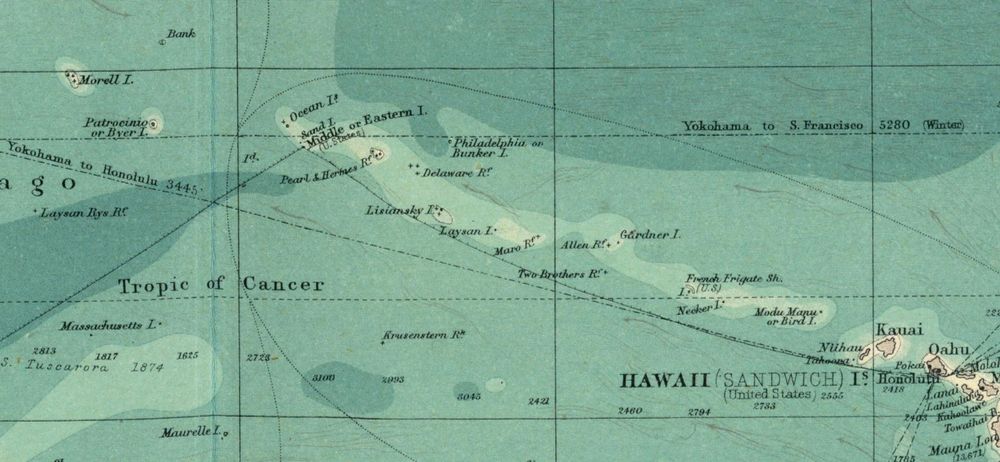
Map: South Pacific Ocean (John Bartholomew, 1922). Source: David Rumsey
#OTD in 1825, Benjamin Morrell - the "biggest liar in the Pacific" according to his contemporaries - sighted a new island west of Hawaii. He named it Byer's Island after the ship’s owner.
Early the next morning, another island was stumbled upon. This he named after himself - Morrell's Island.
![Comic. [two people in labcoats look at body pierced with blade draped over bench] PERSON 1: We found him lying uncomformably on the lab bench. I wonder if the iron-rich intrusion in his back is related. PERSON 2 with ponytail: It could be clastic. Maybe a rift opened in his body, and the intrusive material later fell into the hole. [caption] The Geology Department Investigates Their First Murder](https://cdn.bsky.app/img/feed_thumbnail/plain/did:plc:cz73r7iyiqn26upot4jtjdhk/bafkreidexczuo22iq6o77sexfgdpvgx6baetimwtkzoeb7h7glon7enx4y@jpeg)
Comic. [two people in labcoats look at body pierced with blade draped over bench] PERSON 1: We found him lying uncomformably on the lab bench. I wonder if the iron-rich intrusion in his back is related. PERSON 2 with ponytail: It could be clastic. Maybe a rift opened in his body, and the intrusive material later fell into the hole. [caption] The Geology Department Investigates Their First Murder
Geology Murder
xkcd.com/3112/
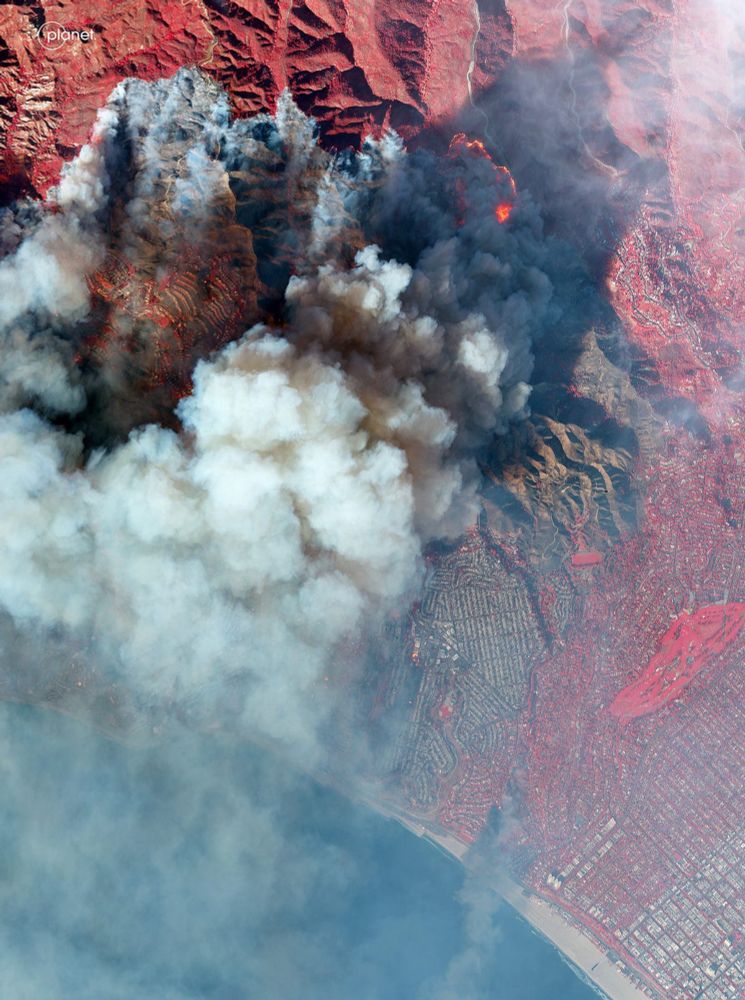
More Stories from Space! Here are some of my favorite recent examples of data journalism that use satellite data as a key element.
medium.com/@robsimmon/n...
If you’re interested in exploring the possibilities, please get in touch.
#dataviz #cartography 📊🗺️🛰️
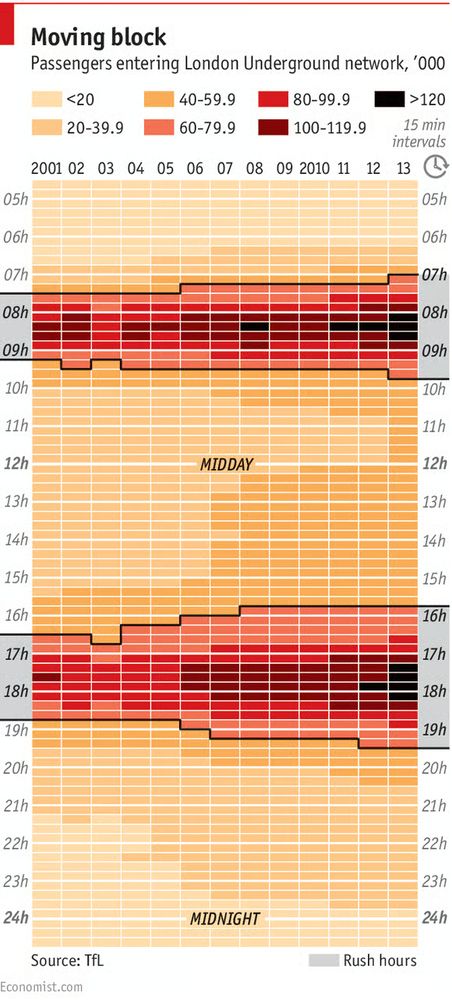
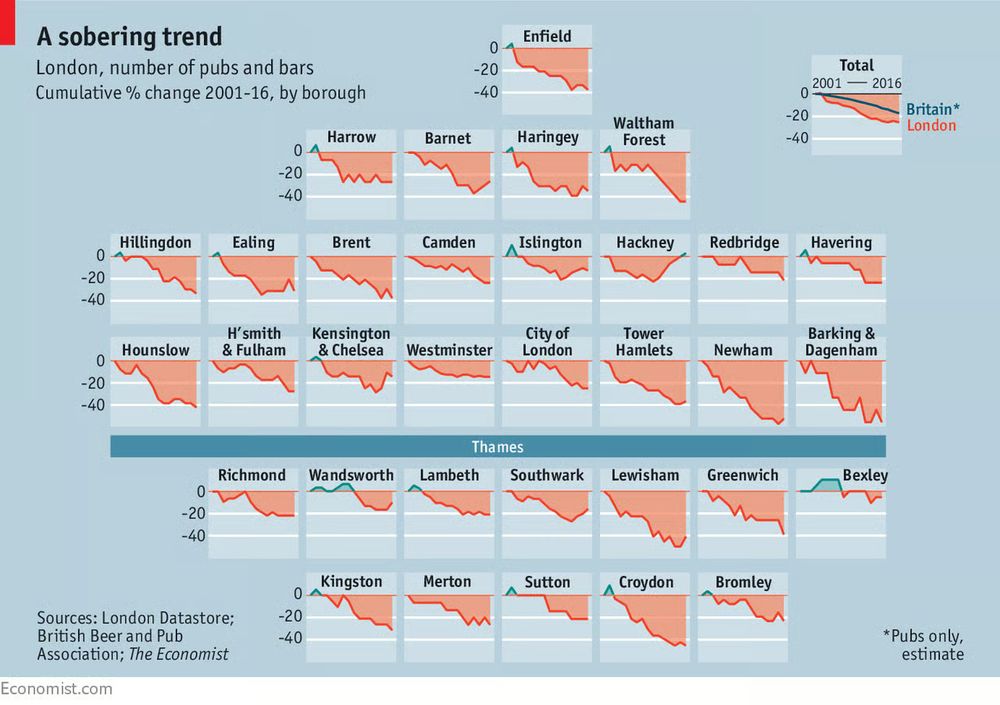
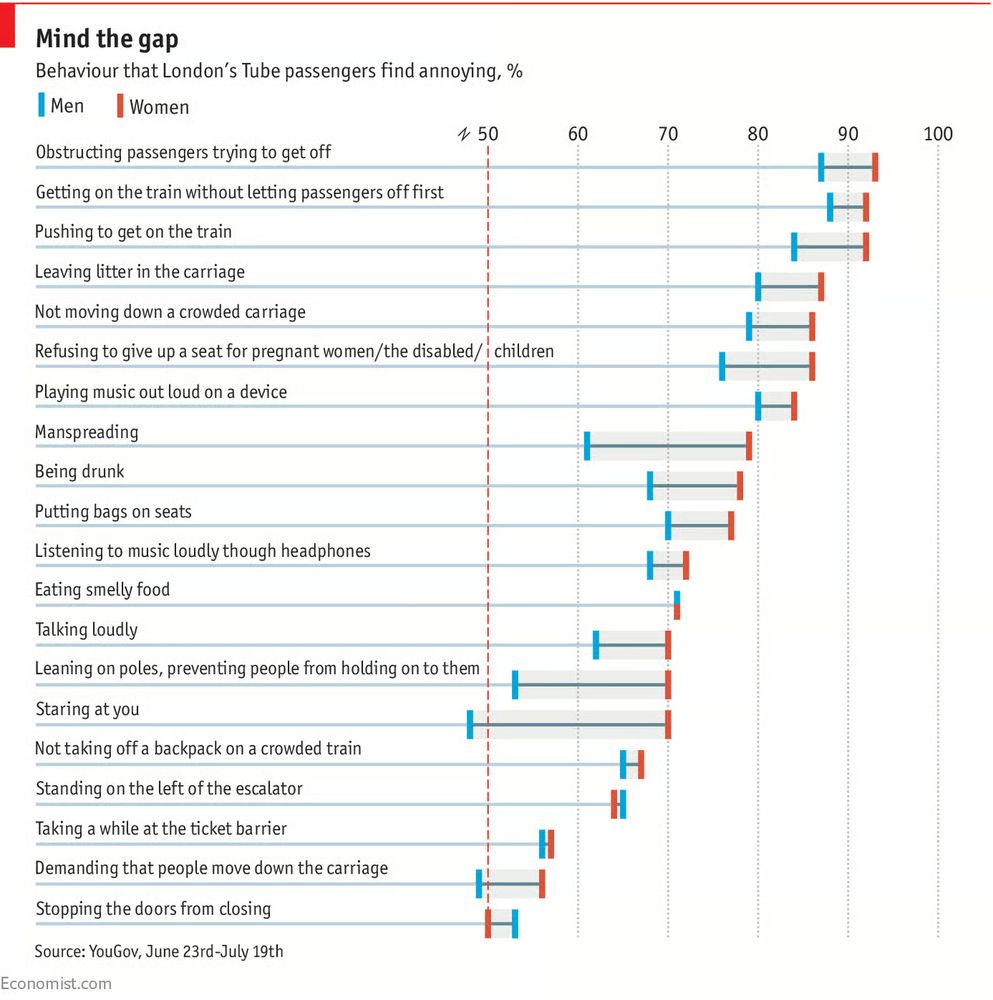
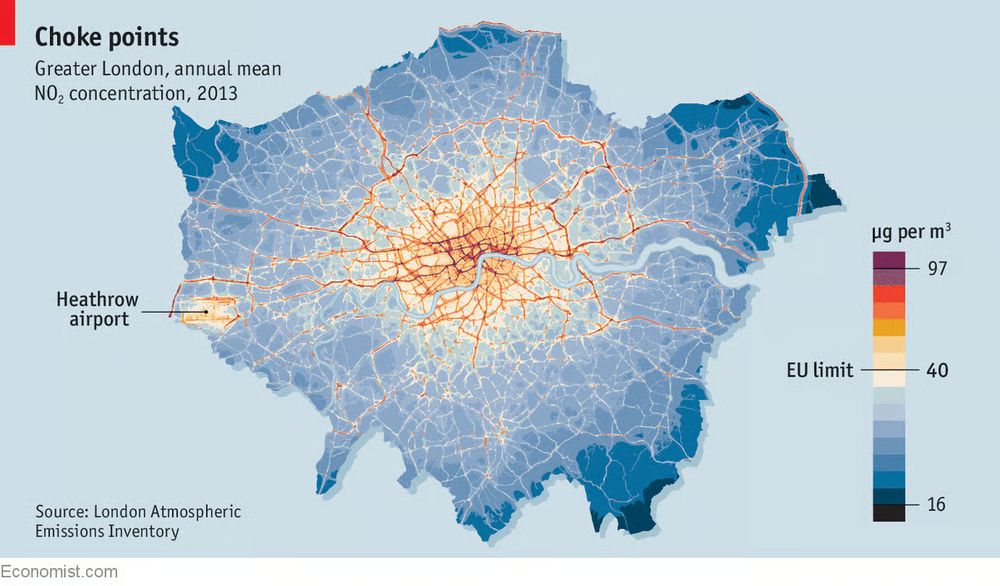
It will also feature some of my favourite Economist charts and maps about London
05.07.2025 14:30 — 👍 13 🔁 2 💬 0 📌 0Sick burn
04.07.2025 07:59 — 👍 0 🔁 0 💬 0 📌 0Ouch
03.07.2025 21:33 — 👍 18 🔁 2 💬 3 📌 0Found a cool feature of ogr2ogr: you can use SQL like 'SELECT * EXCEPT (col1, col2) FROM table' with the -sql parameter to exclude a few fields from the conversion process. Handy when you've got lots of fields and don't want to list them all out in the SELECT.
See gdal.org/en/stable/us...
#gis #gdal

Aaron Sorkin is reportedly pegged to write and direct a sequel and/or follow-up to ‘The Social Network,’ focusing on recent stories in ‘The Wall Street Journal’ about Facebook’s ongoing harms.
25.06.2025 21:25 — 👍 11 🔁 3 💬 0 📌 5Wow, that's cool
28.06.2025 04:29 — 👍 1 🔁 0 💬 0 📌 0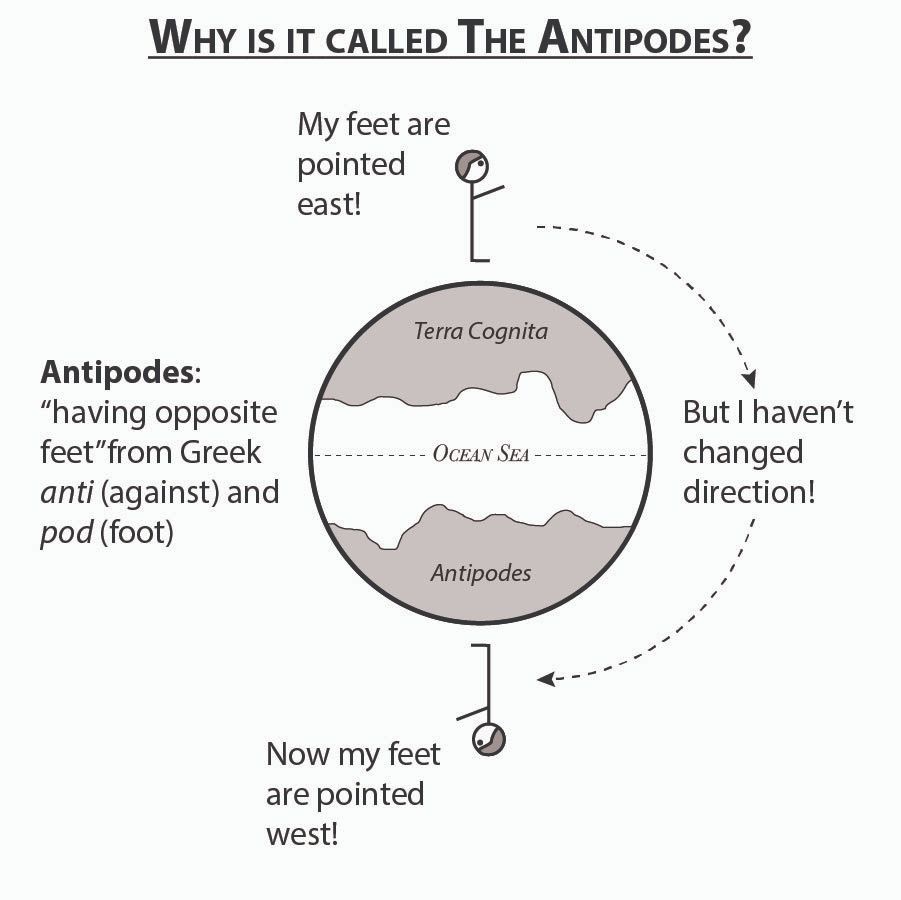
Diagram labeled: "Why is it called the Antipodes?" The diagram shows a stick figure standing on top of a globe, meant to be the earth. Inside the globe are two landmasses: one at the top labeled "Terra Cognita" and one at the bottom labeled "Antipodes." Between them is a dotted line at the equator, and the words "Ocean Sea." The stick figure is facing right, and has text next to him that says, "My feet are pointed east!" There is an identical stick figure on the other side of the world, but he's upside down so he is facing to the left. The text next to him reads, "Now my feet are pointed west!" On the right side of the globe is a dotted line with arrows indicating motion from the top down to the bottom, around the outside of the globe Text reads, "But I haven't changed direction!" On the left side of the globe is the word "Antipodes:" in bold, and below it is a definition which reads: "having opposite feet" from Greek anti (against) and foot (pod).
I'm writing a patreon post about the Hereford Map, and I'll share it when it's ready. But, along the way, I made this little Antipodes explainer, and I thought I'd share.
21.06.2025 18:55 — 👍 256 🔁 57 💬 13 📌 2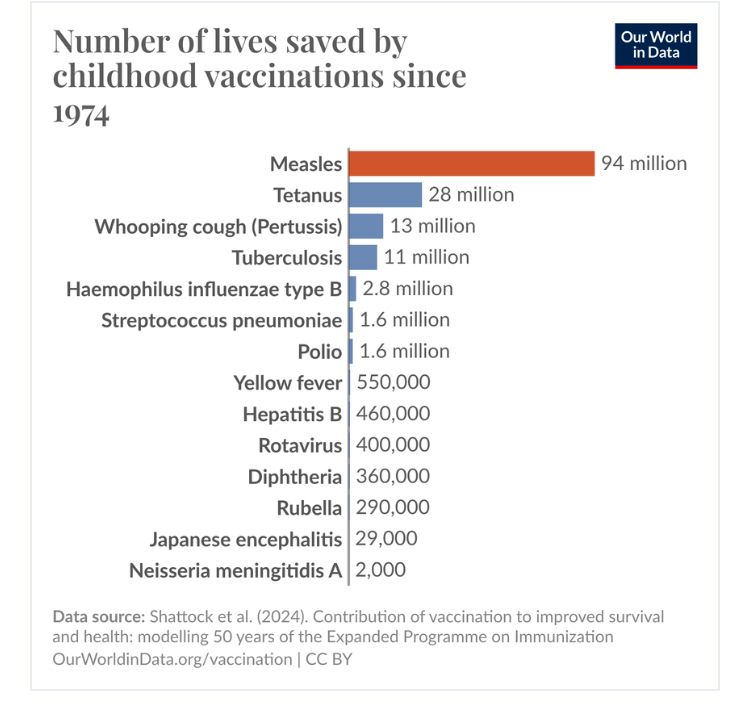
Chart showing estimates of number of lives various vaccines have saved over 50 years
How many children’s lives has the measles vaccine saved in 50 years?
Around 90 million.
Important to remind ourselves that vaccines save lives
ourworldindata.org/data-insight... @ourworldindata.org
Definitely noticing it quite a bit. My pet peeve is the way huge z values have become normal totally changing people's default sense of terrain
15.06.2025 14:05 — 👍 1 🔁 0 💬 0 📌 0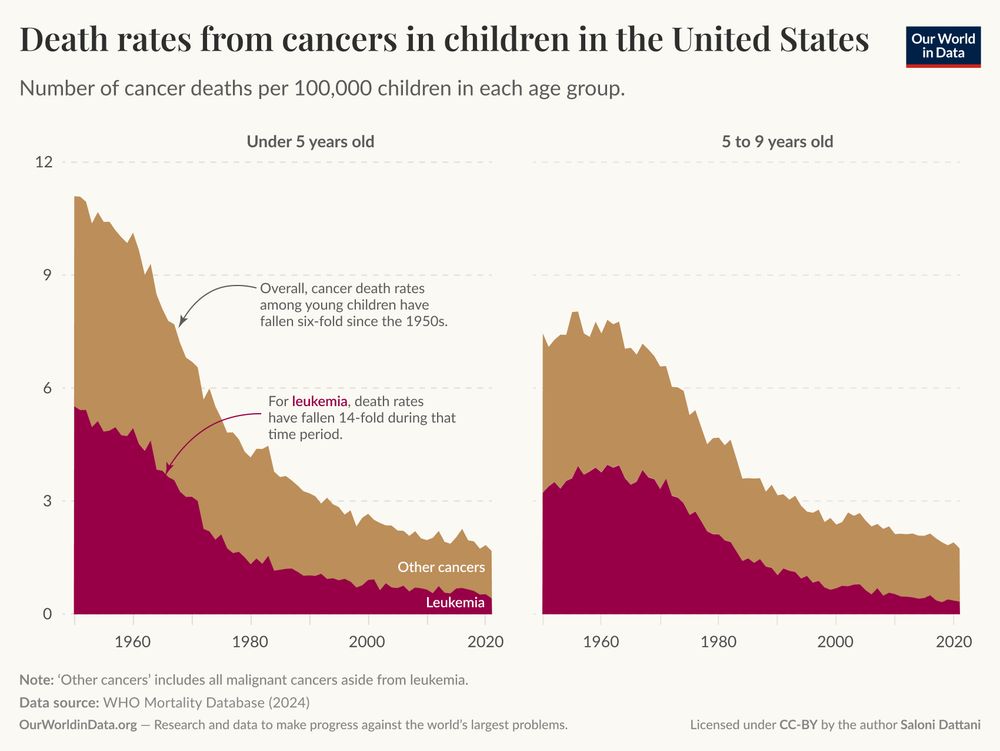
A stacked area graph showing the decline in death rates from leukemia and other cancers in children in the United States. There are two panels showing the death rates in different age groups: below 5 years and 5 to 9 years. On the left panel for the below 5 years age group, the leukemia area shows a steep decline from about 6 deaths per 100,000 children in the 1960s to around 0.4 by the 2020s, indicating a 14-fold decrease in leukemia deaths over this period. An annotation explains that overall cancer death rates have fallen six-fold among young children since the 1950s. The right side shows a similar trend for the 5 to 9 years age group with a less dramatic decline than for younger children. The footer notes that "other cancers" includes all malignant cancers aside from leukemia. Data source listed as the WHO Mortality Database 2024. The chart is published by Our World in Data, and licensed under CC-BY, by the author Saloni Dattani.
Before the 1970s, most children affected by leukemia would quickly die from it. Now, most children in rich countries are cured.
The next big challenge is ensuring that these advances reach children everywhere.
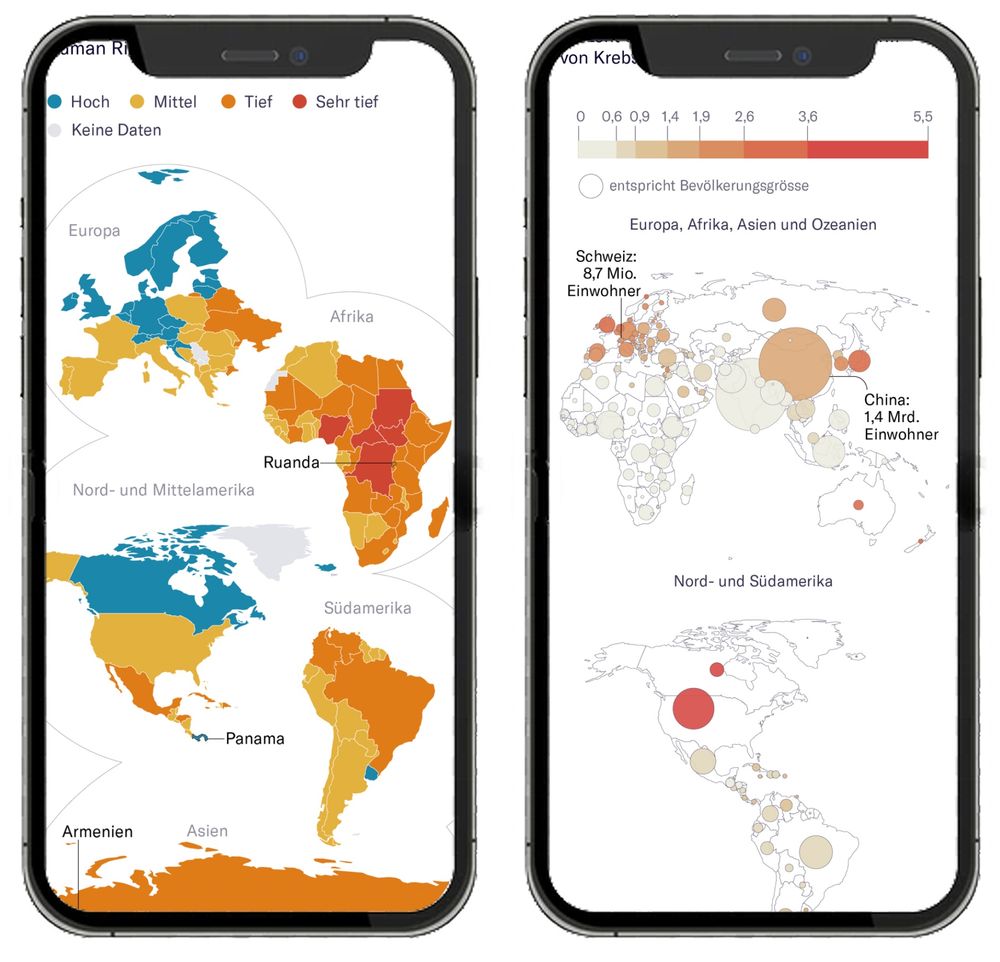
Two smartphones displaying alternative thematic world maps. The left screen shows a split-continent map with countries grouped and resized by region (e.g., Europe, Africa, Asia) using color to indicate data levels (legend: Hoch, Mittel, Tief, Sehr tief). Smaller countries like Rwanda and Panama are clearly labeled and more visible due to the rearranged layout. The right screen displays a bubble map, where countries are represented by circles scaled to population size and shaded by data intensity. Larger countries like China and the U.S. have prominent bubbles, while smaller countries remain visible. Labels indicate population figures for Switzerland and China.
Better world maps for mobile!
Despite years of mobile-first design, there’s been little experimentation in this area. So we designed our own at NZZ – and validated it in a large user study.
Summary of the paper: jonasoesch.ch/articles/the... 1/3
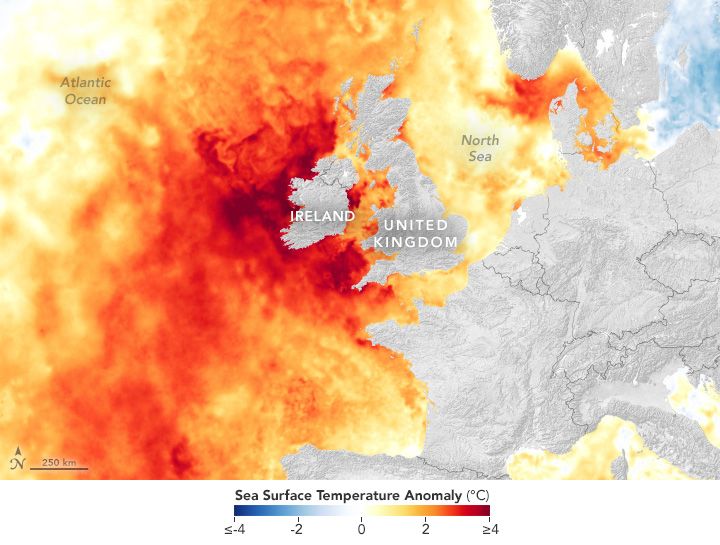
Unusually warm sea surface temperatures lingered for months in the waters around the U.K. and Ireland in Spring 2025
Sea surface temperatures in some areas reached up to 4 degrees Celsius (7 degrees Fahrenheit) warmer than normal
The new GDAL 3.11 CLI has context-aware bash completion and spelling suggestions – options, formats, sub-commands, and more! No more fumbling for inconsistent names or orderings.
Join us at the GDAL CLI Deep Dive webinar on June 3rd at 1400 UTC to learn more. numfocus-org.zoom.us/webinar/regi...
PIN Number
ATM Machine
UPC Code
LCD Display
We regret to inform you that his phenomenon has a name: RAS Syndrome.
Redundant Acronym Syndrome…Syndrome.
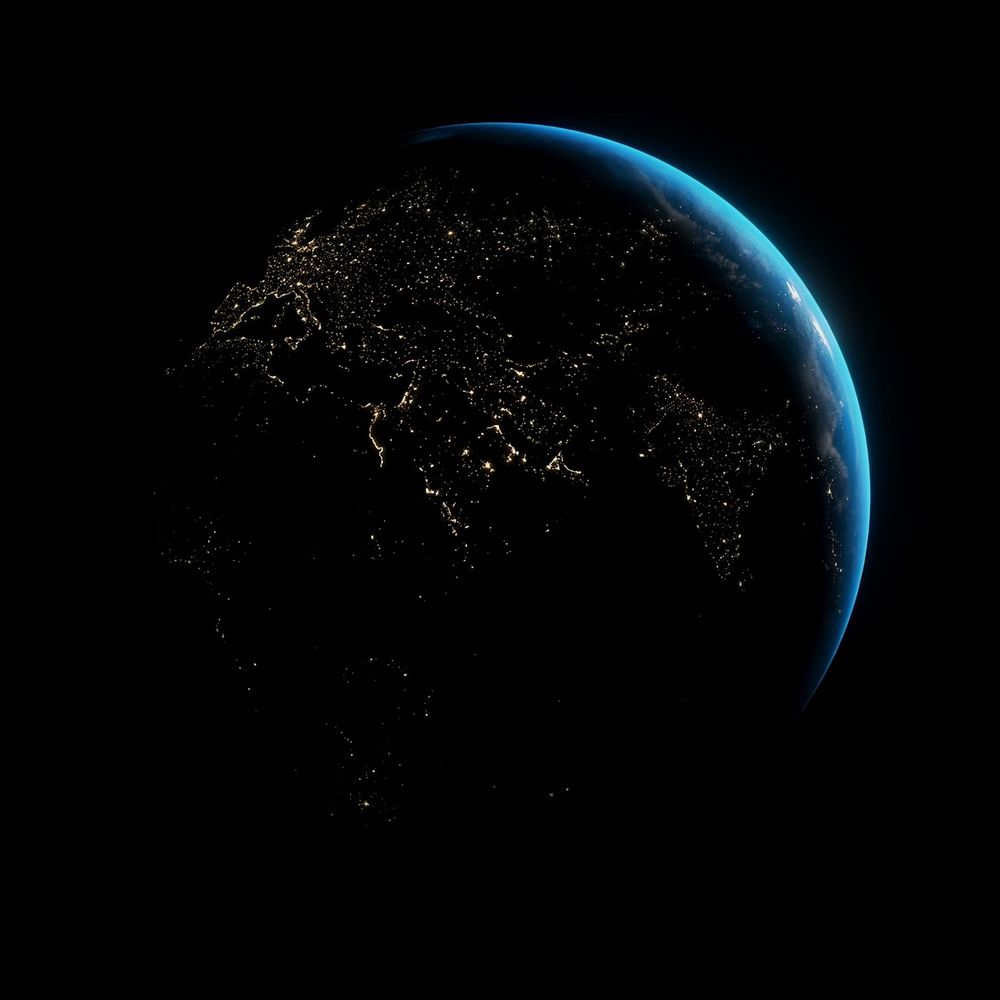
Unsplash image of the Earth, mostly the nightside with a tracery of city lights on every continent.
OK, this is wild.
In September 2023, geophysicists across the world started monitoring a very odd signal coming from the ground under them.
It was picked up in the Arctic. And Antarctica. It was detected everywhere, every 90 seconds, as regular as a metronome, for *nine days*.
What the HELL?
1/
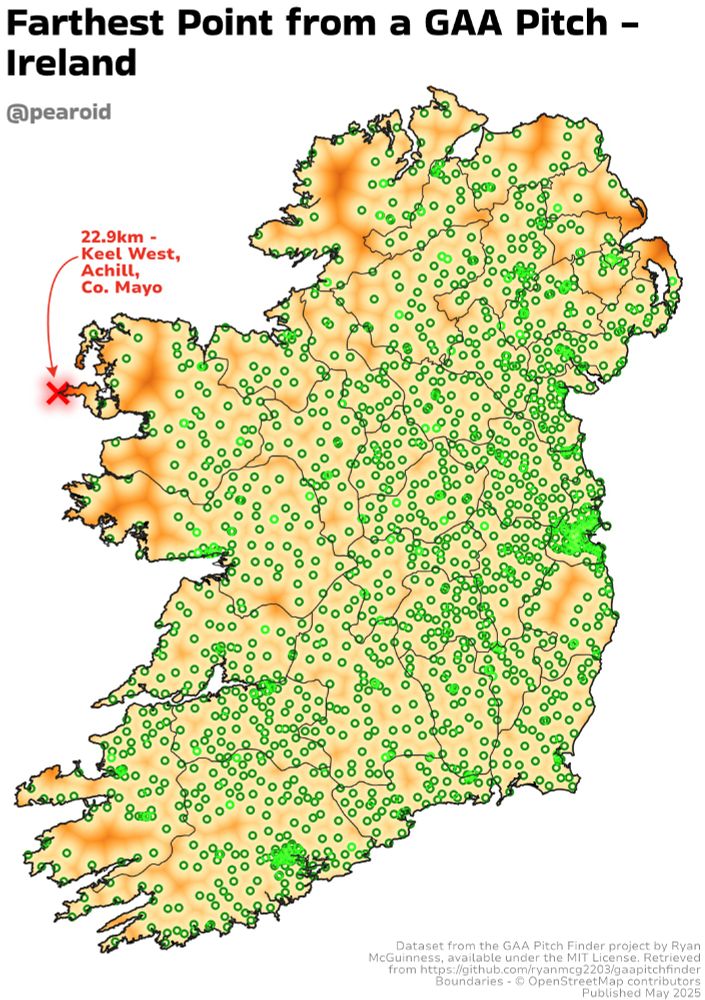
Farthest point from a GAA pitch in Ireland:
05.05.2025 13:44 — 👍 1 🔁 0 💬 0 📌 0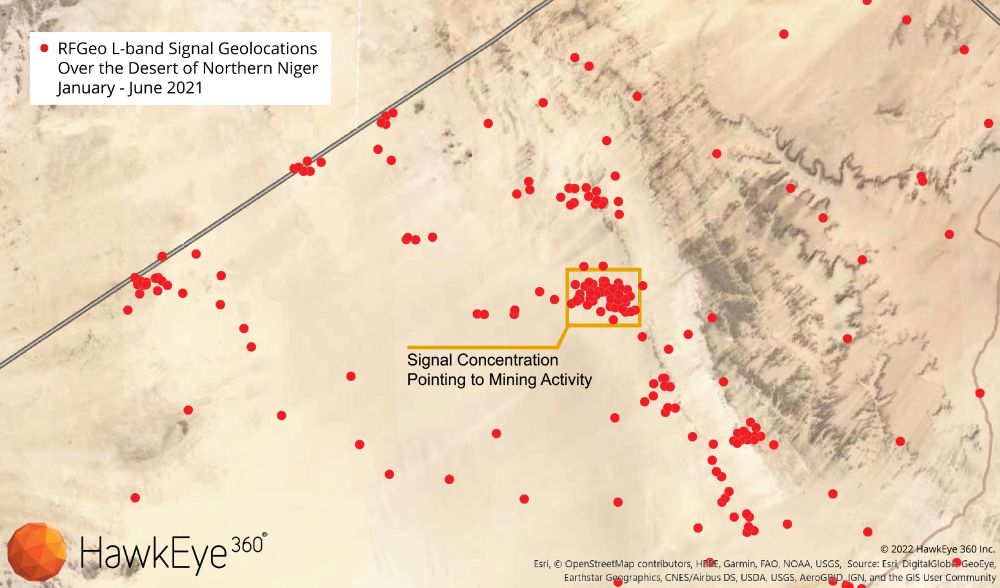
Map showing radio frequency signal detections as red dots on an ESRI satellite view of the Sahara Desert. Concentrations of emissions indicate mining activity. Original caption: RFGeo signal mapping of L-Band mobile satellite devices over Northern Niger reveals human activity. Some of these RF emissions were matched with mining locations throughout the region. The RF data directs analyst attention to the areas with human activity, streamlining workflows for searching these vast regions.
This is neat: HawkEye360 detected radio signals from the heart of the Sahara Desert to uncover artisanal (small-scale, often illegal) mining in Niger:
www.he360.com/resource/usi...