https://ds.dfci.harvard.edu/postdocs/
📢 We are taking applications for our Postdoctoral Fellows Program at Harvard/DFCI!
🔹Join a research group in our department
🔹Co-mentoring opportunities with 2+ faculty
🔹Collaborate with investigators beyond our department
🔹Salary starts at $75K
Apply here: t.co/B7SLZzQFKu
01.12.2025 18:59 —
👍 9
🔁 15
💬 0
📌 0
We agree. I meant function in its most basic definition: every p-dimensional x in your dataset is mapped to a unique 2-dimensional f(x). I did not claim f is defined for all p-dimensional xs.
My point is that this f is difficult or impossible to describe. In contrast, we can write it down for PCA.
24.12.2024 22:47 —
👍 1
🔁 0
💬 0
📌 0
I like it. Thank for the tip.
24.12.2024 22:28 —
👍 0
🔁 0
💬 0
📌 0
I agree. I don't use them at all with genomics data, especially sparse noisy scRNA-Seq data.
It does appear to perform impressively well with high signal-to-noise ratio datasets, such as MNIST.
24.12.2024 13:23 —
👍 1
🔁 0
💬 1
📌 0
It depends on the specific biological insight you want to highlight or communicate.
24.12.2024 13:05 —
👍 2
🔁 0
💬 0
📌 0
Simply Statistics: I give up, I am embracing pie charts
The inertia here is strong. I have not been unable to convince collaborators to not use them on papers I am a co-author on...
I'll keep trying though.
At some point I might give up as I did with pie charts: simplystatistics.org/posts/2012-1...
24.12.2024 12:58 —
👍 3
🔁 0
💬 1
📌 0
As made clear in the blogpost I am not against UMAP either. But when I see a plot in a paper, I want to understand what I am being shown and why.
Other than to show different cell types have different expression patterns, which I already know, or to decorate,
why use UMAP to display in 2D?
24.12.2024 12:49 —
👍 6
🔁 2
💬 3
📌 0
What am I supposed to learn from that plot? Cell types have different expression patterns. Those are markers for different cell types. So, this just confirms something obvious. Do all those non-linear shapes and tiny clusters represent anything biological?
24.12.2024 12:40 —
👍 4
🔁 0
💬 2
📌 0
To be clear, as the post explains, UMAP can be useful for exploratory data analysis. My concern is their inclusion in papers as if they were results. What exactly is the reader supposed to learn? And how often are we misdirected by false clusters or artifactual shapes?
23.12.2024 19:35 —
👍 15
🔁 1
💬 2
📌 0
Can you explain what the axes represent?
As mentioned in the post, UMAP can be useful for exploring data. But why are plots included in papers? What is the reader supposed to get out of them? The 2D distance between points can't be interpreted.
It seems the only reason is because they are pretty.
23.12.2024 19:25 —
👍 10
🔁 0
💬 7
📌 0
There are plenty of alternatives. They don’t produce flashy art work but they do provide scientific insights.
If journals want art work no need to pretend we are analyzing data. Just paint pretty pictures.
23.12.2024 17:20 —
👍 9
🔁 0
💬 1
📌 0
This is unfortunately true. I would say the main reasons are that the subject is hard and deep understanding is not incentivized enough.
But note understanding UMAP is much harder than understanding pvalues.
23.12.2024 14:54 —
👍 3
🔁 0
💬 0
📌 0

🚨 We're hiring! 🚨
Join us at @HarvardBiostats and @dfcidatascience
We are filling THREE positions:
1️⃣ Tenure-track (any rank) in AI/ML
2️⃣ Assistant Professor in Single Cell Genomics
3️⃣ Lecturer & Director Training/Education
Need to apply separately for each role. Links 👇
26.11.2024 15:06 —
👍 5
🔁 1
💬 1
📌 0
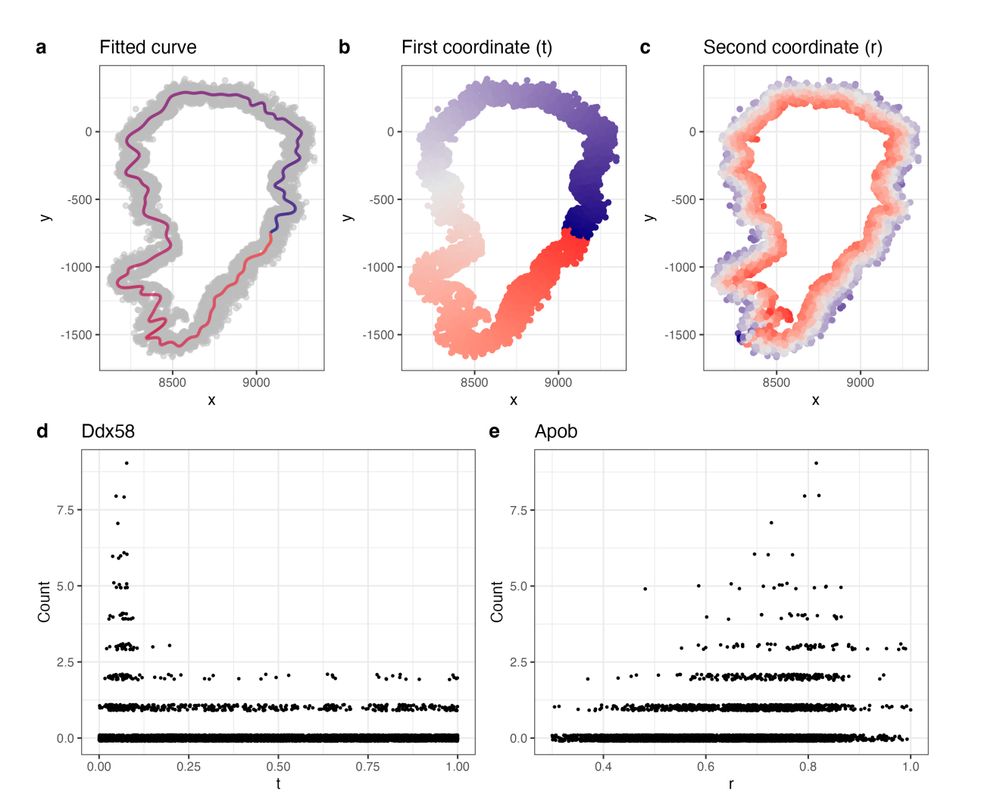
New method for identifying spatially variable genes in spatial transcriptomics.
We use spectral graph theory to extract 1D curves related to tissue morphology, creating a more relevant coordinate system. Improves sensitivity.
with @PhillipNicol et al.
www.biorxiv.org/content/10.1...
22.11.2024 20:04 —
👍 41
🔁 11
💬 0
📌 0

Question for #rstats educators: Do you use a standard format for exercises?
I have 100s of exercises along with solutions in quarto documents (see image). But they are not formatted in a systematic way. I would like to easily create docs with and w/o solutions and export to LMS.
07.12.2023 14:10 —
👍 5
🔁 0
💬 1
📌 0
Hoy inicia nuestro Curso en español de Ciencia de Datos: Fundamentos de R en HarvardX! Aprenderás desde los básicos hasta data wrangling, conceptos de programación e importación de datos. La versión gratis y en línea te da acceso a los videos, textos y ejercicios.
t.co/TGID4IwTSQ
19.10.2023 17:00 —
👍 9
🔁 4
💬 0
📌 1
Starting to work on it 😅
22.09.2023 13:55 —
👍 1
🔁 0
💬 0
📌 0
Data visualization is used in two ways in data analysis:
1) Communicating data insights.
2) Guiding analysis and spotting data issues.
While modern courses and books focus on the first, it's the second - exploratory data analysis - that is more important and harder to teach.
22.09.2023 13:24 —
👍 7
🔁 2
💬 1
📌 0
Introducing the Data Science Postdoctoral Fellows Program at Harvard/DFCI!
- Join a research group in our department
- Co-mentoring opportunities with 2+ faculty
- Collaborate with DFCI investigators beyond our department
- Salary starts at $75K
Apply here: ds.dfci.harvard.edu/postdocs/
20.09.2023 16:59 —
👍 3
🔁 5
💬 0
📌 0