great post!!
04.08.2025 21:08 — 👍 1 🔁 0 💬 1 📌 0
so excited to share that our preprint characterizing the dorsal anterior cingulate cortex in post-mortem human brain from @lieberinstitute.bsky.social is out! we integrated matched SRT and snRNA-seq data to investigate agranularity and von Economo neurons
24.07.2025 01:53 — 👍 13 🔁 3 💬 1 📌 3
thanks, Lukas!
24.06.2025 02:08 — 👍 1 🔁 0 💬 0 📌 0
thank you!!
17.06.2025 23:39 — 👍 1 🔁 0 💬 0 📌 0
my work with @stephaniehicks.bsky.social and @boyiguo.bsky.social has been published in Biostatistics! tldr: the mean-variance bias exists in SRT data & impacts SVG detection. we propose #spoon, available on @bioconductor.bsky.social, to address this! pmc.ncbi.nlm.nih.gov/articles/PMC... 🤩
17.06.2025 00:17 — 👍 7 🔁 3 💬 2 📌 0

Kinnary Shah is a fourth-year PhD candidate and co-president of the Biostats Student Org. Learn more about Kinnary and two of her ongoing research projects, one with the @lieberinstitute.bsky.social, and one with @stephaniehicks.bsky.social, on our website:
publichealth.jhu.edu/departments/...
28.05.2025 16:17 — 👍 11 🔁 5 💬 0 📌 0
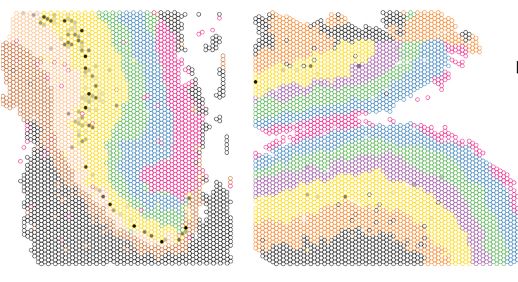
Spot plots from spatial transcriptomics data highlighting enrichment (black dot in the yellow) of a molecular signature in the dorsal anterior cingulate (left) versus the dorsolateral prefrontal cortex (right) of human brain tissue
despite the rough start, I *think*🤞 I'm on my way, and I am excited and honored for the opportunity to present work led by @kinnaryshah.bsky.social identifying molecular rationale behind evolutionary specializations in the cingulate versus the prefrontal cortex of human 🧠
24.05.2025 19:50 — 👍 15 🔁 2 💬 0 📌 0
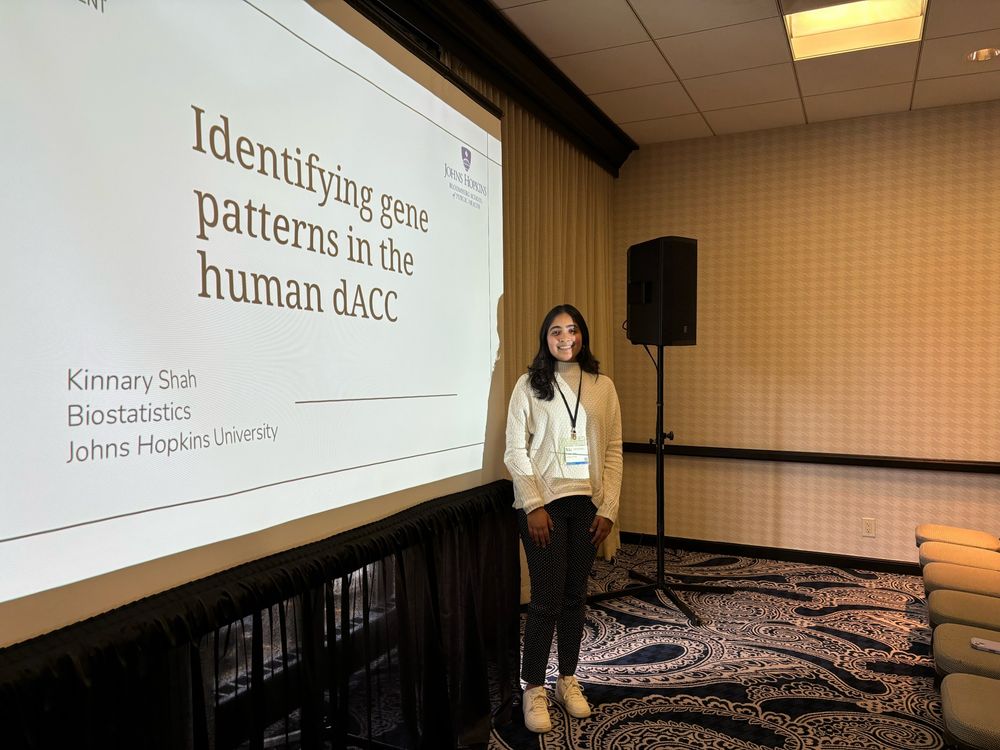
i had the great opportunity to present some of our work integrating dACC SRT and snRNA-seq data from neurotypical donors at #STATGEN2025 today! keep your eyes peeled for this project - coming out soon 🧠🧬
23.05.2025 01:28 — 👍 8 🔁 1 💬 1 📌 0
I haven't worked with imaging data and don't know its properties as well! Definitely open to other opinions/thoughts on this 3/3
17.11.2024 00:30 — 👍 2 🔁 0 💬 1 📌 0
Measuring gene expression is inherently noisy, so in lower expressed genes, there is more variability in variance values. I would guess that it does not exist in imaging-based SRT data because those steps do not happen and images are taken for specific genes. This answer is with the caveat that 2/3
17.11.2024 00:30 — 👍 1 🔁 0 💬 1 📌 0
Thank you @clarencemah.bsky.social! The mean-var relationship exists in SRT data from barcode-based technologies since the mean-var relationship exists because the sample preparation and library preparation steps seem to have more trouble with reliably quantifying lowly expressed genes 1/3
17.11.2024 00:28 — 👍 0 🔁 0 💬 1 📌 0
thank you @stephaniehicks.bsky.social and @boyiguo.bsky.social for your amazing mentorship on this project! so excited that this is finally out
16.11.2024 22:27 — 👍 5 🔁 1 💬 0 📌 0
Postdoc - https://bsky.app/profile/lukesjulson.bsky.social @ Albert Einstein College of Medicine | Ph.D. JHU SOM - https://bsky.app/profile/martinowk.bsky.social @ LIBD.
Assistant Professor at Johns Hopkins Bloomberg School of Public Health | AI | Machine Learning | Causal Inference | Data Science | Health Services Research | Aging | Kidney Disease | https://wenbowu.me
Postdoctoral neuroscientist at JHU working at the intersection of neural circuits, bioinformatics, and psychiatric disorders.
https://mictott.github.io
Clinical Psych PhD candidate at Emory
Founder and Executive Director of @standupforscience.bsky.social
Standupforscience.net
"Colette is wearing brass knuckles...w/ spikes tipped in poison"
“Delusional broad”
"Lady Switchblade"
“Ditsy socialist liberal”
The @jhu.edu Bloomberg School of Public Health
https://publichealth.jhu.edu/
Biostatistics PhD Candidate @jhubiostat.bsky.social
Biostatistician, graduate student at the University of Washington
Personal: alejandroh3005.github.io
📊 epidemiologist
🧬 genetics, envt, & public health in diverse pops
💻 Postdoc @ NCI
📚✅ PhD JHU Genetic Epi
📝 Editor @genebites.org | AAAS MMF alum
pronounced “JAY-uh-tea”
views my own
WashU Medical student (MD) - Oncology
Cancer Bioinformatics #MedSky #OncSky #AI #Transcriptomics #Immunotherapy
Via Cornell, NCI | views are my own
Longevity medicine best practices | healthspan | precision medicine | geroscience | bio/acc | consulting @ agingdoc.com
Connect: http://linkedin.com/in/agingdoc
(she/her) Asst Prof of Biostatistics @UPenn DBEI and @CHOP. Survival, observational, and high-dimensional data methods and kidney disease researcher. Views are my own. www.zeelab.org
Research Associate@JohnsHopkinsDMH @dmh-bsph.bsky.social @JohnsHopkinsSPH ||Data Science||Quantitative methods||Substance Use Epidemiology||EMA||
Professor, UMN Biostatistics & Health Data Science. Co-founder, Daynamica (www.daynamica.com). Canadian still pronouncing Z the right way, usually.
Pathologist LSU, hematopathology, renal pathology
@𝙉𝘾𝙄𝙂2013; 𝗢𝘂𝗿 𝗚𝗲𝗻𝗼𝗺𝗶𝗰𝘀 𝗶𝗻 𝗢𝘂𝗿 𝗛𝗮𝗻𝗱𝘀. Bluesky Social do not necessarily represent ANU National Centre for Indigenous Genomics (NCIG) views. No DMs. TEQSA PRV12002 | CRICOS 00120C. Ngunnawal Country and Ngambri Country.
On the academic job market | How are species compared to one another across different genomic regions? Postdoc at Langmead Lab, Johns Hopkins | Comparative #genomics at scale | Formerly at UNIL/SIB/WUR | sinamajidian.github.io
Associate Professor of Biostatistics, Johns Hopkins University
Geospatial statistics, machine learning, AI, environmental health, global health
https://abhidatta.com/