Obviously terrible BUT I keep reminding myself that what has been undone can be redone. The science doesn't change, and eventually... EVENTUALLY... we will realign U.S. policy with the science.
13.02.2026 02:53 — 👍 8 🔁 1 💬 0 📌 0
FYI , the original source of that figure was a 2016 EIA report with the (wordy) title: "Wind and Solar Data and Projections from the U.S. Energy Information Administration: Past Performance and Ongoing Enhancements"
www.eia.gov/outlooks/aeo...
23.01.2026 02:20 — 👍 2 🔁 0 💬 1 📌 0
YouTube video by MIT Energy Initiative
Stay humble and prepare for surprises: Lessons for the energy transition with Joseph F. DeCarolis
This animation looks similar to the ones I developed and presented at MIT in 2024 when I was EIA Administrator: www.youtube.com/watch?v=V0fL...
My explanation for natural gas production begins around the 25:50 mark, followed by crude oil, wind, solar, and CO2 emissions.
17.01.2026 23:21 — 👍 6 🔁 1 💬 1 📌 0
Yes, the economics are pretty simple: incentivize demand for gasoline and prices will go up. Look no further than EPA's own regulatory impact analysis earlier this year, which cited EIA projections: www.cbsnews.com/news/epa-rul...
03.12.2025 22:38 — 👍 25 🔁 14 💬 1 📌 0
Funny story about George Dantzig's formulation of the canonical diet program to test his newly developed simplex algorithm. The lesson? Embed some common sense in the model formulation.
Thanks to @bistline.bsky.social for sharing.
13.11.2025 12:50 — 👍 10 🔁 1 💬 0 📌 0
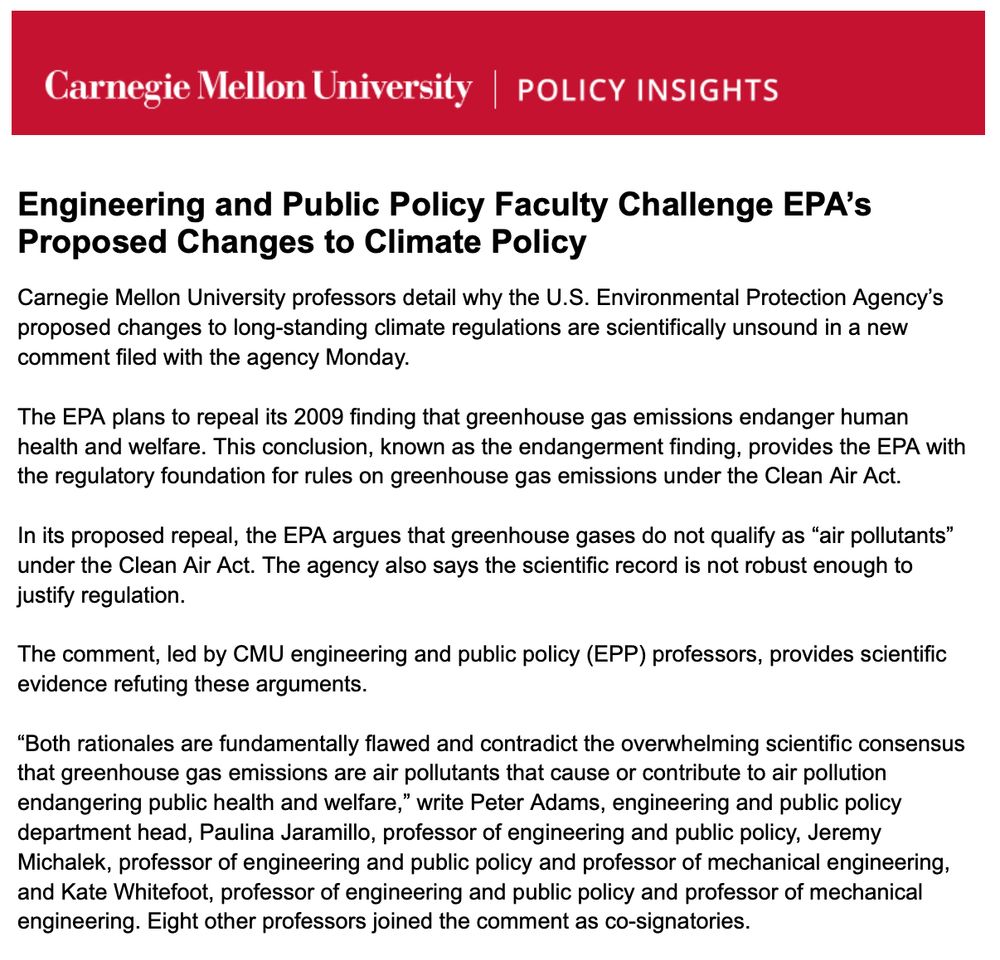
Today we submitted our public comment on critical flaws in EPA's rationale for rescinding its authority to regulate greenhouse gas emissions.
This proposed move is a big deal with profound implications for our future. Today's the last day to comment. www.cmu.edu/cit/veg/publ...
22.09.2025 20:42 — 👍 52 🔁 17 💬 2 📌 1
Excellent piece by @bencasselman.bsky.social on the BLS data revisions.
The U.S. Energy Information Administration, another federal statistical agency, faces similar data challenges. The accuracy vs timeliness tradeoff is universal: data collected at higher frequency is inherently noisier.
07.08.2025 02:36 — 👍 15 🔁 3 💬 0 📌 0

And here the timely EIA data (and analysis) on oil trade volumes through the Strait of Hormuz - 20% of global oil consumption:
www.eia.gov/todayinenerg...
22.06.2025 20:29 — 👍 4 🔁 1 💬 1 📌 0
I was happy to participate in this event and explain how the U.S. Energy Information Administration meets energy data needs in the United States. 🔌💡
13.05.2025 12:33 — 👍 8 🔁 1 💬 0 📌 1

DeCarolis named head of Engineering and Public Policy
Joseph DeCarolis has been named head of the Department of Engineering and Public Policy.
Some personal news: This November, I'll be returning to Carnegie Mellon (@cmu.edu) as head of the Department of Engineering and Public Policy (EPP).
I'm honored and excited to help lead EPP into its next chapter.
engineering.cmu.edu/news-events/...
06.05.2025 12:54 — 👍 35 🔁 4 💬 6 📌 0
Wind is hard to model in capacity expansion models because its performance is highly dependent on its spatiotemporal representation. NEMS, like many other models, has a relatively stylized representation of wind resources.
05.05.2025 17:57 — 👍 2 🔁 0 💬 0 📌 0
Over 100 employees leave US EIA, putting crucial energy data at risk, sources say
The U.S. government's energy statistics arm is set to lose over 100 employees after the Trump administration's latest round of resignation offers, putting at risk some of the most closely watched energy reports globally, three sources told Reuters.
If you want to lower energy costs for Americans, you must first understand the US energy system. You can't do that without the robust, accurate data the EIA provides.
The Trump Administration's haphazard dismantling of the EIA will hurt our ability to increase access to cheap, reliable energy.
30.04.2025 15:48 — 👍 123 🔁 31 💬 9 📌 4

GitHub - EIAgov/dash-benchmark
Contribute to EIAgov/dash-benchmark development by creating an account on GitHub.
Last year we also released an open source python dashboard that enables comparisons across AEO editions: github.com/EIAgov/dash-...
(Looks like it hasn't been updated with AEO2025 data yet.)
18.04.2025 00:17 — 👍 1 🔁 0 💬 0 📌 0
All credit goes to EIA staff. (I departed EIA on Jan. 20.)
The EIA Retrospective Report, released every other year, calculates statistics across previous AEO editions: www.eia.gov/outlooks/aeo...
18.04.2025 00:14 — 👍 0 🔁 0 💬 1 📌 0

GitHub - EIAgov/NEMS
Contribute to EIAgov/NEMS development by creating an account on GitHub.
That's all for now.
Again, I appreciate the dedication of EIA staff to produce the AEO under challenging circumstances.
And remember EIA's transparency. Don't like a result? Run NEMS with your own assumptions: github.com/EIAgov/NEMS
17.04.2025 18:15 — 👍 1 🔁 0 💬 0 📌 0
That’s a brief overview of some key results. Remember, modeling assumptions were frozen in December 2024. The effects of Trump’s executive orders and tariff policy, among other factors, could have a significant impact on these projections.
17.04.2025 18:15 — 👍 0 🔁 0 💬 1 📌 0
EV sales also hit a hard upper limit around 55% of new sales. I suspect this has to do with the relative economics between the different vehicle classes as well as details in the consumer choice model. In future AEO editions, EIA should explore assumptions that could lead to higher EV deployments.
17.04.2025 18:15 — 👍 1 🔁 0 💬 1 📌 0

Electric vehicle share of new vehicle sales from EIA's Annual Energy Outloook 2025.
Finally, here’s a look at electric vehicle sales. Excluding several recent transportation-related regulations has a big impact on electric vehicle (EV) deployment.
17.04.2025 18:15 — 👍 0 🔁 0 💬 1 📌 1
You can see from the figure above that electrified transport has a significant impact on electricity demand – note the difference between the Reference case and Alternative Transportation case.
17.04.2025 18:15 — 👍 0 🔁 0 💬 1 📌 0

Total electricity generation from EIA's Annual Energy Outlook 2025.
Overall, total electricity generation increases nearly 50% from 2024-2050. This increase is due to the electrification of end-uses, like transportation, as well as increases in existing sources of electricity demand, like data centers.
17.04.2025 18:15 — 👍 9 🔁 3 💬 1 📌 0

Natural gas-fired generation projections from EIA's Annual Energy Outlook 2025.
And finally, here’s generation from natural gas, which declines over time in most cases as renewables take up an increasing share of generation.
17.04.2025 18:15 — 👍 1 🔁 0 💬 1 📌 0

Nuclear generation projections from EIA's Annual Energy Outlook 2025.
Here’s nuclear generation. Consistent with past AEO editions, nuclear energy remains relatively flat but with some variation. For example, the Low Oil and Gas Supply case leads to more expensive gas, which incentivizes new nuclear capacity in later years.
17.04.2025 18:15 — 👍 0 🔁 0 💬 1 📌 0

Coal-fired electricity generation projections from EIA's Annual Energy Outlook 2025.
Here’s coal. You can see the effect of the EPA 111d regulations on coal generation – it forces nearly full coal retirement by 2040. Note: “Alternative Electricity” removes those new regulations.
17.04.2025 18:15 — 👍 0 🔁 0 💬 1 📌 0

Renewables (wind + solar) generation from EIA's Annual Energy Outlook 2025.
Let’s step through the full set of projections for each major source of electricity generation.
Here’s renewables. (Unfortunately, wind and solar are lumped together in the tables.) Note the marked increases in renewable generation and slowdown in later years when the IRA tax credits expire.
17.04.2025 18:15 — 👍 0 🔁 0 💬 2 📌 0
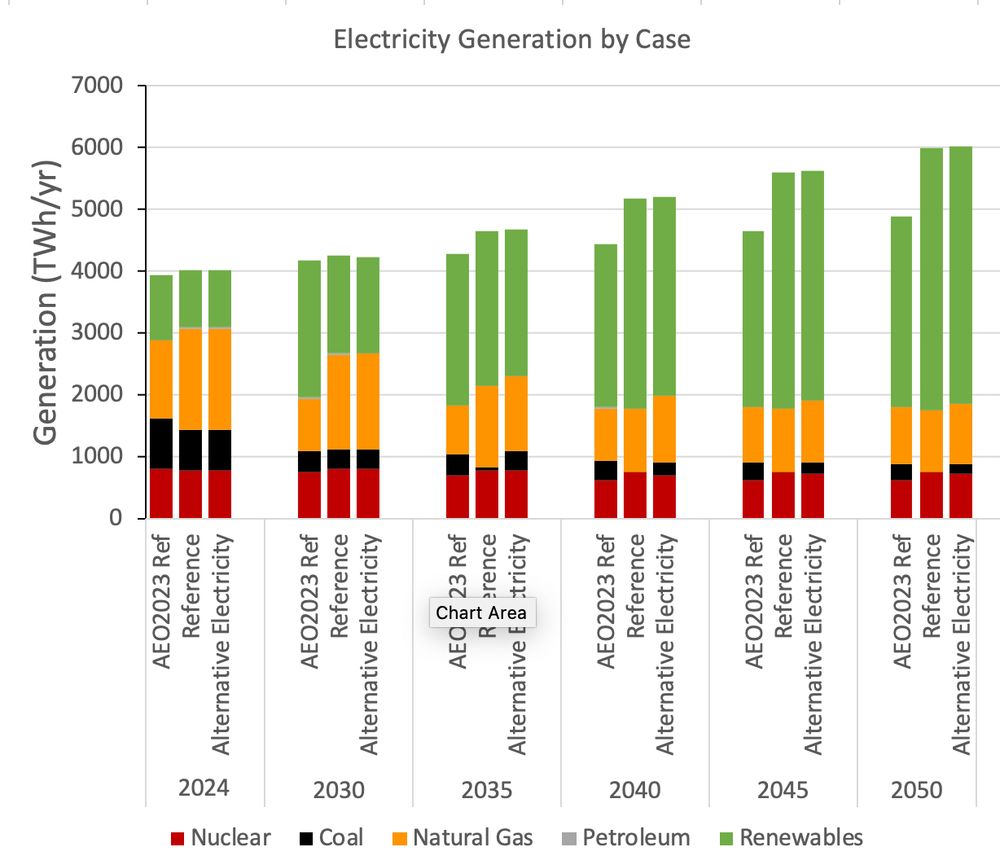
Electricity generation by source from EIA's Annual Energy Outlook 2025
Here’s a view into the electric sector, with the AEO2023 Reference case, current Reference case, and Alternative Electricity case. Note the consistently high renewables generation, between 60-70% across these three cases.
17.04.2025 18:15 — 👍 0 🔁 0 💬 1 📌 0
So as renewable penetration increases and end uses are electrified, all else equal, it decreases the need for thermal-based primary energy sources.
17.04.2025 18:15 — 👍 1 🔁 0 💬 1 📌 0
U.S. Energy Information Administration - EIA - Independent Statistics and AnalysisU.S. Energy Information Administration (EIA) - Pub
EIA changed its primary energy accounting for noncombustible renewables: www.eia.gov/totalenergy/...
In AEO2025, 1 unit of solar or wind electricity = 1 unit of primary energy. So 1 unit of solar or wind displacing 1 unit of fossil electricity reduces fossil primary energy by 2-3 units (2nd Law).
17.04.2025 18:15 — 👍 0 🔁 0 💬 1 📌 0

Total primary energy from EIA's Annual Energy Outlook 2025.
Here's U.S. primary energy consumption. You can see substantial reductions from AEO2023 and through 2040. What’s going on?
Renewables, mostly solar and wind, are an increasing share of the electricity mix. End-use electrification is also increasing. What does that have to do with primary energy?
17.04.2025 18:15 — 👍 0 🔁 0 💬 1 📌 0
The 2050 Reference case emissions are 17% lower in AEO2025 than AEO2023. It’s largely due to the IRA, EPA regulations, and continued cost declines in renewables and batteries. Emissions tend to flat-line around 2040 as IRA credits expire and growing energy demands exert influence.
17.04.2025 18:15 — 👍 0 🔁 0 💬 1 📌 0
Retired resource economist. I was the lead subject matter expert for energy-related CO2 for 20 years with the U.S. Energy Information Administration. Looking forward to communicating with experts on climate-related energy developments.
Emeritus professor University of Washington Foster School. Economist. Competitive sailor.
Research Manager for @cclusa.org, environmental scientist, climate journalist for @climateconnections.bsky.social. Views my own.
Leading market growth for clean energy technologies, by providing technical services, training, policy & research support to industry. Manages the Database of State Incentives for Renewables & Efficiency (DSIRE).
We’re organizing against this fascistic clown show of a regime the only way that actually works — with on-the-ground, volunteer-led, communities of people power: https://linktr.ee/indivisibleteam
Husband and father. Proudly serving as Illinois’ 43rd governor.
it's a website (and a podcast, and a newsletter) about humans and technology, made by four journalists you might already know. like and subscribe: 404media.co
We are an independent, nonprofit successor to Climate(.)gov, safeguarding public access to trusted climate data, tools, and information.
Donate: https://givebutter.com/valentines-day-matching-2026
Thought follower. Public servant. Male software developer. Alumnus of 18F, the Obama White House, Georgetown's Beeck Center, U.S. Digital Response, the Biden-Harris Transition Team, and the Biden administration. He/him. Charlottesville, VA, USA.
Prof of Atmospheric Sciences & climate scientist @ Texas A&M; AGU and AAAS Fellow; Native Texan; find out what I think at https://www.theclimatebrink.com/
Climate change social scientist. Collaborator, determined dreamer, dad. Director, @ClimateSSN.bsky.social And @climatedevlab.bsky.social
www.climatedevlab.brown.edu CSSN.org personal account; reskeets NE endorsement
Professor at ETH Zurich, IPCC WGI Vice-chair.
#Climate #Extremes #Land.
Citizen/mum/scientist. Personal account.
https://www.ipcc.ch/report/ar6/wg1/downloads/report/IPCC_AR6_WGI_Chapter11.pdf
Twitter/X: @SISeneviratne
https://www.iac.ethz.ch/people/sonia
⚡️Tampa Bay's Congresswoman⚡🌴🌤🌅 🇺🇸 People Over Politics! 🇺🇸 former Chair of the Select Committee on the Climate Crisis 🇺🇸 #FL14
NC State University's Department of Civil, Construction, and Environmental Engineering
The LNG nerd on Bluesky
Energy & commodities reporter at Bloomberg News in Singapore. Opinions my own
Interests include natural gas, LNG, oil, power, coal, nuclear, renewables, climate change
Energy and commodities columnist at Bloomberg. Co-author of the 'The World for Sale' http://amzn.to/3t6dVJV Any views expressed are my own. jblas3@bloomberg.net
Independent and non-doctrinal international economics think-tank with a mission to improve economic policy.
www.bruegel.org
senior fellow - energy & climate policy -
@bruegel_org
Scientific Lead - GreenDealUkraїna -
@HZBde
ProPublica Reporter. Books: Smartest Guys in the Room, Client 9, Death Shift. 'Pirate of Prague' podcast. Former Fortune Editor at Large. Repost = Worth reading.