KAIZO IRONMON ELITE FOUR NOWWWWW
www.twitch.tv/dynohack

@jayreau.bsky.social
KAIZO IRONMON ELITE FOUR NOWWWWW
www.twitch.tv/dynohack
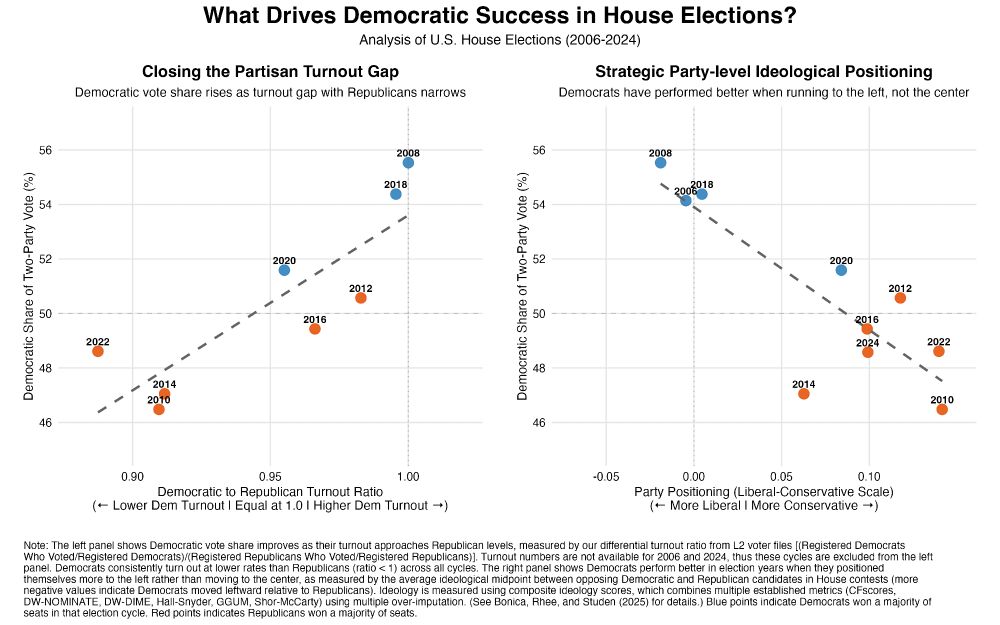
Two-panel graph analyzing U.S. House Elections from 2006-2024. Left panel shows Democratic vote share increases as turnout gap with Republicans narrows, with a positive trend line (46-56% on y-axis). Right panel shows Democratic vote share decreases as party positioning moves from liberal to conservative, with a negative trend line. Election years are plotted as dots, with blue dots (2006, 2008, 2018) indicating Democratic House majorities and red dots indicating Republican majorities. Both graphs demonstrate that Democrats perform better with higher turnout and more liberal positioning.
1/🧵 Following up on our study featured in NYT today, this figure provides a macro-level view:
Dem vote shares rise with turnout parity (left) but fall with party-level ideological moderation (right). This suggests mobilizing base voters > persuading swing voters by moving to the center.
❤️
24.02.2025 05:43 — 👍 2 🔁 0 💬 0 📌 0You’ve got this!!! 💪💪💪
28.12.2024 18:34 — 👍 2 🔁 0 💬 0 📌 0
pace winter 2024 @emerldd.bsky.social @squerkttv.bsky.social @hexspeedruns.bsky.social @jayreau.bsky.social @joicons.bsky.social
16.12.2024 16:42 — 👍 54 🔁 5 💬 7 📌 0You just gotta watch the right pros, hmu for stream recommendations I promise loads of apex pros are cool
25.11.2024 05:04 — 👍 1 🔁 0 💬 0 📌 0go.bsky.app/8VmneC8
18.11.2024 05:29 — 👍 4 🔁 1 💬 0 📌 1