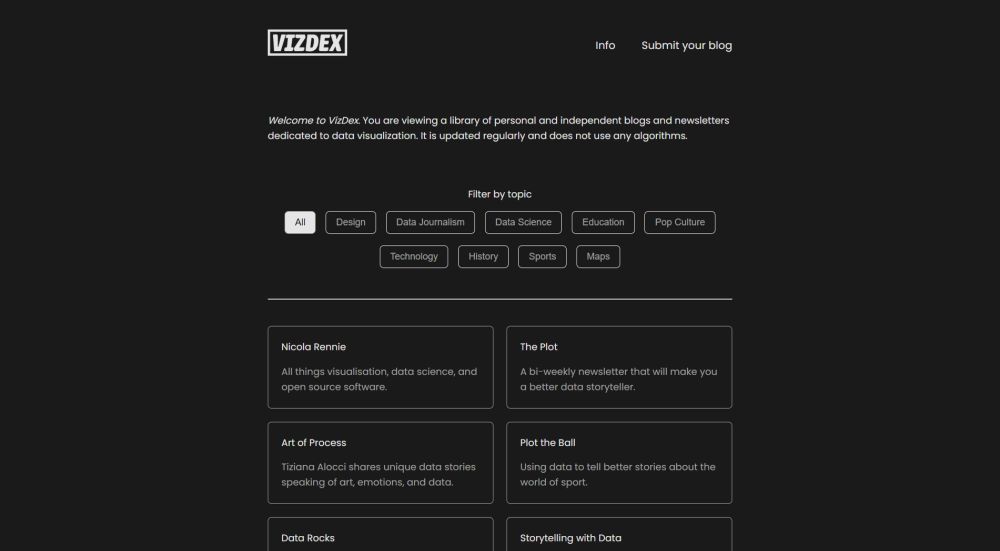
VizDex
A library of personal and independent blogs and newsletters dedicated to data visualization.
Introducing VizDex!
An ever-growing library of personal and independent blogs and newsletters dedicated to data visualization.
vizdexproject.com
20.06.2025 15:31 — 👍 115 🔁 32 💬 9 📌 6

Screenshot showing inputs with data and a graph with Danish exports/imports from USA past 15 years. It keeps growing until 2025 where it drops sharply around January
Was looking for a dataviz tool to make simple graphics for a idea, but didn't feel like the popular ones really fit what I was looking for. So I made my own :)
I kinda forgot the original idea, but this project is also fun.
20.06.2025 19:24 — 👍 1 🔁 0 💬 0 📌 0
I declined an opportunity that could have ended up with a paid trip from eu to a conference in Florida, mostly because I wasn't comfortable travelling there while visibly trans, and that was last year.
I'm not really a conference goer to begin with, but I wouldn't even consider going to Florida now.
15.04.2025 12:08 — 👍 1 🔁 0 💬 0 📌 0
Datavisualization and data-art, one woman studio: illustrating data on social issues, mental health, science, culture.
Born in the 70s, NL (Brabo), 🏳️🌈 mother of 2 teens, macro photographer
📊 Information designer, 👩💻 data engineer, 💊 healthcare analytics consultant, 🐶 dog mom, 🌱 vegan for the animals. Free Palestine 🇵🇸
https://nicolemark.heygrid.co/
President of Signal, Chief Advisor to AI Now Institute
Assoc. Dir., Insights and Analytics at Temple University
Managing Editor of Nightingale, the Journal of the Data Viz Society 📊
https://www.wcareri.com
im tha dawg babey
http://patreon.com/rawdawgcomics
Research and data to make progress against the world’s largest problems. Based out of Oxford University (@ox.ac.uk), founded by @maxroser.bsky.social.
The FT’s team of reporters, statisticians, illustrators, cartographers, designers, and developers work with colleagues across our newsrooms, using graphics and data to find, investigate and explain stories.
https://www.ft.com/visual-and-data-journalism
Interested in all things visual and data, like data visualization. ISOTYPE collector, synth dabbler, runner.
Obsessed with data graphics. Stumbling toward the light. New book INFO WE TRUST https://linktr.ee/infowetrust
Visual journalist and engineer at Axios. Builder of websites, data visualizations, and pixel cats. She/her.
Axios managing editor for data viz, previously at Pew Research
My favorite things are quilts, birds, books and maps
Head of data journalism at The Economist
Columnist and chief data reporter the Financial Times | Stories, stats & scatterplots | john.burn-murdoch@ft.com
📝 ft.com/jbm
Crafting data experiences at http://truth-and-beauty.net
Author: What We Ask Google, May 2026. Data storyteller @Google. Was @Twitter @Guardian. Co-host with Alberto Cairo & Scott Klein of http://datajournalismpodcast.com
The hackathon for cultural heritage
📊 Turning complex data into powerful visual stories!
Author of 'Powerful Charts'. Ex-physicist. He/him 🏳️🌈
🧙♂️✨📊
Independent Data Visualization Designer, Consultant & Instructor | available for projects and workshops
All things data & design with #rstats, #ggplot2, #Figma, #DataWrapper, #Flourish, and more
Co-Founder of the #30DayChartChallenge
A #DataViz challenge 📊 by @cedricscherer.com and @drxeo.eu
Supported by @wendyshijia.bsky.social and @ansgarw.bsky.social
More info on Github: https://github.com/30DayChartChallenge/Edition2024