It definitely helps, but I think it's also simply that most scientists have a LinkedIn account and occasionally check it, whereas still only a minority has a bluesky account.
31.01.2026 19:38 — 👍 0 🔁 0 💬 0 📌 0
Yeah, the amount of engagement on LinkedIn compared to bluesky is crazy. I recently posted about a new paper and it got 480 likes on LinkedIn vs 7 on bluesky (and I have more followers here than there...) :/
31.01.2026 11:00 — 👍 2 🔁 0 💬 1 📌 0
We wrote a review of representation learning methods of single-cell RNA-seq data, where we compare factor models, autoencoders, contrastive learning, and foundation models 🎉
rnajournal.cshlp.org/content/earl...
21.01.2026 09:56 — 👍 7 🔁 2 💬 1 📌 0

Postdoctoral Researcher or Senior Scientist (AI × Biology)
Boeva Lab is #hiring postdocs and senior scientists in AI/ML for Cancer Biology! Check the offer and apply at: jobs.ethz.ch/job/view/JOP...
20.01.2026 14:49 — 👍 8 🔁 8 💬 0 📌 0

View from the hotel room

Poster session 2024, with Valentina Boeva, Constantin Ahlmann-Eltze and others

Wednesday afternoon hike incl. swim in the mountain river

Another view from the hotel room
Apply for the Ascona workshop "Statistical and AI methods for multi-modal multi-scale modeling of biological systems", 28 Jun-3 Jul 2026 on Monte Verità, Lago Maggiore at the foot of the Swiss Alps.
ascona2026.sciencesconf.org
15.01.2026 16:16 — 👍 19 🔁 15 💬 0 📌 1

Save the date: April 9 from 4pm to 6pm CET. Our department is hosting an online seminar with @noeliaferruz.bsky.social @sdomcke.bsky.social @const-ae.bsky.social who will talk about models for protein design, large-scale perturbation screens, and benchmarking of perturbation prediction models.
14.01.2026 13:26 — 👍 6 🔁 3 💬 0 📌 0
Join me in 5.5h, when we discuss our benchmark of perturbation prediction models and what the right metric is to assess if a gene expression prediction is good!
02.12.2025 14:20 — 👍 7 🔁 0 💬 0 📌 0
🚀 Excited to share our new preprint: msBayesImpute - A Versatile Framework for Addressing Missing Values in Biomedical Mass Spectrometry Proteomics Data
👉 Improves imputation accuracy, normalization, and differential expression detection
📝https://www.biorxiv.org/content/10.1101/2025.10.02.679746v1
07.10.2025 08:47 — 👍 16 🔁 2 💬 1 📌 1
Heads up: ignore samtools dot org, similarly minimap2 dot com and likely others. It's owned by a known phishing site and while the binaries they offer look valid currently (but note they may be serving us different binaries to others), that could change.
Ie: it's not us (Samtools team)! Be warned
15.09.2025 08:40 — 👍 146 🔁 127 💬 2 📌 5

We're excited to share that our preprint on anndataR, a new package bringing Python's AnnData to R, is now available on bioRxiv 🎉
🔗 Read the paper: www.biorxiv.org/content/10.1...
💻 Check the package in action: anndatar.data-intuitive.com
25.08.2025 15:24 — 👍 22 🔁 6 💬 1 📌 1

An arrow with a LaTeX equation

Trigonometric functions and a unit circle
A bivariate change model with structured residuals

A hierarchical model of cognitive abilities
Now on CRAN, ggdiagram is a #ggplot2 extension that draws diagrams programmatically in #Rstats. Allows for precise control in how objects, labels, and equations are placed in relation to each other.
wjschne.github.io/ggdiagram/ar...
20.08.2025 10:43 — 👍 180 🔁 73 💬 10 📌 9
Makes sense. I imagine this would simply be my primary use case, and I would prefer not having to refer to `x` twice. Something like:
replace_values <- function(x, ..., from=NULL, to=NULL, lookup=NULL){
if(! is.null(lookup)){
from <- names(lookup)
to <- lookup
}
...
}
10.08.2025 10:22 — 👍 0 🔁 0 💬 1 📌 0
This looks great! I think it would be neat if the functions also supported named look-up vectors in addition to the `to` and `from` arguments :)
10.08.2025 09:58 — 👍 0 🔁 0 💬 1 📌 0
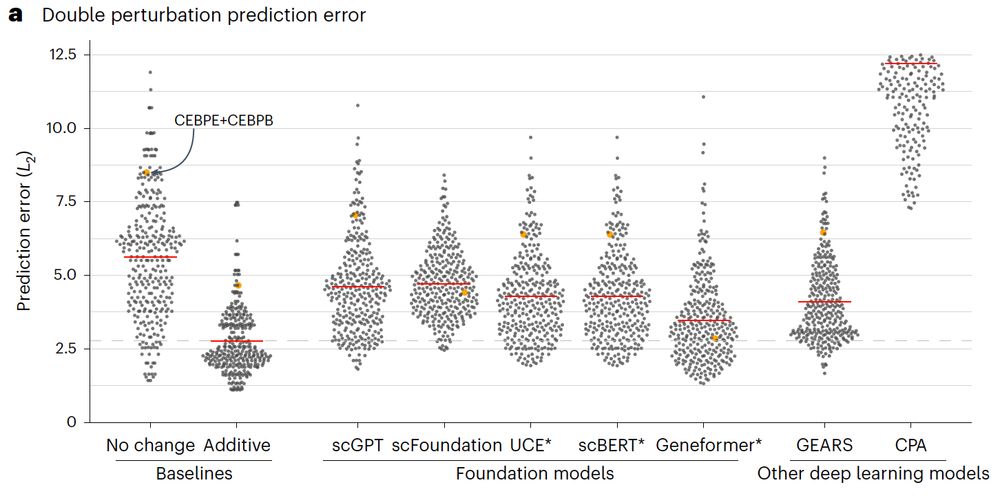
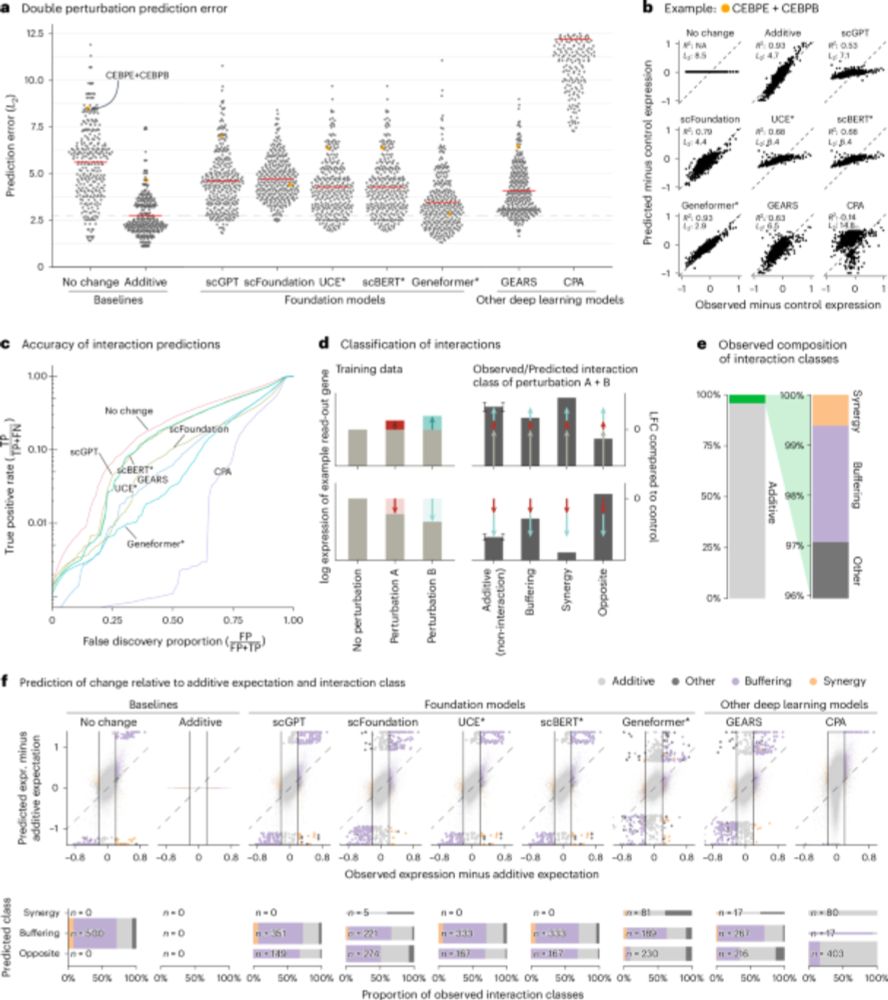
Beeswarm plot of the prediction error across different methods of double perturbations showing that all methods (scGPT, scFoundation, UCE, scBERT, Geneformer, GEARS, and CPA) perform worse than the additive baseline.
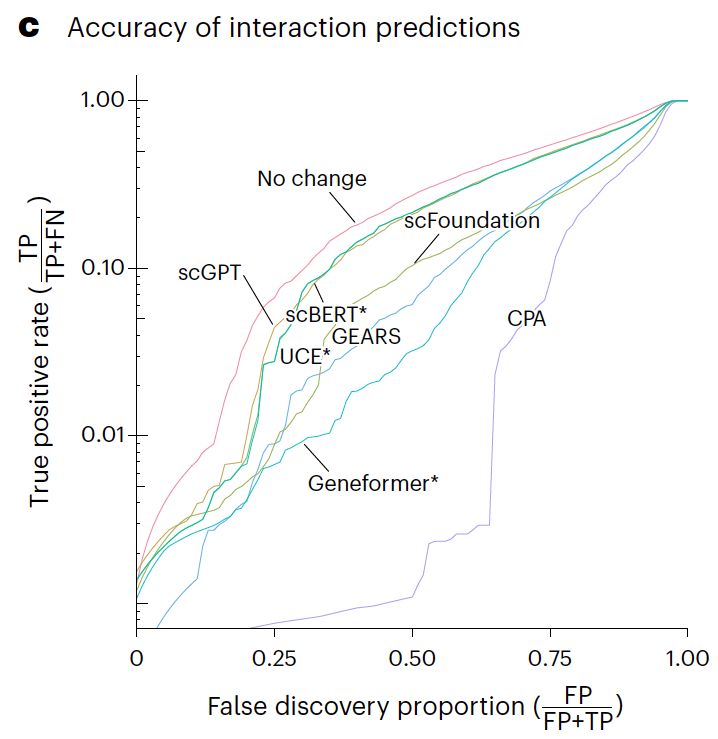
Line plot of the true positive rate against the false discovery proportion showing that none of the methods is better at finding non additive interactions than simply predicting no change.
Our paper benchmarking foundation models for perturbation effect prediction is finally published 🎉🥳🎉
www.nature.com/articles/s41...
We show that none of the available* models outperform simple linear baselines. Since the original preprint, we added more methods, metrics, and prettier figures!
🧵
04.08.2025 13:52 — 👍 125 🔁 57 💬 2 📌 6
Pre-Cancer Immunology
The Pre-Cancer Immunology Lab (James Reading Lab) is mapping pre-invasive T cell dynamics during carcinogenesis to detect and intercept cancer development.
🚨 PhD Position available in our lab 🚨 exploring the power of blood immune multi-omics to detect lung cancer years prior to clinical diagnosis in a unique cohort of >10,000 CT screened individuals.
✅ Wet & dry lab
✅ September 2025 enrolment
✅ UK tuition fees only
www.ucl.ac.uk/medical-scie...
05.08.2025 17:57 — 👍 16 🔁 15 💬 0 📌 0
I wrote about AI foundation models for biology last year: www.nytimes.com/2024/03/10/s... Benchmarking tests since then aren't finding that they're better than simpler models of how genes and cells work.
04.08.2025 16:45 — 👍 38 🔁 13 💬 1 📌 0
Haha, would also be a succinct summary of most of my academic work 😅
04.08.2025 15:38 — 👍 4 🔁 0 💬 1 📌 0
- Li et al. doi.org/10.1101/2024.12.23.630036
- Chen Li et al. doi.org/10.1101/2024.12.20.629581
- Wong et al. doi.org/10.1093/bioinformatics/btaf317
And probably many more that I am missing here.
04.08.2025 13:52 — 👍 10 🔁 0 💬 1 📌 0
- @kasparmartens.bsky.social et al. openreview.net/forum?id=eb3ndUlkt4
- Gaudelet et al. doi.org/10.48550/arXiv.2404.16907
- @aaronwtr.bsky.social et al. openreview.net/forum?id=t04D9bkKUq
- Bendidi et al. doi.org/10.48550/arXiv.2410.13956
- Wu et al. doi.org/10.48550/arXiv.2408.10609
04.08.2025 13:52 — 👍 9 🔁 0 💬 1 📌 0
I also encourage everyone to checkout the parallel efforts by groups around the world who came to similar conclusions:
- @ekernf01.bsky.social et al. doi.org/10.1101/2023.07.28.551039
- Csendes et al. doi.org/10.1186/s12864-025-11600-2
- @kasia.codes et al. doi.org/10.1186/s13059-025-03574-x
04.08.2025 13:52 — 👍 13 🔁 0 💬 1 📌 0
A recap of virtual cell releases circa June 2025
In October 2024, I twote that “something is deeply wrong” with what we now call virtual cell models. A lot has happened since then: modelers are advancing new architectures and mining new sources of i...
*We benchmarked scGPT, scFoundation, GEARS, CPA (which claim predictive ability), and scBERT, Geneformer, and UCE (which do not claim this ability). I can't comment on methods released in the last 5 months. For a summary of recent developments, see @ekernf01.bsky.social's post
04.08.2025 13:52 — 👍 9 🔁 0 💬 1 📌 0
Beeswarm plot of the prediction error across different methods of double perturbations showing that all methods (scGPT, scFoundation, UCE, scBERT, Geneformer, GEARS, and CPA) perform worse than the additive baseline.
Line plot of the true positive rate against the false discovery proportion showing that none of the methods is better at finding non additive interactions than simply predicting no change.
Our paper benchmarking foundation models for perturbation effect prediction is finally published 🎉🥳🎉
www.nature.com/articles/s41...
We show that none of the available* models outperform simple linear baselines. Since the original preprint, we added more methods, metrics, and prettier figures!
🧵
04.08.2025 13:52 — 👍 125 🔁 57 💬 2 📌 6
That's amazing. Congratulations 🎉
03.07.2025 08:23 — 👍 1 🔁 0 💬 1 📌 0
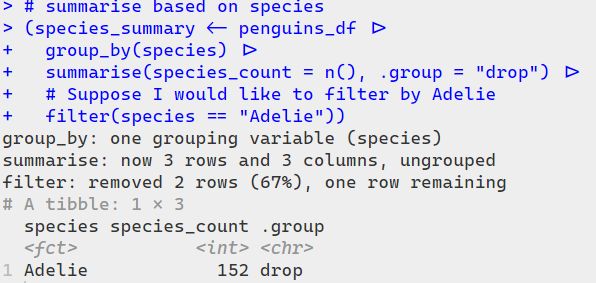
With {tidylog}, you see friendly messages like:
summarise: now 3 rows and 3 columns, ungrouped
filter: removed 2 rows (67%), one row remaining
With {tidylog}, you see friendly messages like:
summarise: now 3 rows and 3 columns, ungrouped
filter: removed 2 rows (67%), one row remaining
✨ It’s like having a gentle co-pilot, helping you track what each step is doing — super useful for debugging and learning!
08.05.2025 13:28 — 👍 23 🔁 8 💬 2 📌 0
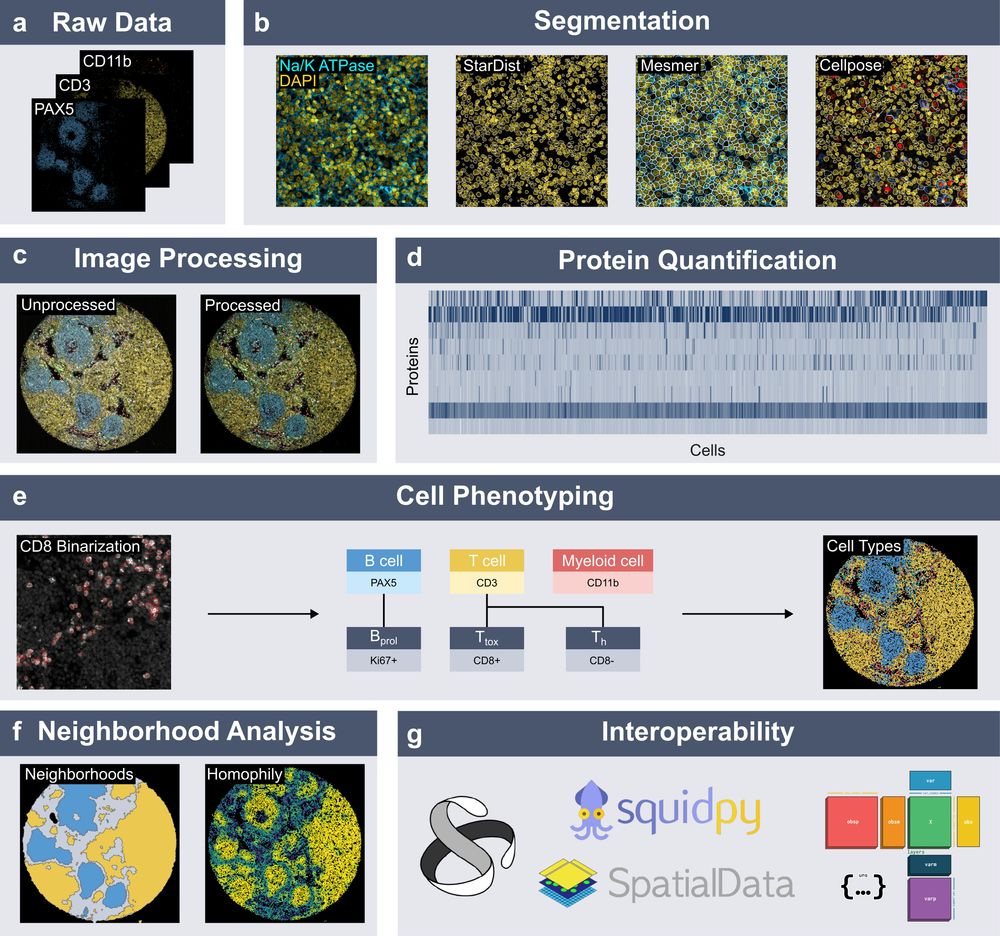
Spatialproteomics orchestrates workflows to analyze highly multiplexed images. It segments cells, processes images, quantifies proteins, predicts cell types, and provides neighborhood analysis methods, all while integrating into the scverse ecosystem.
New preprint out!
We introduce 𝐬𝐩𝐚𝐭𝐢𝐚𝐥𝐩𝐫𝐨𝐭𝐞𝐨𝐦𝐢𝐜𝐬, a Python package for end-to-end processing and analysis of highly multiplexed immunofluorescence imaging data.
Built on xarray and dask, with seamless integration into the scverse ecosystem.
www.biorxiv.org/content/10.1...
05.05.2025 11:30 — 👍 12 🔁 1 💬 1 📌 0
(2/3)
Constantin Ahlmann-Eltze showcased impressive work on assembling an atlas of T cells in precancerous samples. They developed the R packages treelabel and Shinytreelabel, which showed GITR+ Tregs are enriched in several precancerous samples, suggesting avenues for future treatments
10.04.2025 11:43 — 👍 2 🔁 1 💬 0 📌 0
A markets and finance blog that's outside the FT paywall. All we ask is that you register to read: https://on.ft.com/3tDRiiu
Postdoctoral Fellow at Marioni Lab, Genentech | Aging & bioinformatics
Born in Portugal 🇵🇹 living in California 🐻
Associate Member in csBio at Memorial Sloan Kettering. Perturb-seq, single-cell functional genomics, and techniques for perturbing the genome.
he/him
Director of Curriculum at The Carpentries. Views my own. Sorry I haven't replied to your email.
"I only know that hearts made of stone will rarely sail far and may never reach home" - Chuck Ragan
News from Dr. Alex Marson's lab UCSF & Gladstone Institutes, focusing on advances in immunology, CRISPR & genomics.
Asimov Press is a publisher focused on the science and technologies that promote flourishing.
Pitch: editors@asimov.com // Part of Asimov. Supported by Astera Institute and Stripe.
Transcription factors, gene regulation, single cell, perturbations. Science, mountain and wilderness enthusiast. Assistant Professor @ University of Zurich
Applying statistics to biomedicine.
ORCID: https://orcid.org/0000-0001-8802-3642
Assistant Professor @StanfordBioethx #sociogenomics #adversarialcollab; @Cambridge_Uni PhD; Retired @CUBCsquad President; 🐈 Mom to #Sassy; Yogi in training
daphnemartschenko.com
Climate data scientist @metoffice specialising in generating interactive websites and bespoke #dataviz. #climate #maps #GIS #mapping #Rstats
Views are my own
Product lead Genomics Google Research
Researcher at Tübingen University. Manifold learning, contrastive learning, scRNAseq data. Excess mortality. Born but to die and reas'ning but to err.
Journalist, lawyer, hobby swimmer (she/her). Deutschlandfunk anchor (Infos am Morgen). Podcast-Host (DLF Der Tag). No bullshitting. Kritik an Beiträgen/Interviews im DLF bitte an den DLF. Foto: Bernd Arnold
R advocate #rstats | PhD @CHUVLausanne @unil | Immunology, Immunotherapy, Single-Cell RNAseq, Spatial Transcriptomics, Statistics and Machine Learning. 📷⛸️🏔️
PhD student at Boeva Lab, @ETH_en | Mostly working on ML applied to cancer research | Previously @DKFZ, DKRZ, HKU and university of Tübingen
European economics editor @TheEconomist. London via Berlin, Stockholm and Cologne. Have no plans to write a book.
Excited to engineer a synthetic cell from scratch with lipid vesicles and DNA/RNA origami-based molecular hardware. Professor @ZMBHh @UniHeidelberg