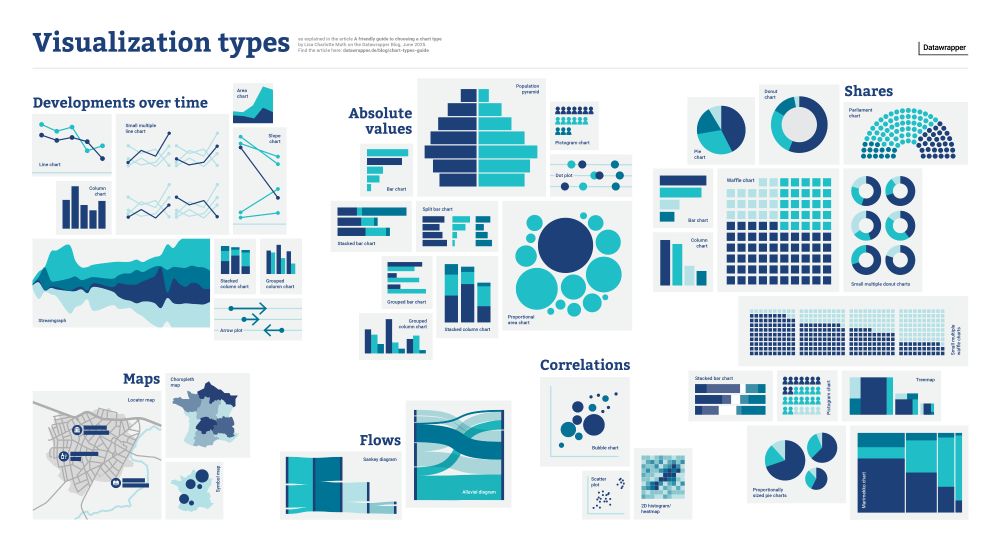
A poster showing icons for 40 different visualization types, categorized by goal – e.g. "showing shares" or "showing flows" or "showing developments over time".
📊 There are *so* many chart types out there. Which one should you use for what kind of data and goal?
I tried to answer the question in a new blog post (and poster!): www.datawrapper.de/blog/chart-t...
16.06.2025 19:14 — 👍 108 🔁 34 💬 2 📌 3
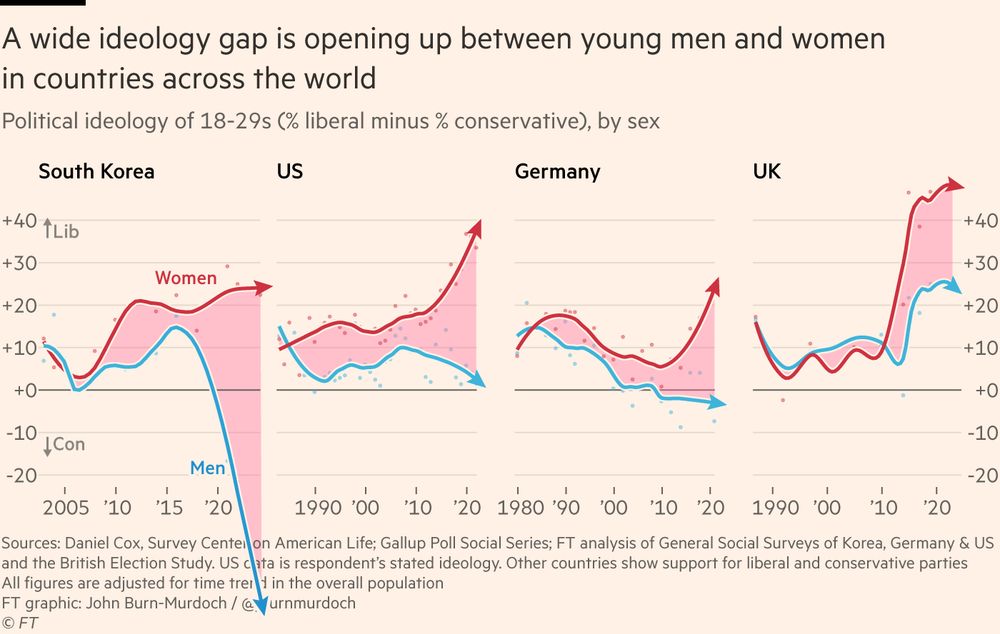
South Korea gender divide update 😲
Young men lean right by 50 points
(74% conservative vs 24% centre-left)
Young women lean left by 22 points
(58% centre-left vs 36% cons)
04.06.2025 10:01 — 👍 1130 🔁 372 💬 51 📌 182
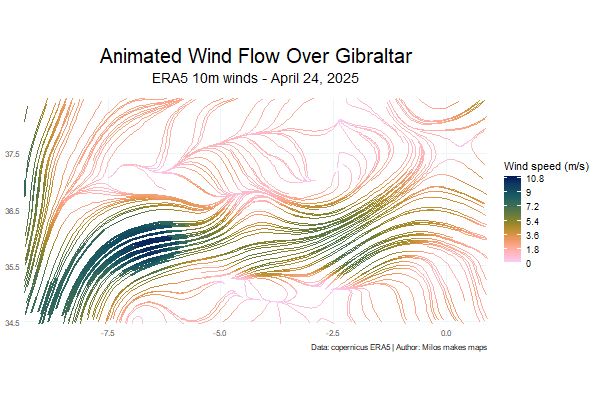
This tutorial will level up your skills and show you how to build animated wind maps from scratch.
Watch it here: https://lnkd.in/e_8QaFn6
And if you’re ready to go deeper into the world of spatial data, check out my new book:
Mapping Worlds with R: Your Journey from Beginner to Data Cartographer
It’s packed with real projects, full code, and clear explanations for every step of the map-making process.
Grab the book: https://payhip.com/b/MH9Ot
Let’s catch the breeze, beautifully, in R.
#rstats #GIS #DataVisualization #ClimateData #ERA5 #gganimate #WindMapping #Geospatial #EnvironmentalScience #OpenData #MilosMakesMaps #MappingWithR
Want to turn raw wind data into a mesmerizing, animated map?
With R, it’s easier than you think.
My new tutorial shows you how, step by step.
Let’s catch the breeze. ⤵️
youtu.be/EmVbVTqwoMU
#GIS #DataViz #gganimate #metR #WindMap #ClimateData #SpatialAnalysis #MilosMakesMaps
25.05.2025 12:38 — 👍 108 🔁 16 💬 2 📌 2
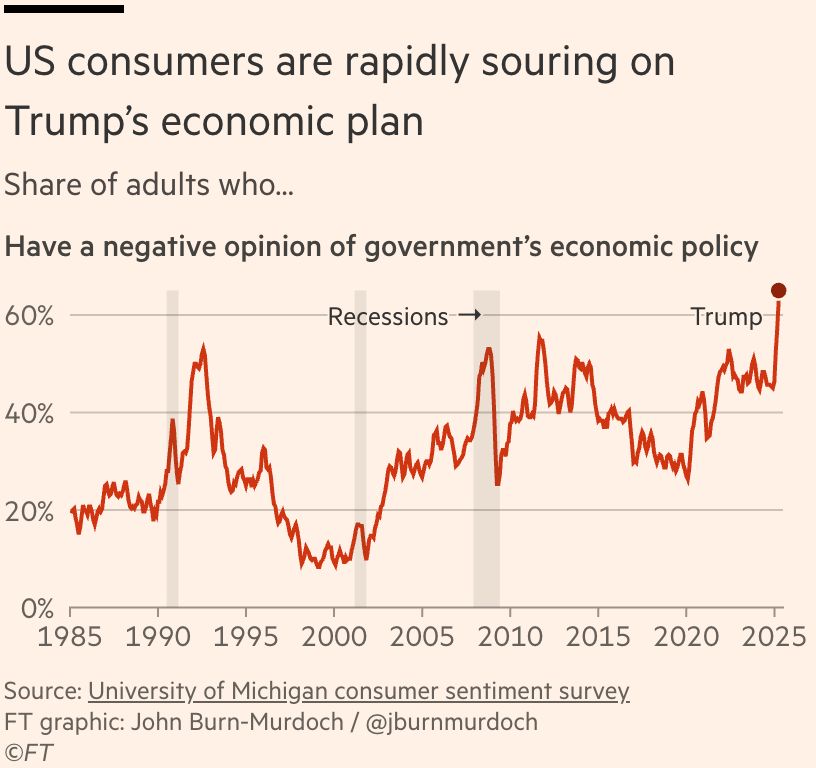
NEW 🧵
A quick thread of charts showing how Trump’s economic agenda is going so far:
1) US consumers are reacting very very negatively.
These are the worst ratings for any US government’s economic policy since records began.
04.04.2025 12:51 — 👍 3576 🔁 1512 💬 90 📌 256

A floating swarm of bird-feathers, colored by conservation status from extinct (red) to least concern (blue). About a third of the species is on the scale from extinct to near threatened. Published on Bluesky by Dax Kellie, created by Andrea Garrec.

A set of radar charts showing drug residues in wastewater for different substances from Monday to Sunday. The visualization allows filtering for different European cities. In Krakow, Poland, ecstasy and cocaine peak over the weekend, while substances such as cannabis are more stable. Published by Gazeta Wyborcza.

A choropleth map of the world showing global happiness levels based on survey data. A color gradient from purple to orange marks the least happy and happiest countries. Europe and the North American continent are the most happy, with Finland being the happiest. Africa is the least happy continent. Published by the Visual Capitalist.

A collection of scanned japanese paper chopstick sleeves, with unique colorful prints and typography. From the archive of Susumu Kitagawa, published on Letterform Archive with context by designer Angie Wang, cited by FlowingData.
The Data Vis Dispatch is out! Learn about what chopstick sleeves can look like and which drugs people take in your hometown.
🥢 www.datawrapper.de/blog/data-vi...
Thanks to all that have taken our Dispatch reader survey already! 🎉 In case you haven't yet, find it here: dw.link/dispatch-sur...
25.03.2025 16:05 — 👍 9 🔁 3 💬 0 📌 0

screenshot that shows site for how to run llm on local device
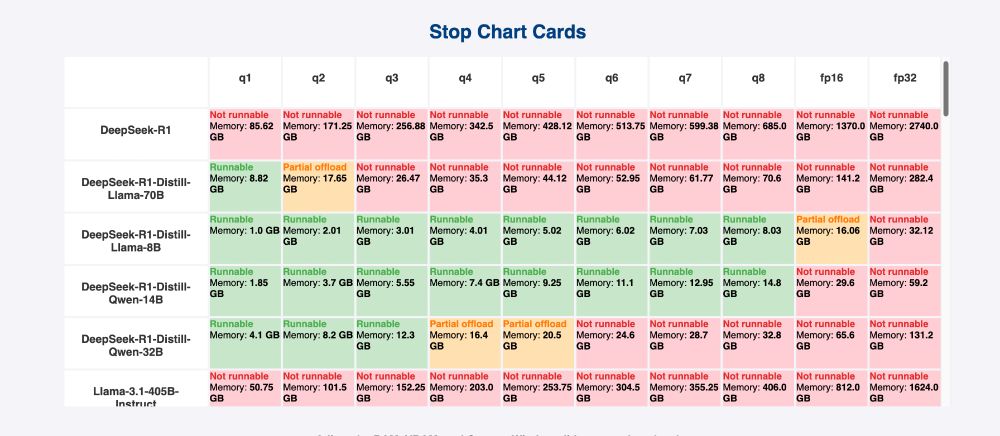
screenshot that show which models were compatible with given specs
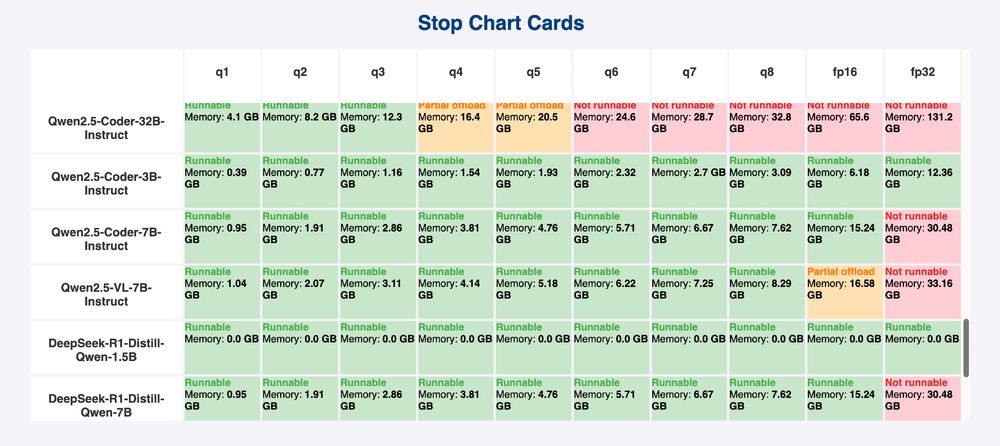
screenshot that show which models were compatible with given specs
There is a fantsastic site called canirunthisllm.net It simply answers the question of which large language models your hardware can run. Just put your device specs, and voilà!
#artificialintelligence #llm #AI
11.03.2025 15:49 — 👍 0 🔁 0 💬 0 📌 0

hexagonal tile of 12 package or software logos
more friends joining the #rstats + LLM toolkit this week
* Retrieval-Augmented Generation in R w/ {ragnar}
* {tidyllm}, a pipe-friendly interface for multiple models
* LLM powered computer vision w/ {kuzco}
Summary here:
luisdva.github.io/rstats/LLMsR/
28.01.2025 23:46 — 👍 37 🔁 8 💬 3 📌 1
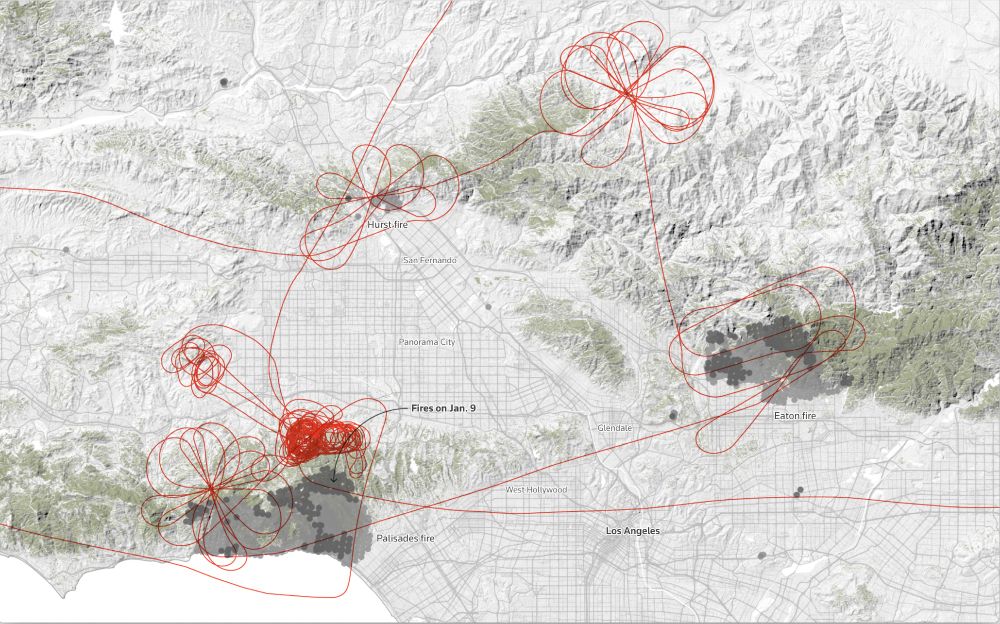
Map of flight paths around the Los Angeles fires. Flight paths are indicated by red lines, roads by gray lines, forested areas with muted green, and active fires with dark gray dots. The map is accented by hill shading.
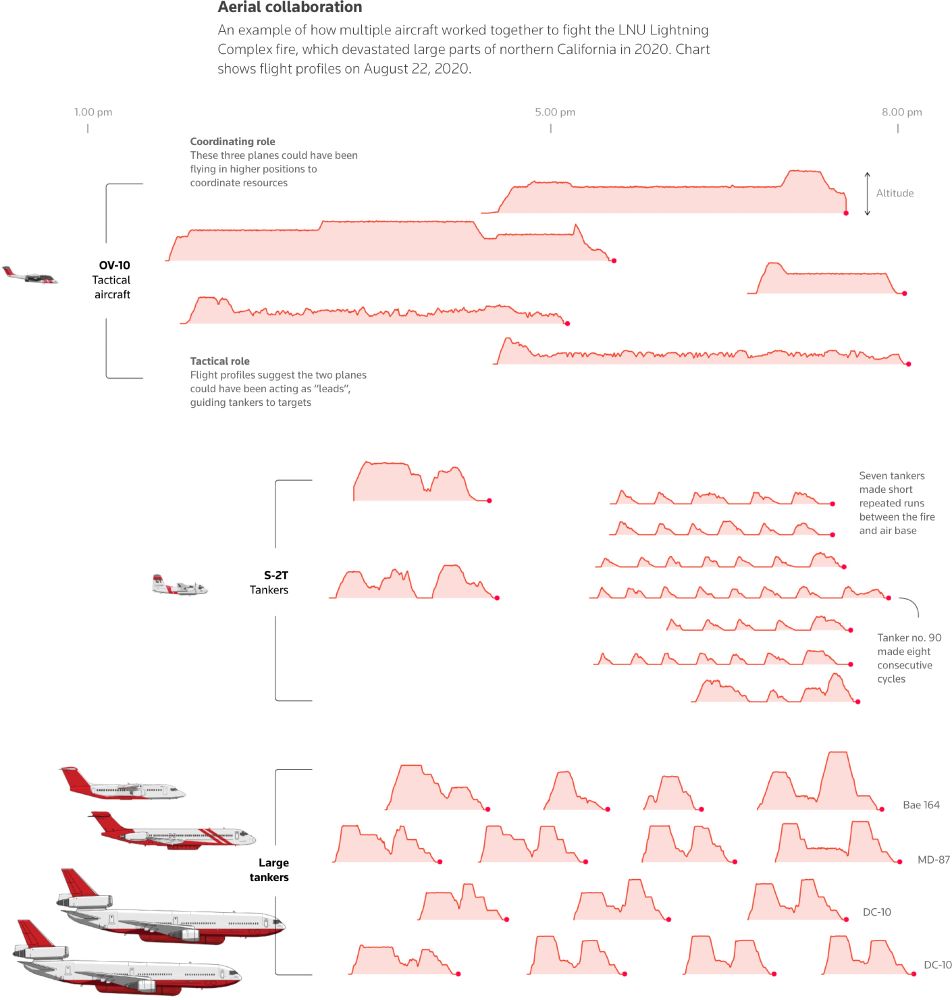
Annotated graphs of altitude and flight times for observation aircraft and tankers, showing coordination of the fleet.
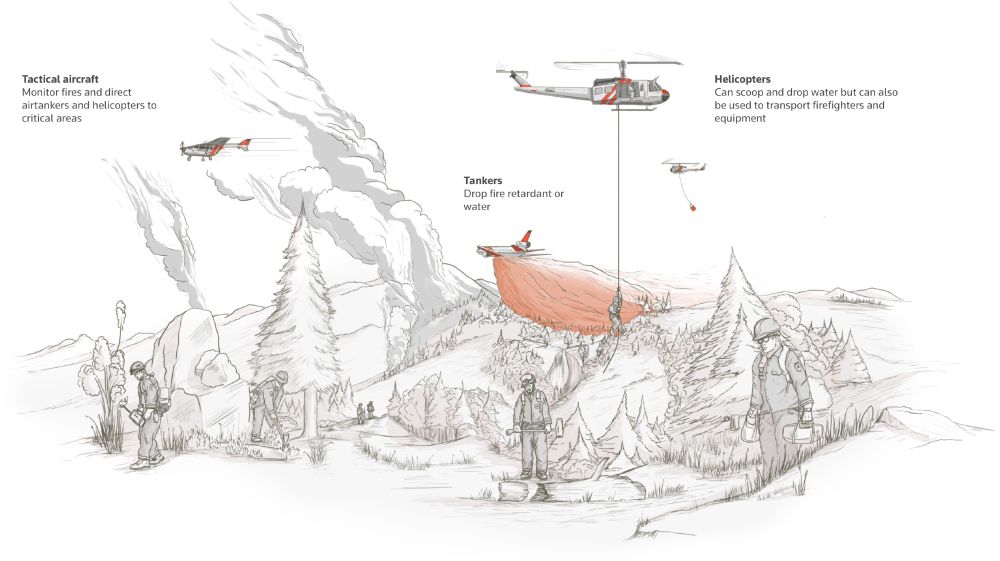
Hand-drawn illustration showing how helicopters and aircraft are used to dump water and flame retardant to help fight wildfires.
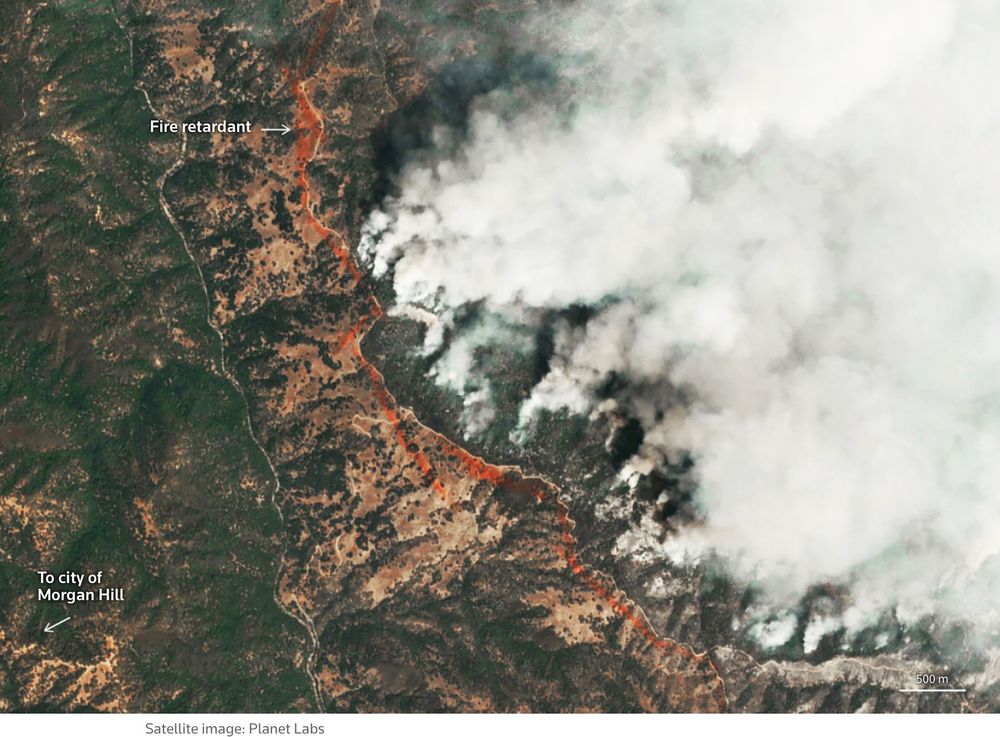
High-resolution color satellite image showing red flame retardant laid in front of an advancing fire with copious smoke.
The graphics in this @reuters.com article on air tankers battling the fires in LA are astonishingly good.
www.reuters.com/graphics/CAL...
via @interactives.bsky.social
10.01.2025 18:38 — 👍 64 🔁 20 💬 3 📌 2

R code to post on Bluesky platform
And this easy to post on @bsky.app. Amazing! of course there is more here: jbgruber.github.io/atrrr/articl...
02.12.2024 19:18 — 👍 0 🔁 0 💬 0 📌 0

Wrapper for the AT Protocol Behind Bluesky
Wraps the AT Protocol (Authenticated Transfer Protocol) behind Bluesky <https://bsky.social>. Functions can be used for, among others, retrieving posts and followers from the network or posting conten...
Hey #rstats folks, I just started using the atrrr package to interact with #Bluesky. In fact I am sending this post via R and atrrr package and I am loving this R package. Shout out to @jbgruber.bsky.social and the team for creating such a good R package https://jbgruber.github.io/atrrr/index.html
02.12.2024 17:03 — 👍 11 🔁 4 💬 1 📌 0
Getting started with elmer
If you're interested in trying out LLMs in #rstats but don't know where to begin, I've added a few two vignettes to elmer: elmer.tidyverse.org/articles/elm... and elmer.tidyverse.org/articles/pro...
29.11.2024 15:45 — 👍 265 🔁 64 💬 10 📌 1
Traffic from Bluesky's @bsky.app to @theguardian.com is already 2x that of Threads
In its first week on the platform & with 300k followers, Bluesky traffic from @theguardian.com posts is already higher than it was from TwX in any week in 2024, where the account had 10.8m followers, but🧵
27.11.2024 06:30 — 👍 11190 🔁 1957 💬 171 📌 352

Our World in Data
Research and data to make progress against the world’s largest problems
8. You may look for #wikipedia like source with more data and charts. Our World in Data: ourworldindata.org
26.11.2024 18:02 — 👍 0 🔁 0 💬 0 📌 0

WTF Visualizations
Visualizations that make no sense. For a discussion of what is wrong with a particular...
7. You may also want where the worst example of #dataviz practice. WTF visualization blog helps a lot: viz.wtf
26.11.2024 18:02 — 👍 0 🔁 0 💬 1 📌 0

dataviz.tools
a curated guide to the best tools, resources and technologies for data visualization
Looking for curated list of #dataviz tools, guides and learning materials. Here some:
1. Dataviz Tools dataviz.tools
26.11.2024 18:02 — 👍 0 🔁 0 💬 1 📌 0

Veri Bülteni | Veri Okuryazarlığı Derneği | Substack
Veri Bülteni ile Türkiye’de ve dünyada veri okuryazarlığı, veri gazeteciliği, açık veri, veri görselleştirme ve ilişkili alanlarda dikkat çeken gelişmeleri derliyor ve paylaşıyoruz. Click to read Veri...
Hello World!
Veri Okuryazarlığı Derneği olarak BlueSky'da da varız :) Faaliyetlerimiz hakkında bilgi almak için voyd.org.tr ziyaret edebilir, her ay çıkardığımız veri bültenimize göz atabilirsiniz. voydorg.substack.com #datajournalism #verigazeteciligi #verigörselleştirme #açıkveri
18.11.2024 15:38 — 👍 2 🔁 2 💬 0 📌 0
I created a #datajournalism feed. It lists posts with #datajournalism, #ddj hashtags or just a phrase of "data journalism". Feel free to like and follow :)
bsky.app/profile/did:...
18.11.2024 15:08 — 👍 0 🔁 0 💬 0 📌 0
Hi all! A (re)-introduction: I'm Tyler, developer of #rayshader and the #rayverse, a collection of R packages for 3D #dataviz and #mapping.
Here's one of my greatest hits (now that Bluesky supports videos!): The Earth's submarine fiber optic cable network, visualized in #RStats with #rayrender.
08.11.2024 20:06 — 👍 237 🔁 37 💬 10 📌 4
If you're curious why everybody's username is a domain, it's because every user is essentially a website
20.10.2024 21:20 — 👍 19025 🔁 2628 💬 478 📌 708

Call LLM APIs from R
A consistent interface for calling LLM APIs. Includes support for streaming.
I've been using S7 in elmer (elmer.tidyverse.org) and it's been a lot of fun. Takes a little bit of getting used to (mainly unlearning old S3 habits) but it's evolving rapidly and the rough edges are quickly getting smoothed down.
07.11.2024 14:03 — 👍 24 🔁 7 💬 0 📌 0

To Best Serve Students, Schools Shouldn’t Try to Block Generative AI,
Generative AI gained widespread attention earlier this year, but one group has had to reckon with it more quickly than most: educators. Teachers and school administrators have struggled with two big
Tools such as GPTZero and TurnItIn’s AI detection claim that they can determine (with varying levels of accuracy) whether a student’s writing was likely to have been created by a generative AI tool. But these tools are so inaccurate as to be dangerous.
16.11.2023 20:22 — 👍 26 🔁 11 💬 1 📌 1
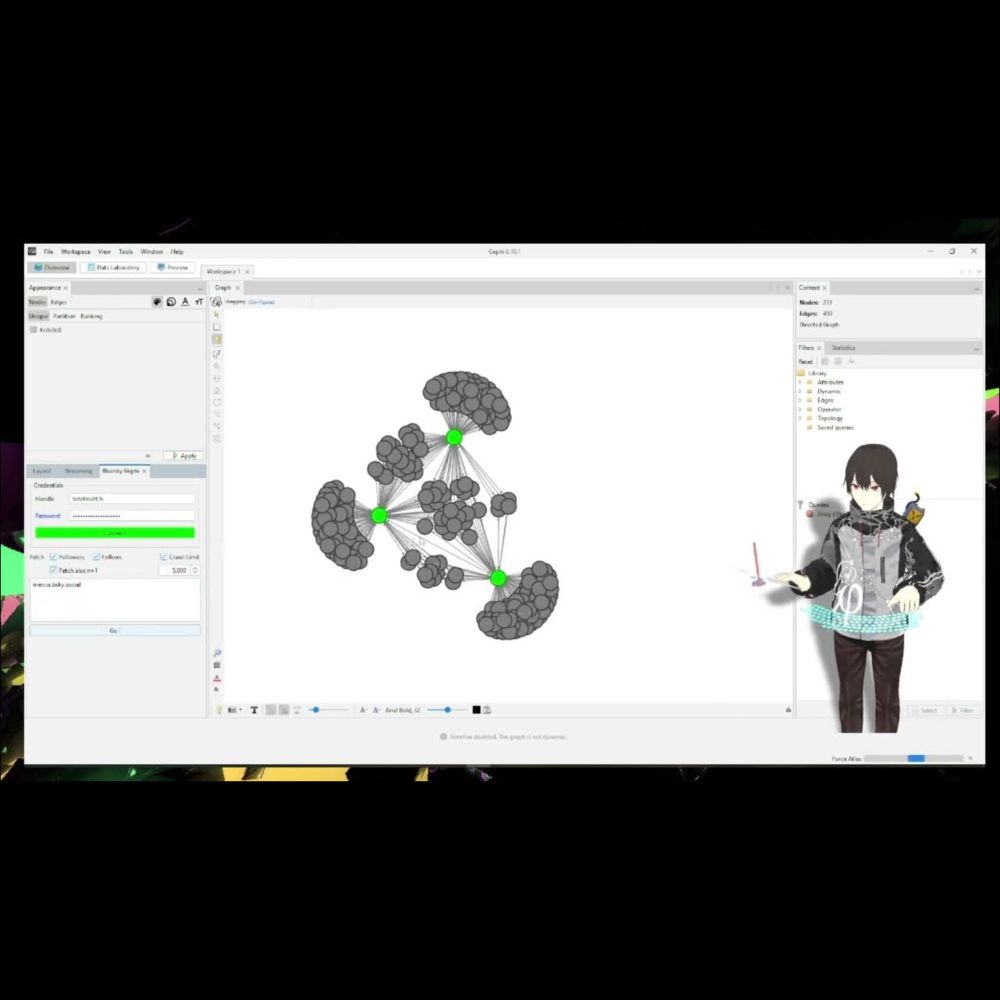
Bluesky Gephi plugin Fast Tutorial
So the Bluesky #Gephi plugin is released ! You can fetch it directly from the plugin manager inside the software. It allows you to explore the followers / followings relationships of the network. Here is a Fast Tutorial www.youtube.com/watch?v=EUq5... #graph #sna #atproto
16.11.2023 07:22 — 👍 15 🔁 5 💬 0 📌 1
Associate Professor of Data Science & asst. Dean of Research at UVA School of Data Science, #Rstats enthusiast, dad, runner, guitar noise-maker. Views my own.
Web: https://stephenturner.us/
Newsletter: https://blog.stephenturner.us
I help @posit.co deliver the best R and Python data science solutions to the public sector in the US and elsewhere. Fan of cats coffee whiskey tea photography philosophy Atlanta - personal account. https://18chains.com/
Assistant professor at Georgia State University, formerly at BYU. 6 kids. Study NGOs, human rights, #PublicPolicy, #Nonprofits, #Dataviz, #CausalInference.
#rstats forever.
andrewheiss.com
Signal: andrewheiss.01
Visualisation and graphics @posit.co
Classic Generative Art Weirdo using 🖤 and R: http://thomaslinpedersen.art and http://deca.art/thomasp85
he/him
Designer, journalist, and professor.
Author of 'The Art of Insight' (2023) 'How Charts Lie' (2019), 'The Truthful Art' (2016), and 'The Functional Art' (2012). NEW PROJECT: https://openvisualizationacademy.org/
former 🥑 dev advocate @rstudio, 🏀 hoop head, data-viz lover, gnashgab, blatherskite, #rstats, doggos, and horses
Solopreneur @ IndieVisual
Data geek who loves problem solving
Rambles about fitness & random stuff too
https://indievisual.tech
software engineer | #rstats | PDX | she/her
Code, Data, Analysis, Teaching, Running, Breadmaking ... https://dirk.eddelbuettel.com
"God doesn't know, and the devil isn't telling." xkcd.com/2867/
Product Manager @posit.co👨💻
I ❤️ 🌮, dogs, and data science IDEs
Productive with open source #RStats and #PyData
@thomas_mock@fosstodon.org + @thomas_mock
He/Him | San Antonio, TX
TheMockup.blog
Professor of Statistics and Data Sciences UT Austin | Prev JHUBiostat | R Programming for Data Science | Simply Stats Blog | Not So Standard Deviations | The Effort Report
Software engineer @posit.co, humane #rstats
Current: Data Science & AI Manager (retail). Former: ML Engineer, Data Scientist, Professor. Responsible AI/ML.
Computational disease ecologist. Executive Director of @ropensci.org. Co-founder of https://grant-witness.us/. Brooklynite. One Health, open science, #RStats, cities, civics, bikes, fun, love, progress + justice. he/him
Principal Engineer at Posit (fka RStudio), technical lead at quarto.org
Learning Brazilian Choro and the 7-string guitar
Human geneticist 🧬, bioinformagician 🧙🏻♂️, choral musician 🎼, and unrepentant city slicker 🏙️. Amplifying interesting signals (like #ScienceWin)! [he/him]
https://orcid.org/0000-0003-3466-1846
Our mission: To provide tools and resources to foster a diverse, friendly, and inclusive community of data science learners and practitioners. Join us at https://dslc.io
tada⬢science ⬡⬡ ex(Posit/RStudio, ThinkR, Mango Solutions) ⬡⬡ role(Data Scientist, Software Engineer, R Expert) ⬡⬡
Writing modeling packages at @posit.co (née RStudio). Opinions are my own. https://max-kuhn.org/
Research Data Management Consultant | cghlewis.com
Co-organizer @r-ladies-stl.bsky.social
Co-organizer POWER Data Management Hub | https://osf.io/ap3tk/
Author of DMLSER: https://datamgmtinedresearch.com/
RDM Weekly: https://rdmweekly.substack.com/