Insightful 👏
03.05.2025 08:38 — 👍 3 🔁 0 💬 0 📌 0
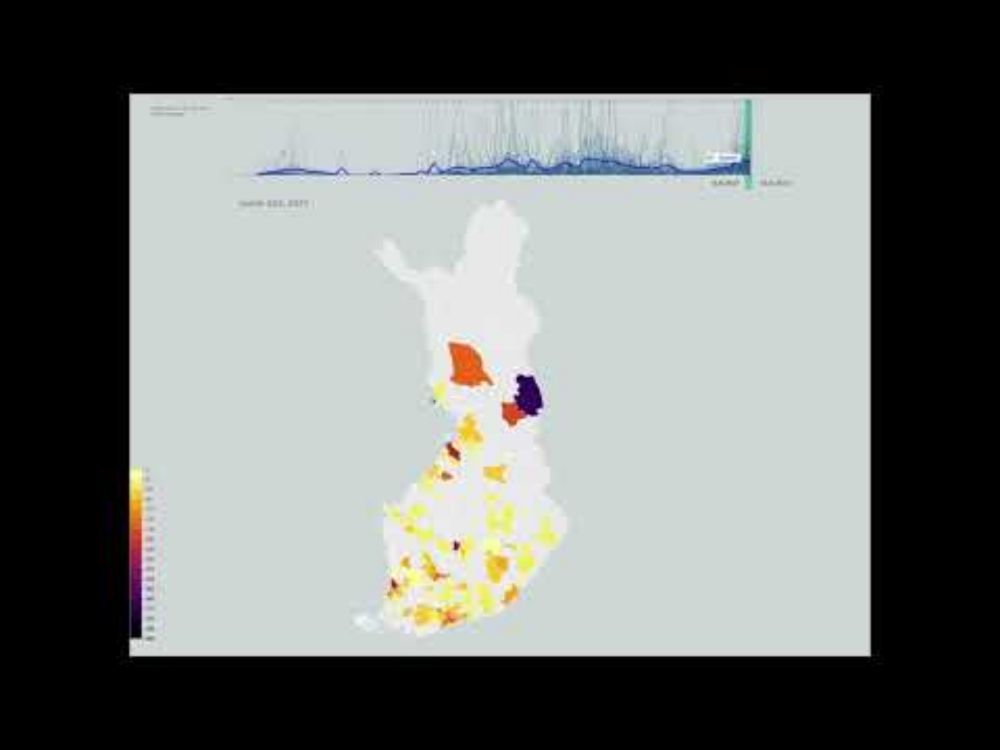
YouTube video by miska knapek
miska knapek - demo reel 2024
- feel welcome to share -
I'm looking for long and short term #datascience #datavis #frontent work.
I am best at making web based interactive data analysis tools, but also do backend, data science, APIs, UX, and frontend development.
Find my portfolio here: miskaknapek.eu
02.05.2025 08:30 — 👍 56 🔁 23 💬 3 📌 2
But while Adobe suspended their services in Belarus Figma is a good choice. Need more practice to be comfort with it, but it is fine for my needs so far.
Hovewer, some features I just could not find even in plugins: predictable shape distortion, text on path (?!)
02.05.2025 08:33 — 👍 0 🔁 0 💬 0 📌 0
Trite, it's gravely depends of your workflow.
I miss some Illustrator options like smart guides, flexible character and paragraph settings, objects transformation and distribution options, shape editing filters and effects, brushes and patterns, usual hotkeys and UI overall.
02.05.2025 08:33 — 👍 1 🔁 0 💬 1 📌 0
Well, I've done my best
02.05.2025 08:05 — 👍 0 🔁 0 💬 0 📌 0
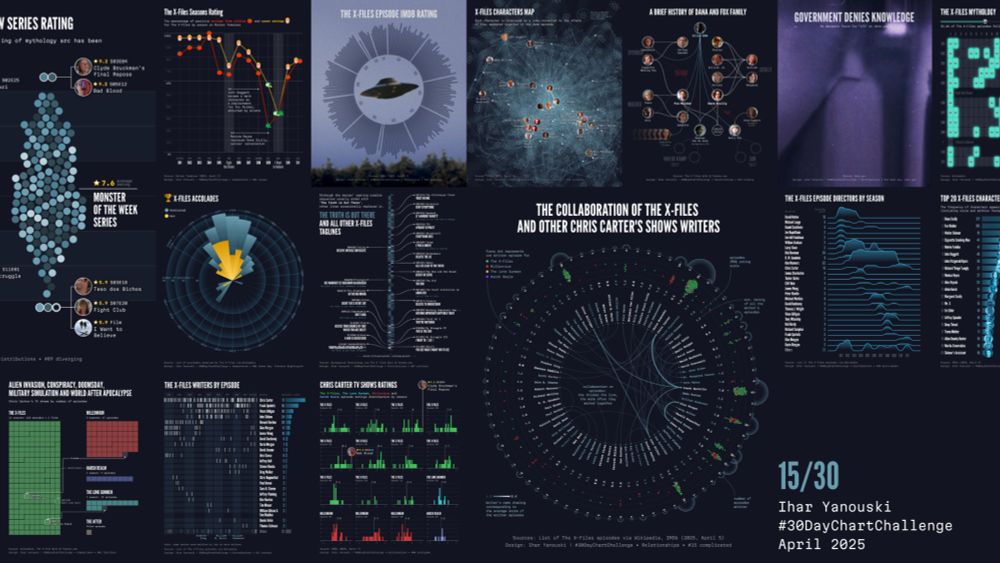
The X-Files Infographics | Ihar Yanouski
A series of infographics about The X-Files TV show designed as part of the #30DayChartChallenge in April 2025
#30DayChartChallenge is over, happy to make 15/30 😌
Many thanks to the organizers and all the participants 👏
You can find all my contributions here: yanouski.com/work/30-day-...
Conspiracy mode deactivated 🛸
#xfiles #dataviz #datavisualization
01.05.2025 13:21 — 👍 19 🔁 2 💬 2 📌 0
On carpet piss 😌
23.04.2025 17:33 — 👍 1 🔁 0 💬 0 📌 0
I'm sure you can already frame some! I like your last stripe plot, very insightful and eye catching.
Although it's a tempting thought, for some reason I don't have any prints of my charts 😐
23.04.2025 17:30 — 👍 1 🔁 0 💬 1 📌 0
The failure of the designer, but the triumph of the artist 😅
Thank you!
23.04.2025 08:56 — 👍 1 🔁 0 💬 1 📌 0
Thank you for your kind words!
I can share a high-resolution file if you ever want to print it 😅
22.04.2025 13:01 — 👍 1 🔁 0 💬 1 📌 0
Exactly! But the source for the writing credit I got on Wikipedia, IMDb was for episodes rating only.
22.04.2025 04:56 — 👍 1 🔁 0 💬 0 📌 0
Дзякуй!
21.04.2025 17:23 — 👍 1 🔁 0 💬 0 📌 0
Зрабіў прататып з дапамогаю #D3js і #Svelte, пасьля ў Фігме троху дапрацаваў, дадаў подпісы
21.04.2025 17:14 — 👍 1 🔁 0 💬 1 📌 0
Thank you! I’m happy you like it 😌
21.04.2025 15:52 — 👍 1 🔁 0 💬 0 📌 0
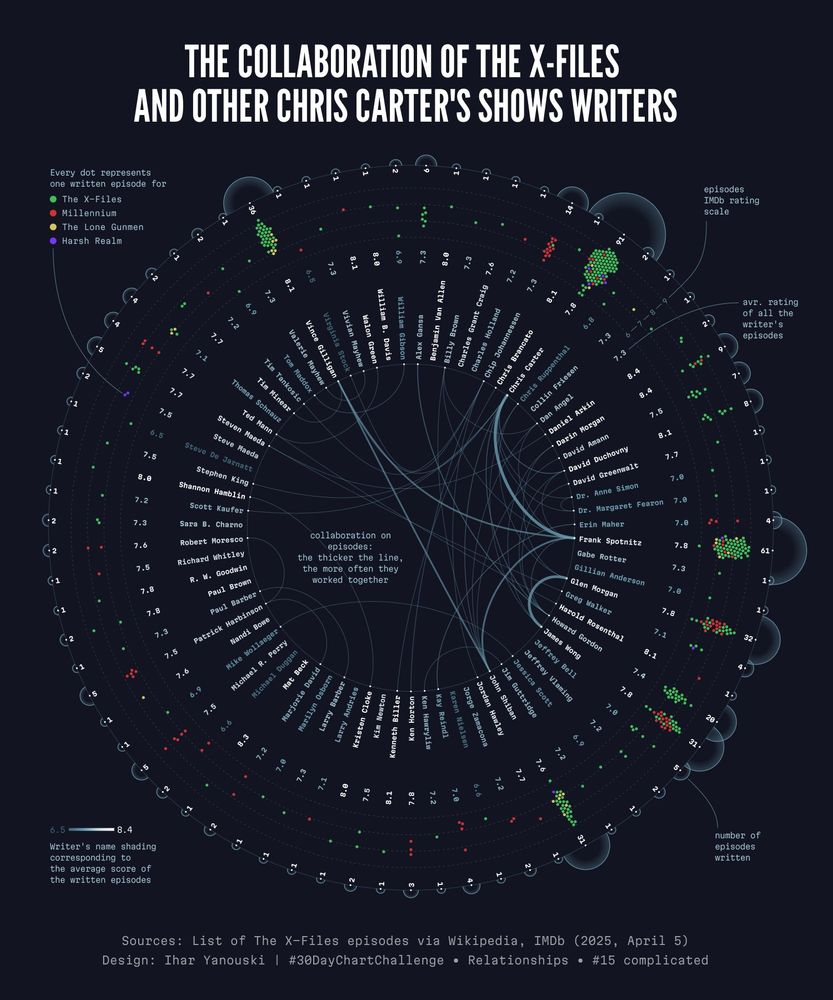
The Collaboration of the X-Files and Other Chris Carter's Shows Writers it displays how authors worked together, written episodes distributed by rating and average IMDb rating for all episodes for every writer. Data is visualized with radial network diagram.
Sources: List of The X-Files episodes via Wikipedia, IMDb (2025, April 5).
Designed by Ihar Yanouski for #30DayChartChallenge
#30DayChartChallenge Day 15. complicated
#xfiles #dataviz #datavisualization
21.04.2025 10:40 — 👍 34 🔁 2 💬 5 📌 0
Oh, rewatching X-Files was a pure joy. Indeed, some things are timely. Some of them are just timeless, I guess
17.04.2025 18:24 — 👍 1 🔁 0 💬 0 📌 0
I just needed to get it in order 😵
17.04.2025 17:51 — 👍 1 🔁 0 💬 1 📌 0
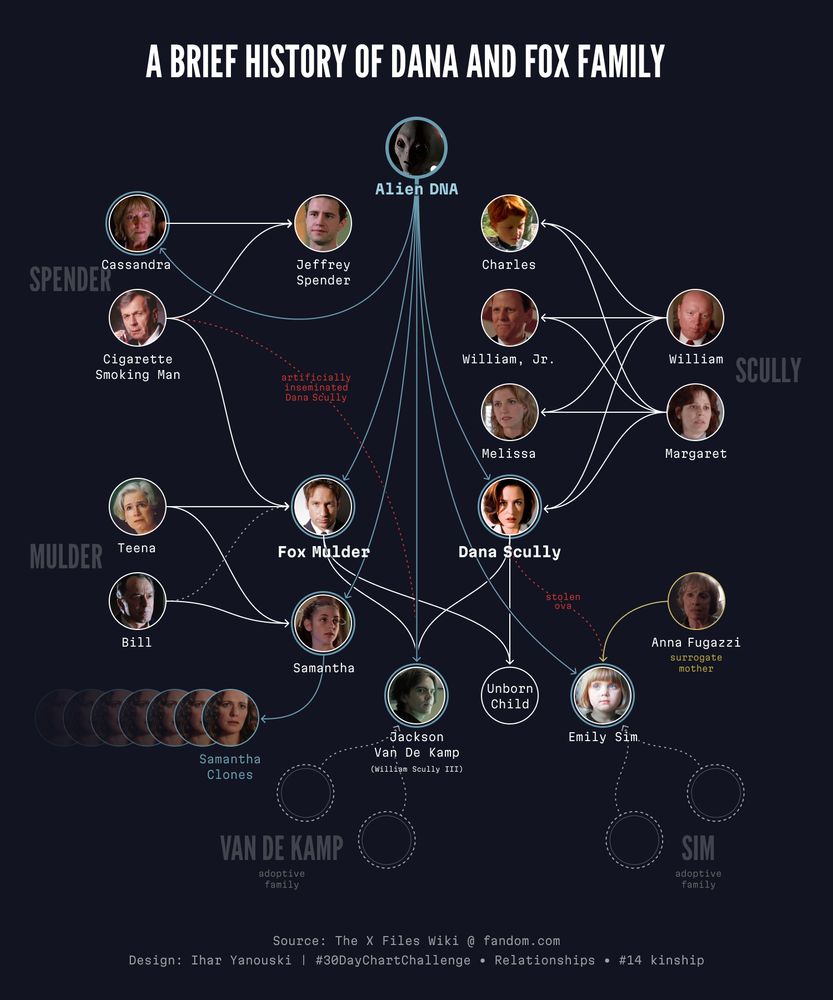
A Brief History of Dana and Fox Family infographic showing relatives connections of the X-Files TV show fictional characters Dana Scully and Fox Mulder
#30DayChartChallenge Day 14. kinship
#xfiles
17.04.2025 16:23 — 👍 11 🔁 2 💬 1 📌 1
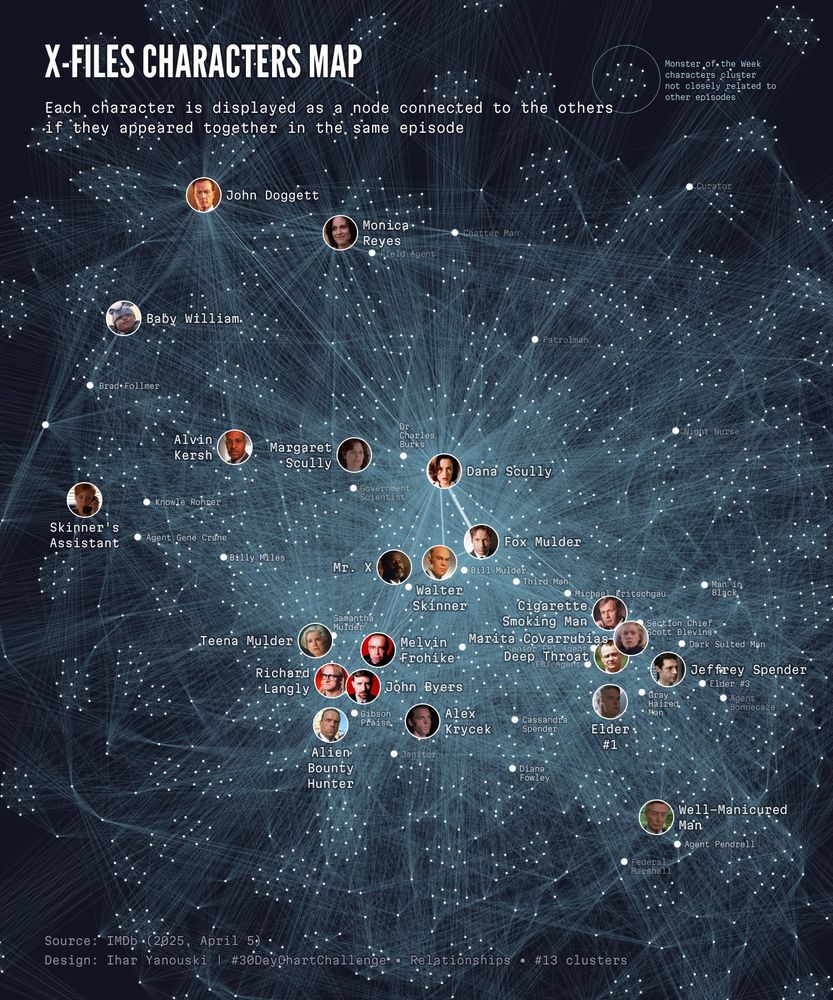
X-Files Characters Map infographic displaying each character as a node connected to the others if they appeared in the same episode.
Data source: IMDb. Designed by Ihar Yanouski.
#30DayChartChallenge Day 13. clusters
#xfiles #dataviz #datavisualization
15.04.2025 18:52 — 👍 10 🔁 1 💬 0 📌 0
Great switching animation! I like it 👏
It seems only labels did not update the value after the switch
13.04.2025 06:36 — 👍 1 🔁 0 💬 1 📌 0
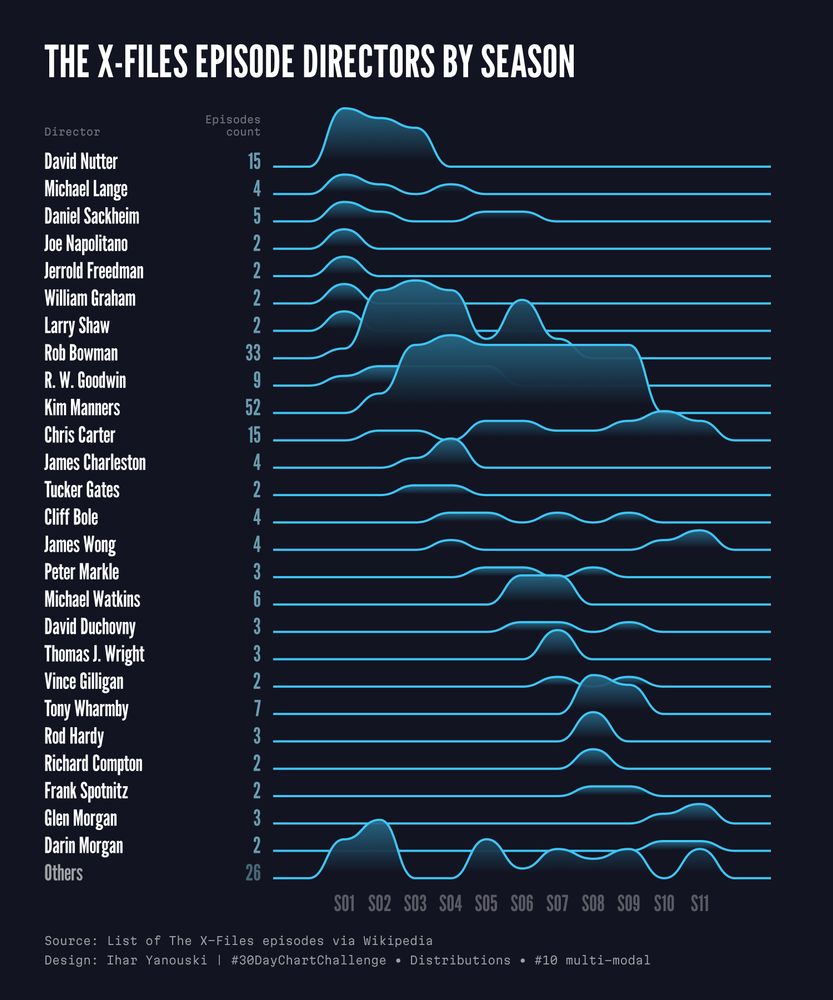
The X-Files Episode Directors by Season infographic showing distribution with Ridgeline plot
#30DayChartChallenge Day 10. multi-modal
#xfiles #dataviz
12.04.2025 18:33 — 👍 11 🔁 3 💬 1 📌 0

Government denies knowledge thematic poster based on The X-Files
#30DayChartChallenge Day 12. data day: data.gov
Couldn't help myself, sorry 😅
#xfiles
12.04.2025 07:22 — 👍 11 🔁 2 💬 0 📌 0
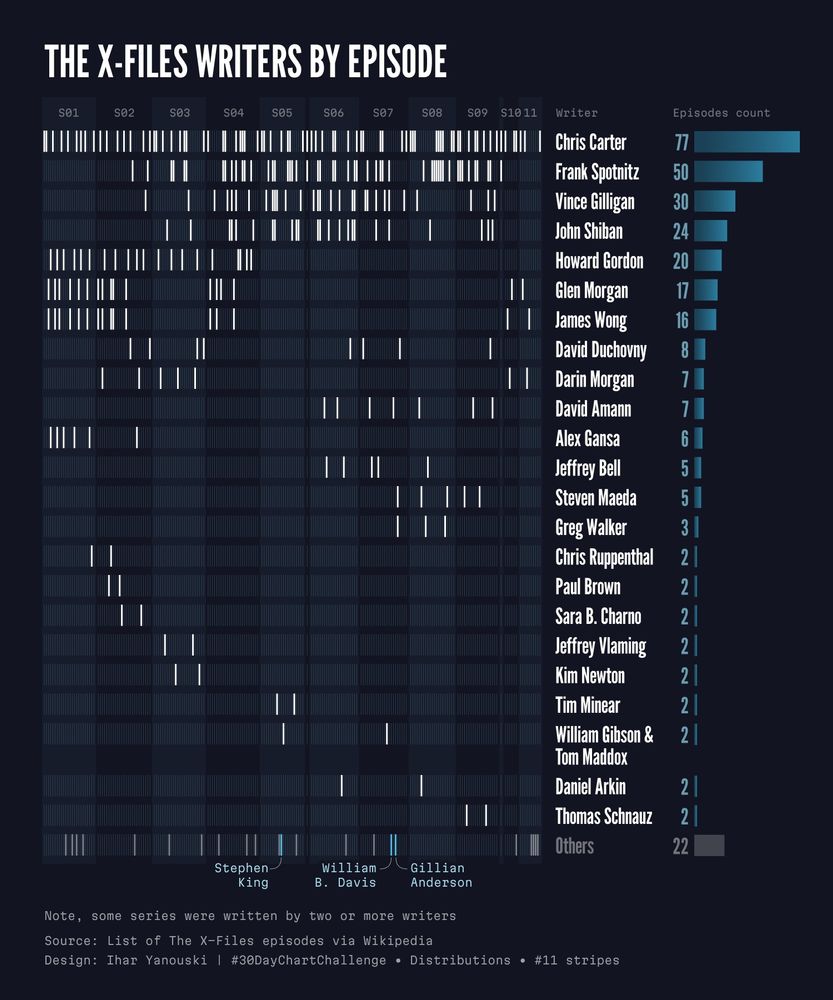
The X-Files Writers by Episode infographic showing how distributed work of Chris Carter, Frank Spotnitz, Vince Gilligan, John Shiban, Howard Gordon, Glen Morgan, James Wong and others over the TV series
#30DayChartChallenge Day 11. stripes
#xfiles #dataviz
11.04.2025 18:29 — 👍 6 🔁 1 💬 0 📌 0
Definitely! That's why I rely exclusively on a lucky chance in my work 😅
10.04.2025 17:19 — 👍 1 🔁 0 💬 1 📌 0
Thanks a lot for your kind words!
10.04.2025 15:04 — 👍 1 🔁 0 💬 1 📌 0
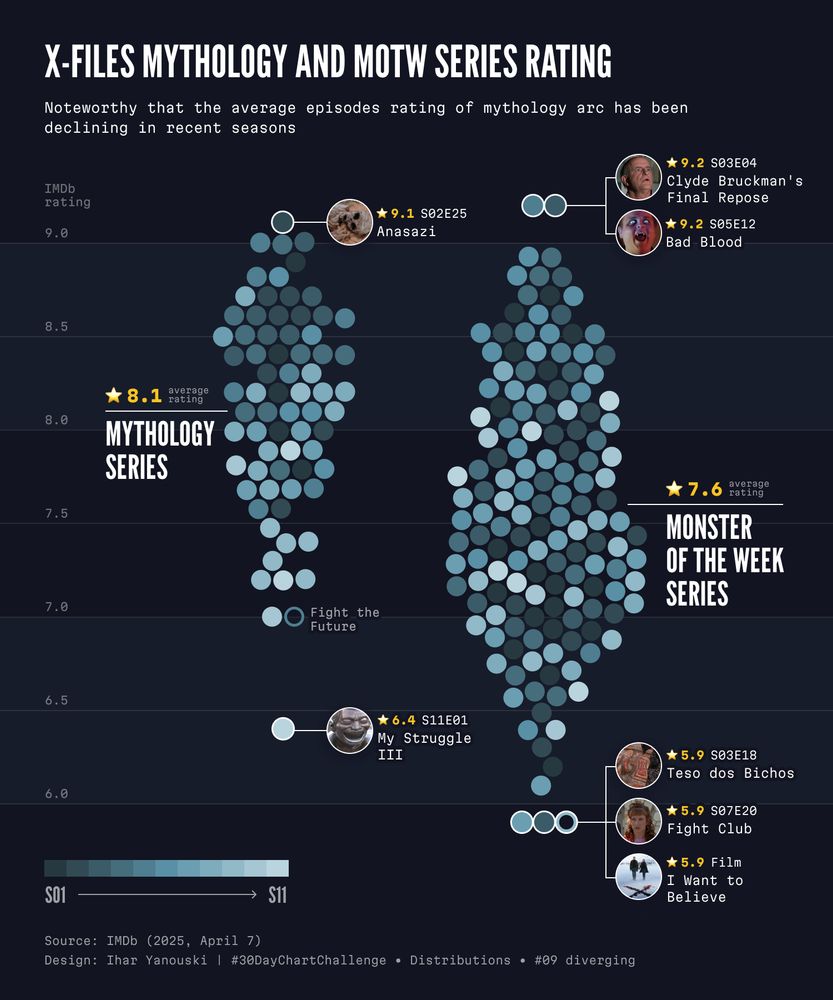
X-Files Mythology and Monster of the Week series rating infographic. Mythology series has 8.1 average rating, Monster of the Week series has 7.6 average rating. Noteworthy that the average episodes rating of mythology arc has been declining in recent seasons.
Data source: IMDb as on 2025, April 7
Visualization: Ihar Yanouski
#30DayChartChallenge Day 9. diverging
#xfiles #dataviz
10.04.2025 12:27 — 👍 29 🔁 4 💬 1 📌 0
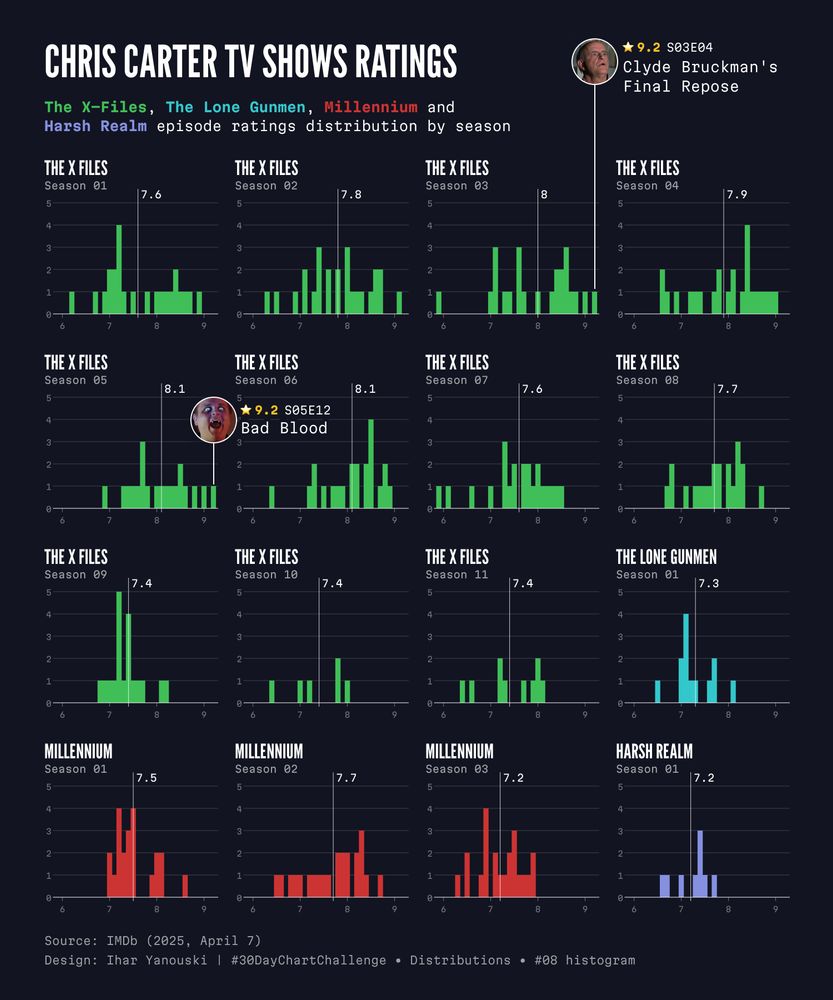
Chris Carter TV shows IMDb ratings infographic displaying The X-Files, The Lone Gunmen, Millennium and Harsh Realm episode ratings distributed by season with two episodes highlighted, which have the highest rating 9.2 : "Clyde Bruckman's Final Repose" and "Bad Blood"
#30DayChartChallenge Day 8. histogram
#TheXFiles #xfiles #dataviz #d3js #svelte
08.04.2025 10:45 — 👍 15 🔁 1 💬 0 📌 0
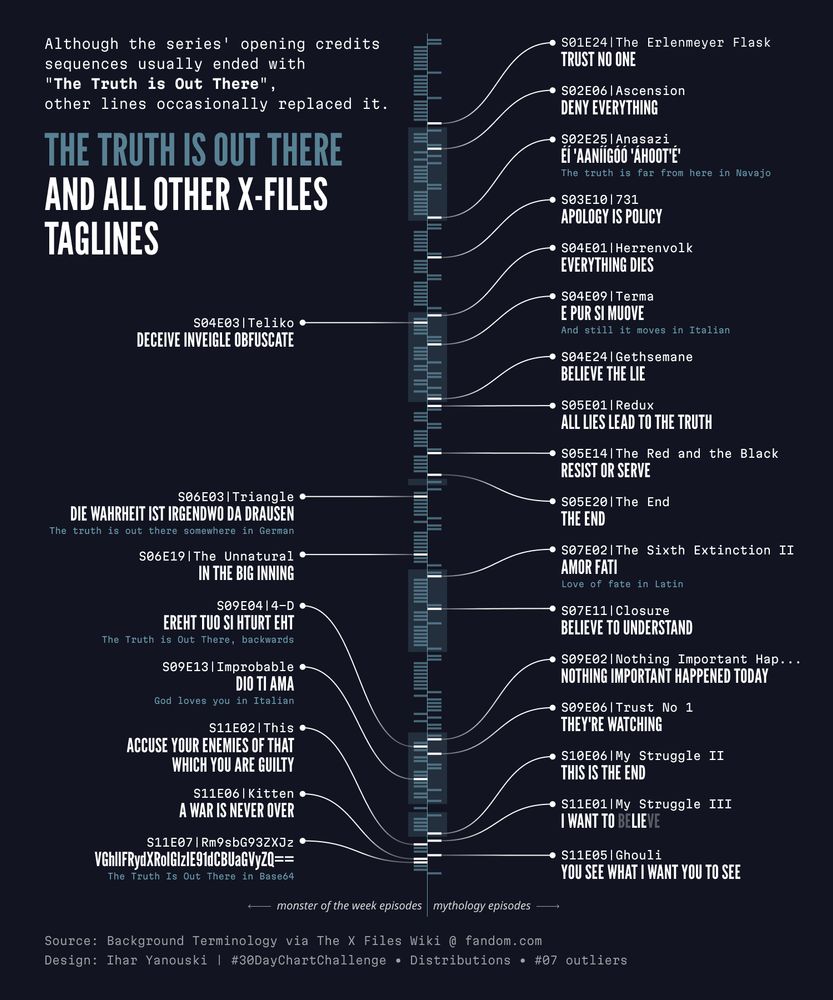
Infographic displaying all the X-Files taglines other than the main one — "The Truth is Out There"
#30DayChartChallenge Day 7. outliers
#TheXFiles #xfiles #dataviz #d3js #svelte
07.04.2025 12:28 — 👍 18 🔁 1 💬 1 📌 0
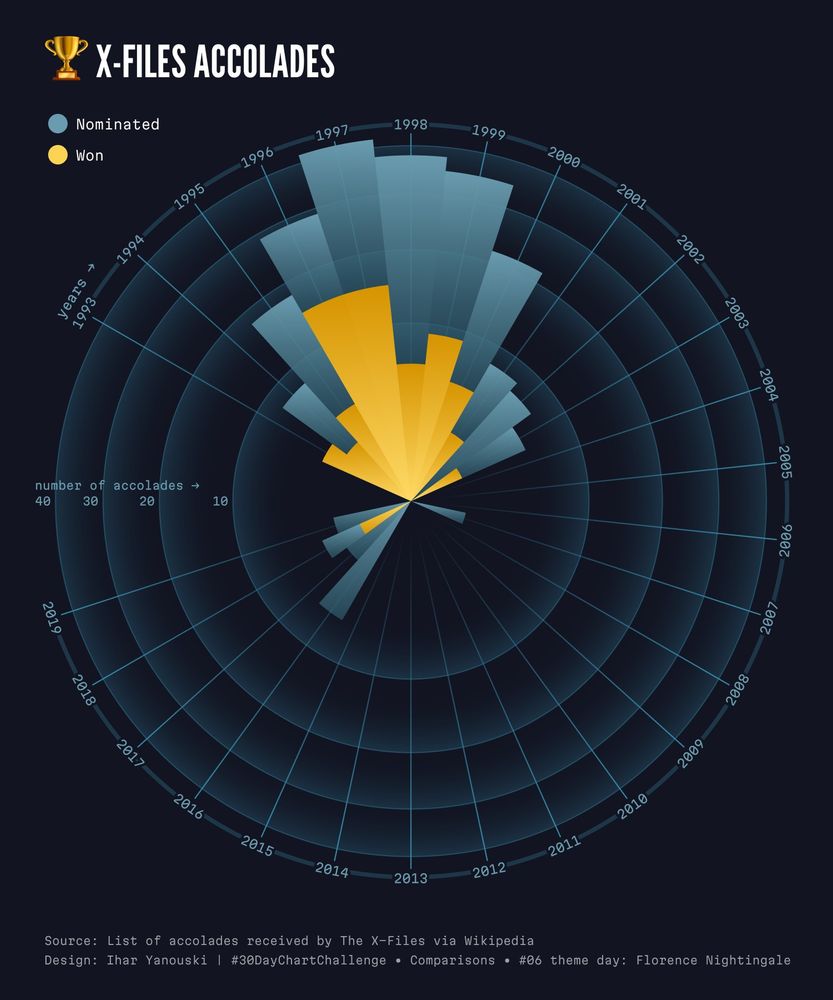
The infographic List of accolades received by The X-Files, showing the highest number of won awards in 1996 and 1997 (15 for each year)
#30DayChartChallenge Day 6. theme day: Florence Nightingale
#TheXFiles #xfiles #dataviz #d3js #svelte
06.04.2025 12:59 — 👍 9 🔁 1 💬 0 📌 0
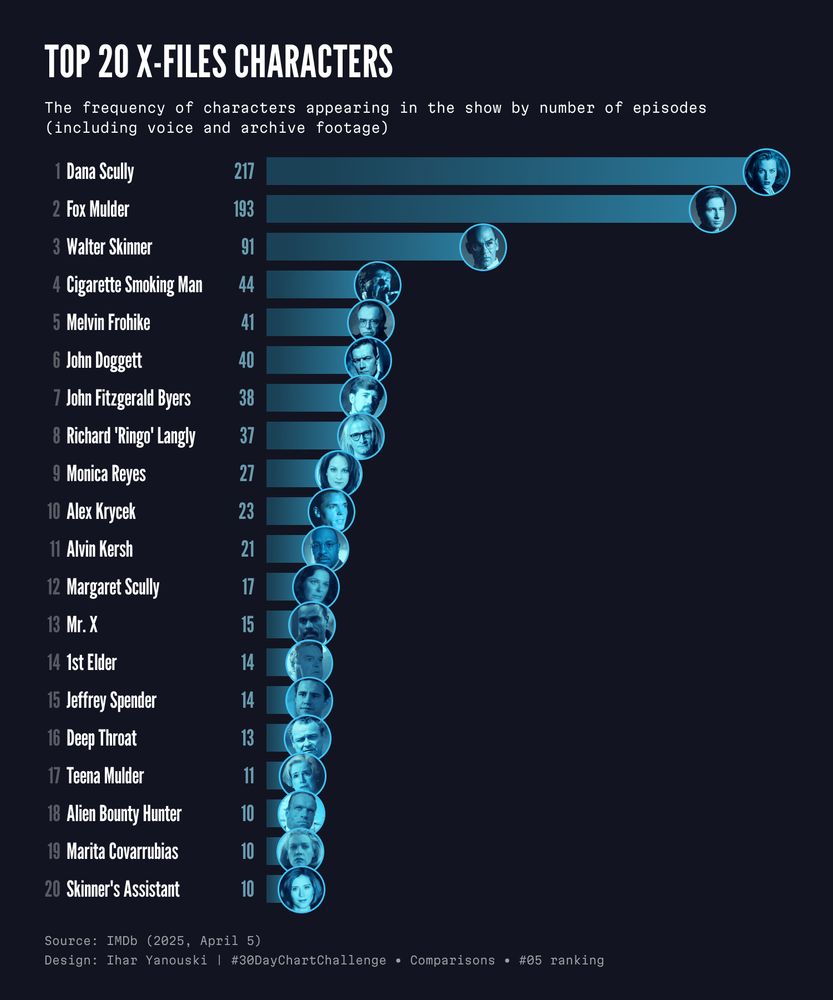
Top 20 X-Files Characters — infographic showing the frequency of characters appearing in the show by number of episodes, with Dana Scully, Fox Mulder, and Walter Skinner at the top.
#30DayChartChallenge Day 5. ranking
#xfiles #dataviz
05.04.2025 14:27 — 👍 10 🔁 1 💬 0 📌 0
The Global @svelte.dev Community! 🌍🌎🌏 🗣️
Discord: http://discord.gg/cT2KFtu 📺 YouTube: http://bit.ly/35fH5sk
I'm a Data Visualization Designer based in Paris.
www.ludovicriffault.com
Visual journalist at @visuals.nzz.ch
Personal: jonasoesch.ch
Visual journalist and engineer at Axios. Builder of websites, data visualizations, and pixel cats. She/her.
dataviz and statistics | https://jdonland.github.io | views are my own
Dataviz developer at Revisual Labs.
Data visualisation, urban sketching, frontend and just about anything to do with dogs.
https://peder.quarto.pub/blog
Father x3. Rstats & data viz.
Currently looking for gut bacterial by-products that influence the cholestatic liver disease primary sclerosing cholangitis
Norwegian green party 🌱
🇳🇴 🇩🇪 🏴
Data viz, UX, gaming, cats, and pole dance.
Saving the world one spreadsheet at a time.
Spatial Data Scientist • Artist • Economist | #ClimateRisk #Dataviz #Maps #DigitalArt #3D in London | X: Julian_H0ffmann
Portfolio: https://www.julian-hoffmann-anton.com/
👩🏿💻 data viz, maps, creative coding: https://elle-est-au-nord.com
👩🏿🎨 visual arts: artsynore.cargo.site
💝 healthy planet & democracy
Human geneticist working in clinical #genetics at MGZ Munich & at FindMe2care.
Interested in #humangenetics, #bioinformatics. Occasional #RStats & dataviz blogposts on christiangebhard.com
https://github.com/juanchiparra
Social Work Professor | Data Viz & Map Designer | Tableau Visionary & Ambassador | husband/father | perpetual student | he/him/his | no AI used
Talks about Power BI and data visualisation even when you ask him to please stop.
Charts and maps. Data Viz Specialist at Flourish
Exploring & visualizing data on nutrition, health, and eating habits: lumipie.com
Interests: 🧬 Biology 📊 Data Viz 📢 SciComm 💻 Coding
Prev: University of Copenhagen, MRC for Medical Mycology, Leibniz:HKI
Curator of the scientific #Nutrition feed
📍🇩🇰
#dataanalysis #rstats #dataviz
Senior Data Analyst, DTU Food
Views mine
www.gregdubrow.io
www.linkedin.com/in/dubrowg/
https://medium.com/the-polymaths-dilemma
Data analyst, loving outdoor 🌻 activities like hiking 🏞, swimming 🏊 and cycling 🚴♀️.
Visit my website www.designation.eu if you are interested in custom dashboards for business experts. If you want to follow me on LinkedIn: https://www.linkedin.com/