Macalester College, Environmental Studies
Full service online faculty recruitment and application management system for academic institutions worldwide. We offer unique solutions tailored for academic communities.
My (wonderful) department is hiring a one year full time visiting position in Environmental Policy/History. Renewable for a second year if all goes well. Please share with your colleagues/students, or perhaps this is a good fit for you! academicjobsonline.org/ajo/jobs/29759
19.02.2025 19:50 —
👍 2
🔁 0
💬 0
📌 0
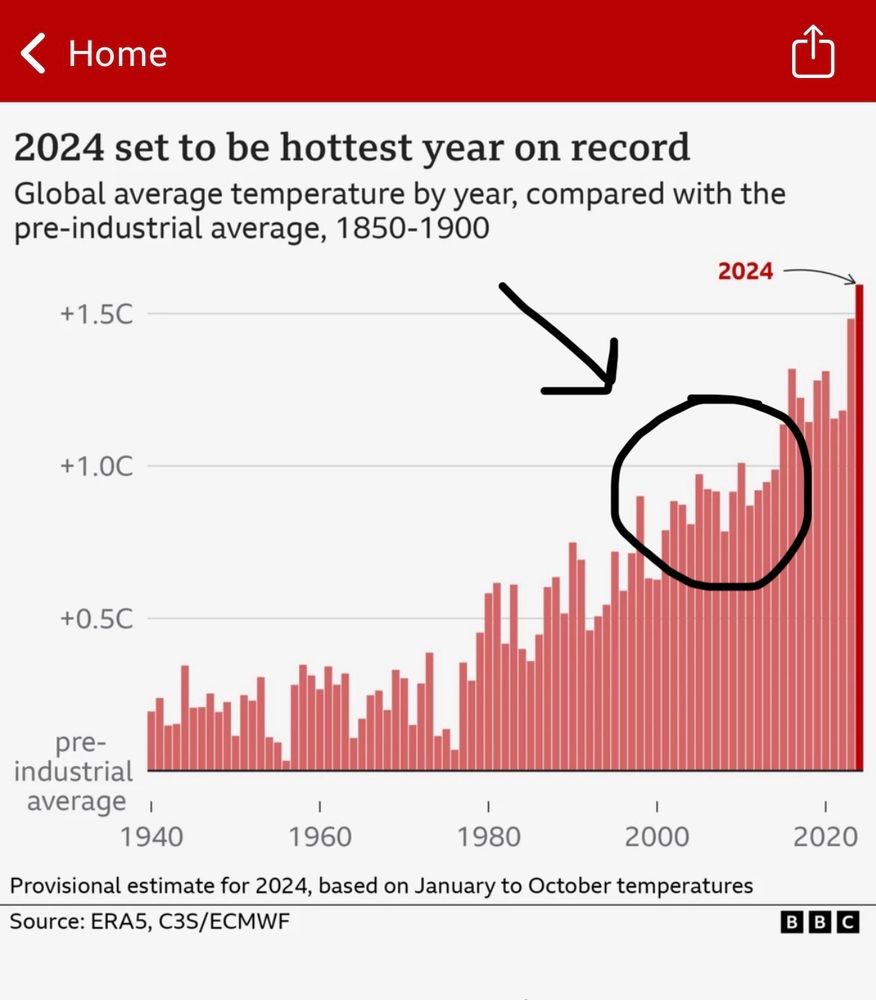
Repost this if you’re old enough to remember when they tried to convince us that “global warming stopped in 2008” (or whenever).
11.11.2024 17:12 —
👍 783
🔁 350
💬 31
📌 37

Graph illustrating the relationship between cumulative CO₂ emissions and global surface temperature increase from 1850 to 1900. Features projections for different scenarios leading to 2050, with a focus on climate-carbon feedback mechanisms and climate sensitivity. The x-axis is cumulative CO₂ emissions but labeled “F*uck around”, and the y-axis is increase in global surface temperature since 1850-1900 but labeled “Find out”.
Because of different sensitivities and feedbacks in the climate system, there's essentially a linear relationship between cumulative CO₂ emissions and global warming that we call Transient Climate Response to Emissions (TCRE).
If we want global warming to stop increasing we must stop CO₂ emissions.
12.11.2024 10:10 —
👍 450
🔁 131
💬 8
📌 6

