UMAP with R datavizpyr.com/how-to-make-... #rstats
22.09.2025 17:57 — 👍 1 🔁 0 💬 0 📌 0
@datavizpyr.bsky.social
Data Analysis to Visualisation with Python and R. Tune in for two DataViz tips per day - one in Python and and the second in R
UMAP with R datavizpyr.com/how-to-make-... #rstats
22.09.2025 17:57 — 👍 1 🔁 0 💬 0 📌 0Nice use of Monte Carlo Simulation: Advanced Retirement Planning Calculator calclabhq.com/advanced-ret...
10.09.2025 16:02 — 👍 0 🔁 1 💬 0 📌 0
I am beyond excited to announce that ggplot2 4.0.0 has just landed on CRAN.
It's not every day we have a new major #ggplot2 release but it is a fitting 18 year birthday present for the package.
Get an overview of the release in this blog post and be on the lookout for more in-depth posts #rstats
Nice use of Monte Carlo Simulation: Advanced Retirement Planning Calculator calclabhq.com/advanced-ret...
10.09.2025 16:02 — 👍 0 🔁 1 💬 0 📌 0
10 ChatGPT Prompts for ggplot2 Boxplots: Complete Guide with Working R Code datavizpyr.com/ggplot2-boxp... #DataViz #Prompt
08.09.2025 16:32 — 👍 1 🔁 0 💬 0 📌 0
Grouped Boxplot with jittered points: A Complete Guide datavizpyr.com/how-to-make-... #ggplot2 #rstats #dataviz
30.08.2025 06:10 — 👍 5 🔁 2 💬 0 📌 0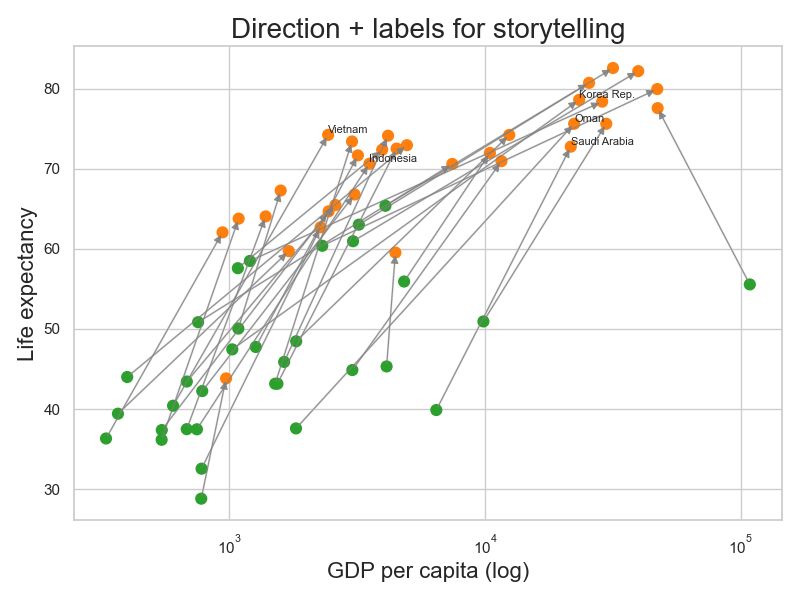
Connect paired points in a scatter plot with lines using matplotlib/Seaborn in Python
Want to connect paired data points in a scatter plot using Matplotlib? This step-by-step tutorial shows you how to draw lines between paired observations so you can easily visualize before–after / them-now comparison datavizpyr.com/connect-pair... #dataviz #python
05.09.2025 17:00 — 👍 1 🔁 1 💬 0 📌 1
Connect Paired Points on Boxplots with Lines in ggplot2
04.09.2025 14:33 — 👍 1 🔁 1 💬 0 📌 0How to Connect Paired Points on Boxplots with Lines in ggplot2 t.co/loNoE9avX1 #ggplot2 #dataviz
04.09.2025 14:33 — 👍 1 🔁 1 💬 1 📌 0#dataviz Area fill used to good effect in what would be an ordinary line graph 👍
04.09.2025 02:52 — 👍 16 🔁 3 💬 0 📌 0Yes both are great options.
04.09.2025 04:42 — 👍 1 🔁 0 💬 0 📌 0
Remove "the annoying" Space between Legend at Bottom and x-axis in ggplot2 datavizpyr.com/remove-space... #rstats #dataviz
03.09.2025 18:42 — 👍 13 🔁 2 💬 1 📌 1
Guide to Heatmaps with Seaborn in Python. datavizpyr.com/heatmaps-wit... #DataViz #Python
02.09.2025 16:01 — 👍 0 🔁 0 💬 0 📌 0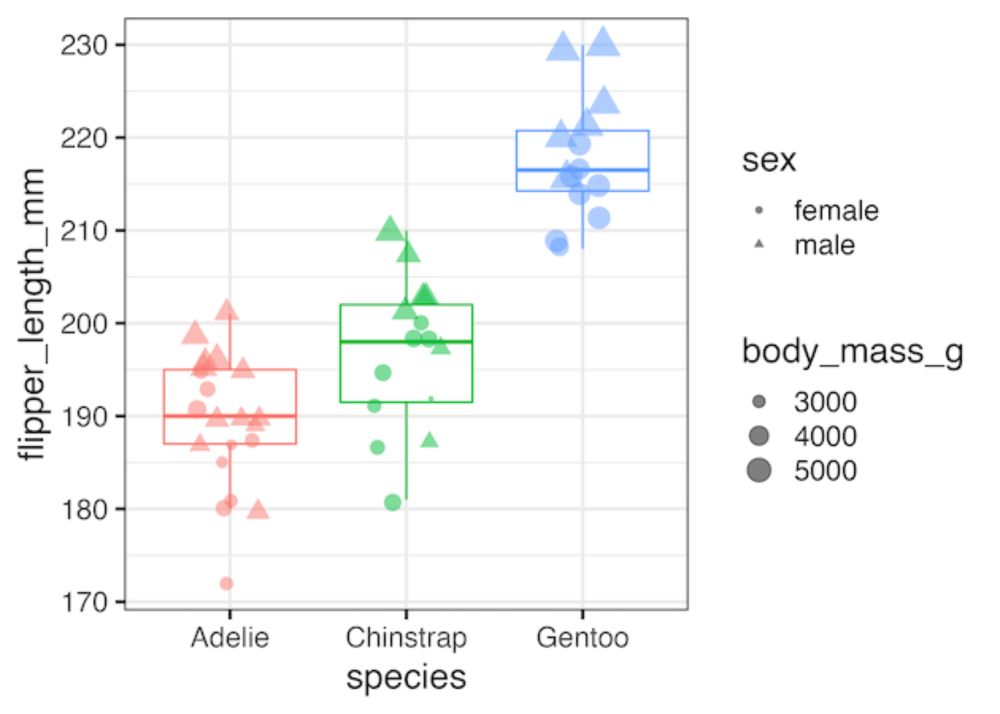
Selectively Remove or Hide Legends in ggplot2 datavizpyr.com/selectively-... #dataviz #rstats
02.09.2025 15:57 — 👍 5 🔁 4 💬 1 📌 1
Grouped Boxplot with jittered points: A Complete Guide datavizpyr.com/how-to-make-... #ggplot2 #rstats #dataviz
30.08.2025 06:10 — 👍 5 🔁 2 💬 0 📌 0
How To Fold Legend into Multiple Rows/Columns in ggplot2 datavizpyr.com/fold-legend-... #rstats #dataviz
25.08.2025 14:30 — 👍 3 🔁 1 💬 0 📌 0ggplot2 Guide & Cookbook (R): Geoms, Scales, Labels, Themes, Facets t.co/ZRsgsRo4CL #rstats #dataviz
21.08.2025 15:33 — 👍 3 🔁 1 💬 0 📌 0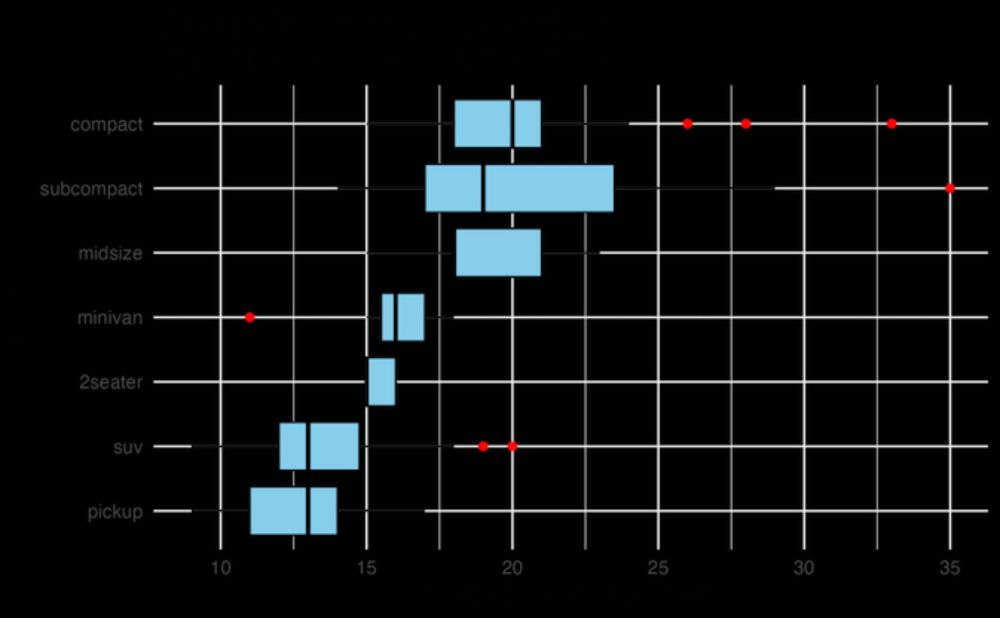
#ggplot2 Boxplot AI Workflows: A Modern Guide datavizpyr.com/ggplot2-boxp... #rstats #AIPrompt
20.08.2025 19:50 — 👍 1 🔁 1 💬 0 📌 0
Rotate x-axis Text Labels in ggplot2 #rstats datavizpyr.com/rotate-x-axi...
19.08.2025 14:03 — 👍 4 🔁 2 💬 0 📌 0
A room full of people looking at a presentation with two speakers. Contains text about the conference.
The full In-person program is out! The conference features three days of keynotes, tutorials, and talks to help you deepen your knowledge.
Schedule
user2025.r-project.org/program/in-p...
Get tickets
user2025.r-project.org/register
#useR #RStats

screenshot of the landing page on the site "Large Language Model tools for R". shows two screencaps from the simpsons
Sharing my "Large Language Model tools for R" guide with updates after new developments and a mention in the posit blog.
luisdva.github.io/llmsr-book/
- ggpal2
- pangoling
- more curated reading materials on coding with LLMs
# rstats
![library(tidymodels)
library(textrecipes)
data("tate_text", package = "modeldata")
tate_split <- initial_split(tate_text)
tate_train <- training(tate_split)
tate_test <- training(tate_split)
rec <- recipe(~ medium, data = tate_train) |>
step_tokenize(medium) |>
step_tfidf(medium, sparse = "yes") |>
prep()
bake(rec, tate_train, composition = "dgCMatrix") |> head()
#> 6 x 822 sparse Matrix of class "dgCMatrix"
#> [[ suppressing 822 column names 'tfidf_medium_1', 'tfidf_medium_10' ... ]]
#>
#> [1,] . . . . . . . . . . . . . . . . . . . . . . . . . . . . . . . . . . . .
#> [2,] . . . . . . . . . . . . . . . . . . . . . . . . . . . . . . . . . . . .
#> [3,] . . . . . . . . . . . . . . . . . . . . . . . . . . . . . . . . . . . .
bake(rec, tate_test, composition = "dgCMatrix") |> head()
#> 6 x 822 sparse Matrix of class "dgCMatrix"
#> [[ suppressing 822 column names 'tfidf_medium_1', 'tfidf_medium_10' ... ]]
#>
#> [1,] . . . . . . . . . . . . . . . . . . . . . . . . . . . . . . . . . . . .
#> [2,] . . . . . . . . . . . . . . . . . . . . . . . . . . . . . . . . . . . .
#> [3,] . . . . . . . . . . . . . . . . . . . . . . . . . . . . . . . . . . . .](https://cdn.bsky.app/img/feed_thumbnail/plain/did:plc:on2hn6gvz6ezvxenqnnz4urx/bafkreibviwqpz6ioe4nmufayby4zavxrv5235m6e4pchulbeq2cldo4mb4@jpeg)
library(tidymodels) library(textrecipes) data("tate_text", package = "modeldata") tate_split <- initial_split(tate_text) tate_train <- training(tate_split) tate_test <- training(tate_split) rec <- recipe(~ medium, data = tate_train) |> step_tokenize(medium) |> step_tfidf(medium, sparse = "yes") |> prep() bake(rec, tate_train, composition = "dgCMatrix") |> head() #> 6 x 822 sparse Matrix of class "dgCMatrix" #> [[ suppressing 822 column names 'tfidf_medium_1', 'tfidf_medium_10' ... ]] #> #> [1,] . . . . . . . . . . . . . . . . . . . . . . . . . . . . . . . . . . . . #> [2,] . . . . . . . . . . . . . . . . . . . . . . . . . . . . . . . . . . . . #> [3,] . . . . . . . . . . . . . . . . . . . . . . . . . . . . . . . . . . . . bake(rec, tate_test, composition = "dgCMatrix") |> head() #> 6 x 822 sparse Matrix of class "dgCMatrix" #> [[ suppressing 822 column names 'tfidf_medium_1', 'tfidf_medium_10' ... ]] #> #> [1,] . . . . . . . . . . . . . . . . . . . . . . . . . . . . . . . . . . . . #> [2,] . . . . . . . . . . . . . . . . . . . . . . . . . . . . . . . . . . . . #> [3,] . . . . . . . . . . . . . . . . . . . . . . . . . . . . . . . . . . . .
One of the exciting parts of the new sparse data tidymodels work, is that {textrecipes} can now be used as a reproducible way to generate DTM, tf-idf etc etc
#rstats #tidymodels

🎉 Happy to share that we just released {chromote} v0.5.0, an #RStats package for remotely driving the Chrome browser. New in this release: chromote can now download and use any version of Chrome or `chrome-headless-shell`! Plus a few bug fixes for new Chrome versions. shiny.posit.co/blog/posts/c...
21.03.2025 13:41 — 👍 46 🔁 5 💬 3 📌 0
I'm beyond excited to share with you all that tidymodels now have sparsity support.
We now support sparse data during the whole process, generate data sparsely in recipes steps when your model supports spare data structures. and you don't have to change anything!
www.tidyverse.org/blog/2025/03...
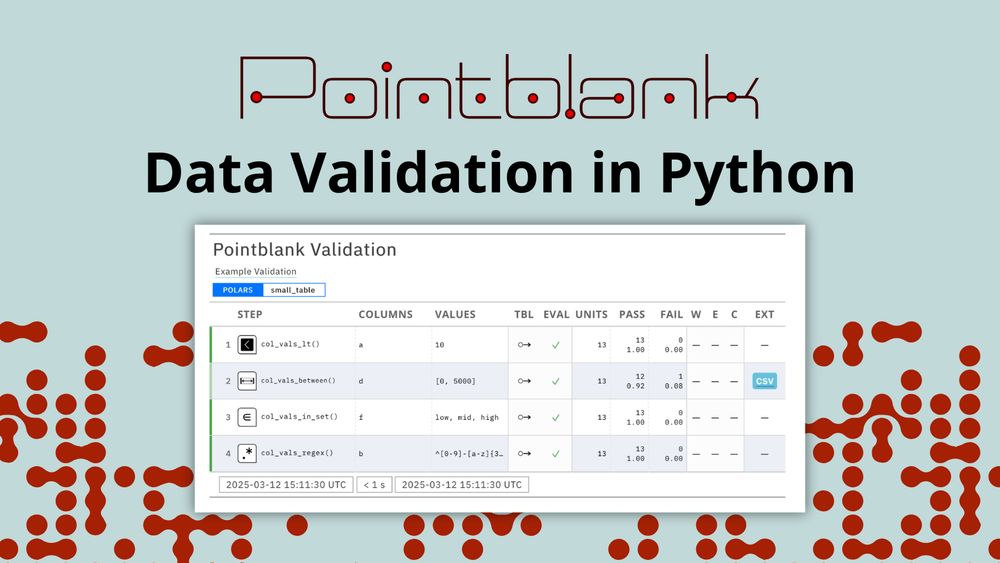
Pointblank data validation in Python
We are thrilled to announce Pointblank for data validation in Python!
With Pointblank, you can check your data against expectations and constraints, get a beautiful report table, and examine detailed step results and metrics.
Learn more in the blog post: posit.co/blog/introdu...
#Python

The hex sticker for the gander package: a cartoonish goose swims on a green background with a blue 'reflection' below it. The Posit logo is in the corner.
Introducing gander, the AI-powered coding assistant that can describe objects in your #RStats environment!
gander provides detailed data descriptions directly to LLMs for more accurate coding assistance.
Explore the motivation and see an example in @simonpcouch.com's post: posit.co/blog/introdu...
We don't spend a penny on marketing. It's all word of mouth for @costplusdrugs.com
That's how we keep prices so low. Please spread the word !

👋🏻
In the last 10 years, I’ve had a growing interest in making Python development more effective. I’ve learned that a lot of teams don’t make the best use of the tooling available to use.
This has culminated with writing an ebook on developer tooling I’m excited to share with you.
pydevtools.com

Horizon chart showing ratings of Power Rangers over time, with colours chosen to reflect the characters

Stream chart showing the use of different words in horror tale descriptions, with many relating to women and children.
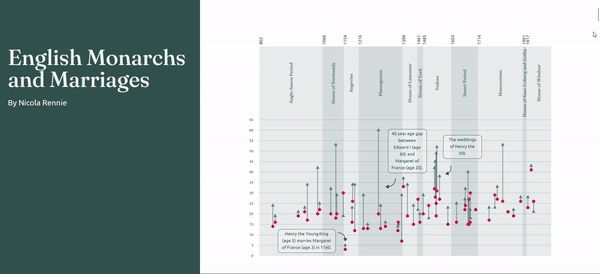
gif showing the process of scrolling through a scrollytelling visualisation abou English monarchs

3x2 grid of abstract maps of Edinburgh and Glasgow showing elevation, streets, and buildings
I'm super happy to see that several of my data visualisation projects were long-listed at the 2024 Information is Beautiful Awards! 📊
#RStats #DataViz #ggplot2 #RSpatial #TidyTuesday