Event flyer showing date of event as November 4 at 6pm CET, and the title developing your data visualisation skills in ggplot2
I'm really excited to be running this session for @rladiesrome.bsky.social next month! 📊
We'll be talking about data viz design, building charts in ggplot2, and tips for how to develop your viz skills!
#DataViz #ggplot2 #RStats #RLadies
13.10.2025 10:33 — 👍 25 🔁 6 💬 2 📌 0
4 word horror story for an R user:
"has a Java dependency"
12.10.2025 16:29 — 👍 36 🔁 9 💬 2 📌 0

The image is a public health poster from NYC Health titled “Prevent Long COVID.”
It explains that the only way to prevent Long COVID is to avoid getting COVID-19, as each infection carries a risk.
It lists prevention tips:
Wear a well-fitting mask (N95, KN95, KF94) in crowded or poorly ventilated indoor spaces.
Stay up to date with COVID-19 vaccinations.
Stay home if sick, or wear a mask if you must go out.
Avoid close contact with sick people.
Wash hands often or use hand sanitizer.
By nychealthy @nychealthy.bsky.social
The best way to prevent Long COVID is to prevent getting COVID-19 or getting it multiple times. That means staying up to date with COVID-19 vaccines and wearing a well-fitting mask, especially when indoors among crowds.
Learn more: www.nyc.gov/site/doh/cov...
05.10.2025 01:30 — 👍 268 🔁 106 💬 1 📌 4
/beginrant TBH many companies would benefit from skills in that area. I wish more companies to invest in user experience for developers /endrant
30.09.2025 18:37 — 👍 0 🔁 0 💬 1 📌 0
After reading your post and your experience with usability research and log analysis I thought about @honeycomb.io @posit.co @databricks.bsky.social Unfortunately, I do not have any names or specific leads.
30.09.2025 18:37 — 👍 1 🔁 0 💬 1 📌 0
Not saying there aren't unique challenges with aging but can we stop assuming all younger people are healthy challenge.
27.09.2025 18:36 — 👍 38 🔁 3 💬 0 📌 0
"Wait until you're older, your body will stop working well."
Or, may I introduce a concept of people being chronically ill at every age.
27.09.2025 18:32 — 👍 191 🔁 36 💬 3 📌 3

ggplot2 4.0.0
A new major version of ggplot2 has been released on CRAN. Find out what is new here.
I am beyond excited to announce that ggplot2 4.0.0 has just landed on CRAN.
It's not every day we have a new major #ggplot2 release but it is a fitting 18 year birthday present for the package.
Get an overview of the release in this blog post and be on the lookout for more in-depth posts #rstats
11.09.2025 11:20 — 👍 847 🔁 282 💬 9 📌 51

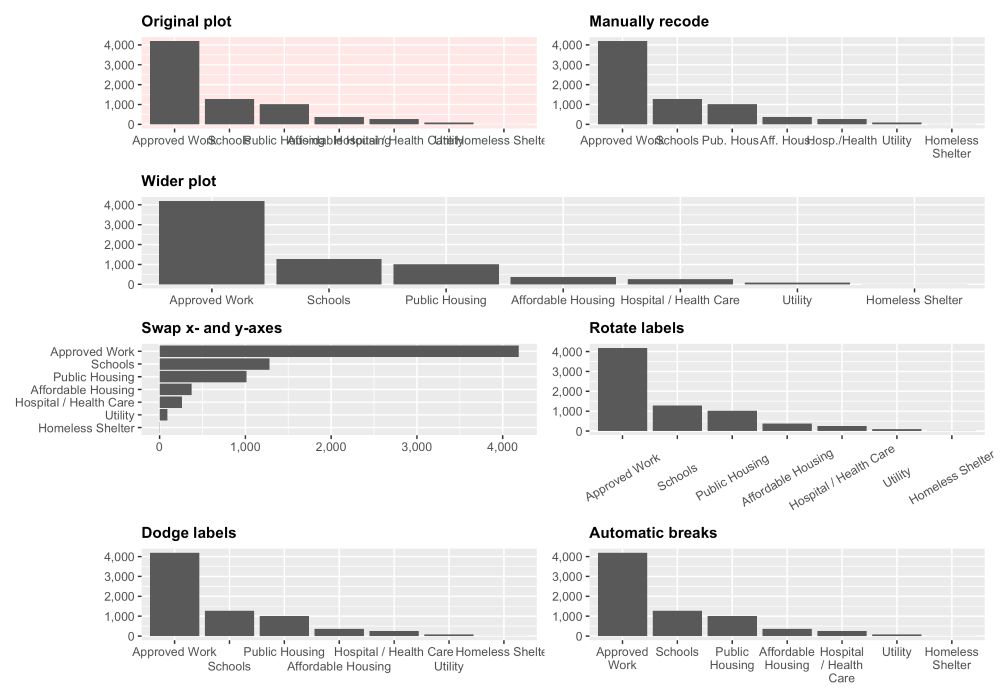
Exploring {ggplot2}’s Geoms and Stats – Stat’s What It’s All About
New blog post!
Ever wonder what geom_histogram is actually doing? How about geom_boxplot?
In celebration of the release of #ggplot2 4.0.0 (ggplot8?), I explore the relationships between the “geoms” and “stats” offered by the core {ggplot2} functions.
#rstats
15.09.2025 19:04 — 👍 76 🔁 34 💬 1 📌 4
🎯🎯🎯👇
04.09.2025 22:24 — 👍 12 🔁 2 💬 0 📌 0

Educated Guess
Forecasting With Time Series Models Using R
Educated Guess - An Intuitive Guide to Forecasting With Time Series Models Using R by @davidubilava.bsky.social
#rstats #econsky #forecasting
davidubilava.com/forecasting/...
31.08.2025 17:24 — 👍 6 🔁 4 💬 0 📌 1

A Gaussian process showing that the allowed time series are forced to be compatible with data
I’m especially proud of this article I wrote about Gaussian Processes for the Recast blog! 🥳
GPs are super interesting, but it’s not easy to wrap your head around them at first 🤔
This is a medium level (more intuition than math) introduction to GPs for time series.
getrecast.com/gaussian-pro...
29.08.2025 17:11 — 👍 78 🔁 24 💬 2 📌 0
2/2
- the difference in mental models about how things work due to the technological changes that have occurred since you learned, and when your students are learning.
29.08.2025 13:01 — 👍 2 🔁 1 💬 0 📌 0
1/2 Teaching always confronts you with:
- the fact that you are no longer a beginner, which makes you realize that certain steps come so naturally to you that you forget to explain them explicitly.
29.08.2025 13:01 — 👍 2 🔁 1 💬 1 📌 0
Preprint and the website by @dingdingpeng.the100.ci and @vincentab.bsky.social are great, and I got inspired to illustrate Bayesian workflow for model checking and comparison *before* model interpretation following their friendship importance example users.aalto.fi/~ave/casestu...
27.08.2025 10:10 — 👍 90 🔁 20 💬 2 📌 0

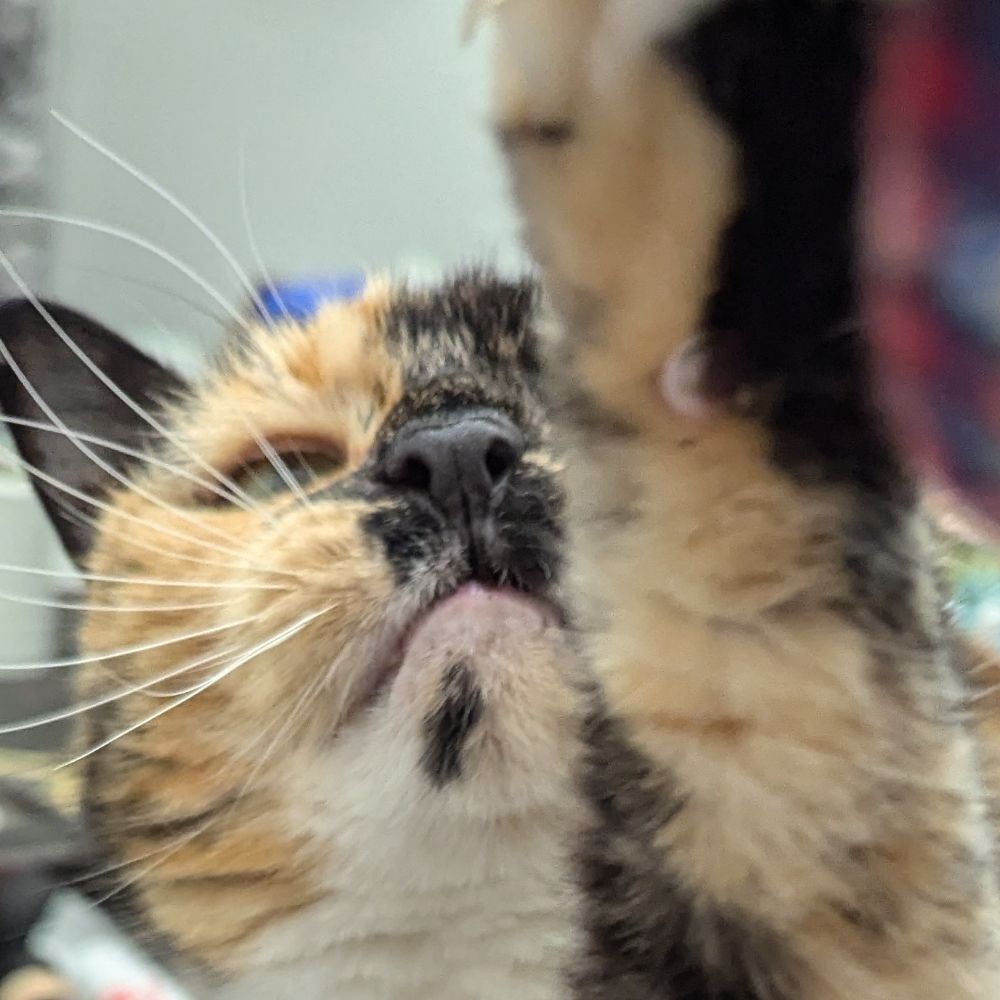
You can estimate a kitten’s age by looking at their teeth. Purdue Vet School has created this handy chart with photos to help. Baby teeth appear by 2–3 weeks, start falling out around 14–16 weeks, and are fully replaced by adult teeth by about 6 months.
27.08.2025 04:46 — 👍 18 🔁 2 💬 4 📌 0

Models as Prediction Machines: How to Convert Confusing Coefficients into Clear Quantities
Abstract
Psychological researchers usually make sense of regression models by interpreting coefficient estimates directly. This works well enough for simple linear models, but is more challenging for more complex models with, for example, categorical variables, interactions, non-linearities, and hierarchical structures. Here, we introduce an alternative approach to making sense of statistical models. The central idea is to abstract away from the mechanics of estimation, and to treat models as “counterfactual prediction machines,” which are subsequently queried to estimate quantities and conduct tests that matter substantively. This workflow is model-agnostic; it can be applied in a consistent fashion to draw causal or descriptive inference from a wide range of models. We illustrate how to implement this workflow with the marginaleffects package, which supports over 100 different classes of models in R and Python, and present two worked examples. These examples show how the workflow can be applied across designs (e.g., observational study, randomized experiment) to answer different research questions (e.g., associations, causal effects, effect heterogeneity) while facing various challenges (e.g., controlling for confounders in a flexible manner, modelling ordinal outcomes, and interpreting non-linear models).

Figure illustrating model predictions. On the X-axis the predictor, annual gross income in Euro. On the Y-axis the outcome, predicted life satisfaction. A solid line marks the curve of predictions on which individual data points are marked as model-implied outcomes at incomes of interest. Comparing two such predictions gives us a comparison. We can also fit a tangent to the line of predictions, which illustrates the slope at any given point of the curve.

A figure illustrating various ways to include age as a predictor in a model. On the x-axis age (predictor), on the y-axis the outcome (model-implied importance of friends, including confidence intervals).
Illustrated are
1. age as a categorical predictor, resultings in the predictions bouncing around a lot with wide confidence intervals
2. age as a linear predictor, which forces a straight line through the data points that has a very tight confidence band and
3. age splines, which lies somewhere in between as it smoothly follows the data but has more uncertainty than the straight line.
Ever stared at a table of regression coefficients & wondered what you're doing with your life?
Very excited to share this gentle introduction to another way of making sense of statistical models (w @vincentab.bsky.social)
Preprint: doi.org/10.31234/osf...
Website: j-rohrer.github.io/marginal-psy...
25.08.2025 11:49 — 👍 943 🔁 283 💬 48 📌 19
The R Manuals – R Manuals
I know this has been announced a while ago but I just rediscovered that the #RStats manuals are now published in @quarto.org.
Makes reading them more attractive imho.
rstudio.github.io/r-manuals/
25.08.2025 15:52 — 👍 12 🔁 5 💬 1 📌 0
Sunflowers are full of secrets 🕵️♀️🌻 I had a blast making this for @nybg.bsky.social 's Van Gogh's Flowers exhibit, where you can see all the 🌻🌻🌻 shine through Oct. 26th!
#scicomm 🧪 #nationalsunflowerday #botany
05.08.2025 13:50 — 👍 81 🔁 24 💬 4 📌 5
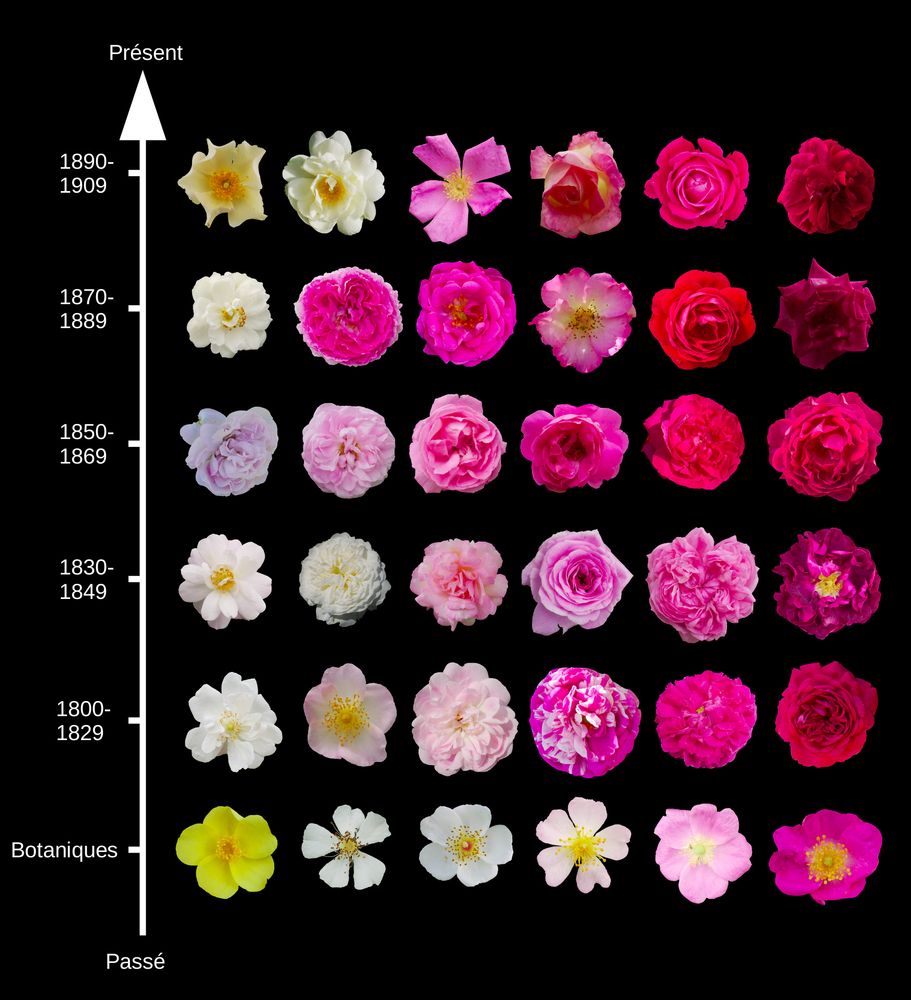

My small contribution to the popularization of evolutionary biology during the #ESEB2025 week, thanks to this article on the evolution of rose breeding in The Conversation France.
If you read French, here it is: theconversation.com/comment-le-c...
If not, our Genetics paper: doi.org/10.1093/gene...
21.08.2025 22:09 — 👍 79 🔁 19 💬 1 📌 0

Call for papers – LatinR 2024
May 31, 2025
🎤 Are you working on research, applications, or package development in #RStats?
At #LatinR2025 you can present your work in a 10-minute oral communication.
📅 Submit by August 25
💡 Join a live Q&A and discussion with the community.
Details:
21.08.2025 15:02 — 👍 3 🔁 4 💬 0 📌 0
I wish somebody would have told me that factor() used to be called category() when I was first learning #rstats.
It would have made the purpose of factors a lot clearer and explained why stringsAsFactors=TRUE when importing data.
🤦
19.08.2025 00:17 — 👍 15 🔁 2 💬 0 📌 0
Same with Data Science, and understanding the aspects of the work that goes beyond training models.
12.08.2025 18:28 — 👍 25 🔁 5 💬 1 📌 0
If you understand what software engineering as a career actually entails (lots of people and organizational problems, understanding legacy code and tradeoffs) you are at a career advantage over those who understand the job as just producing code.
Those jobs could be replaced. But that ain’t the job
12.08.2025 18:20 — 👍 454 🔁 64 💬 14 📌 10
Super excited to curate the @weare.rladies.org account this week. Follow me over there for data viz inspo, some things I think are magic, as well as chat about burnout, navigating career change and showing up for the #rstats community. Thanks for the nudge @pipinghotdata.com !
10.08.2025 08:24 — 👍 26 🔁 10 💬 2 📌 0
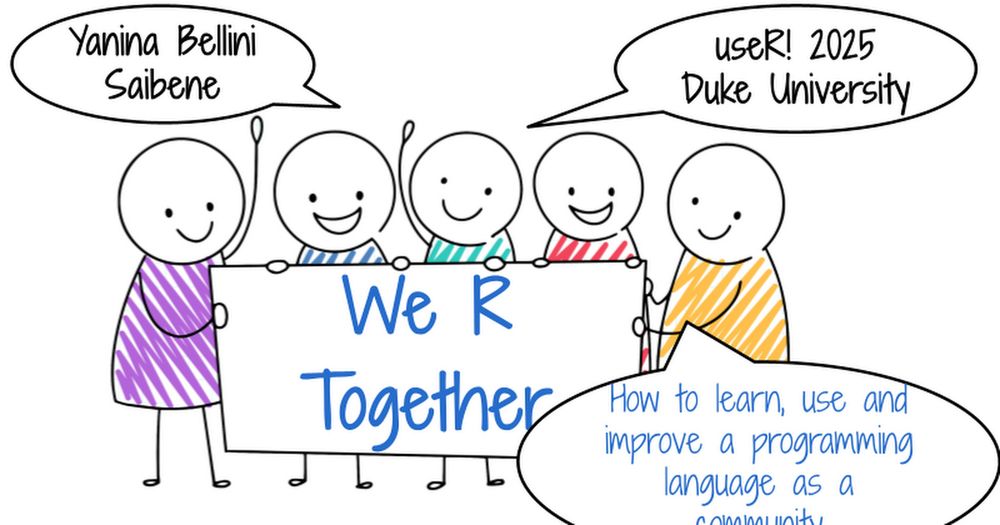
WeRTogether-useR!2025Keynote
We R Together Yanina Bellini Saibene useR! 2025 Duke University How to learn, use and improve a programming language as a community
Still smiling after my keynote abt Community at #useR2025 💜
Huge thanks to the organizing team for the invite, and to everyone who joined, asked questions, and shared their thoughts — you made it truly special!
Slides docs.google.com/presentation...
Video: www.youtube.com/live/CTTvTQ-...
#rstats
10.08.2025 10:28 — 👍 63 🔁 18 💬 2 📌 4
This morning at #useR2025, some nice insights from Simon Urbanek about the ways #rstats is optimized for different goals than a general-purpose programming language.
Always a special treat to hear from R Core members! 🥰
Some of my favorite takeaways...
🧵
09.08.2025 13:44 — 👍 21 🔁 5 💬 3 📌 0
balding man yells at clouds by day, loves cats and loud riffs by night. ✶✶✶✶ Chicago by way of lots of the world. Software by way of academia, beer and accidents. And by software I mean devops shizz but plz let's not make skeeting about work a thing.
Cartoonist and Illustrator. My book of science cartoons, PHYSICS FOR CATS, is available to preorder! www.tomgauld.com
Software Design Loudmouth. Works for Thoughtworks. Also hikes, watches theater, and plays modern board games. He/him.
host of https://martinfowler.com
@Swilua
"An inspiration to bog witches everywhere"— @jermsguy "Ms Frizzle IRL”— @ElleMaeGal “The funniest person I know on Bluesky"—@cstark “Cranky and Annoyed"— @washingtonpost she/fae kerrycoran.com
Professional geek and data scientist. Also makes generative, ambient music. Still a good egg.
Lecturer in psychological methods studying robust statistics and the credibility reform. Keen #rstats user. I climb a lot. I also like dogs. No DMs (refusing to verify age) - message me via other channels instead or respond to any post.
martinasladek.co.uk
$ /usr/bin/kevin: valid on disk
$ /usr/bin/kevin: satisfies its Designated Requirement
Software engineer at Posit. #rstats abjurations and conjurations.
The Data Platform Women in Technology (WIT) Virtual Chapter https://dataplatformwit.com
Comics by Reza Farazmand (official account!)
never was a cornflake girl
building Plain Jane Studios • bonkers obsessed with medieval history • Victorian literature aficionado • Pam Poovey stan • 3D modeling + rigging tryhard • artist • author: The Lost Chronicles (WIP)
No NFTs, No A.I.
linktr.ee/sarahcandersen
Noticias, análisis y periodismo independiente sobre política, esfera pública de México y el mundo
Assist Prof at UIUC Plant Bio #NewPI. NSF Postdoc UConn EEB. PhD Harvard OEB. Erasmus MEME evobio alumna. She/Her. Lover of ALL plants.
🧪🔬🌱🌾
Development; Evolution; Evo-Devo; Microscopy; Meristems.
Lived in 🇨🇳🇯🇵🇸🇪🇫🇷🇩🇪🇺🇸
www.minyaaa.com
Associate professor at Colorado College, plant evolutionary biologist, dog friend, working mom.
Psychologist, author, speaker. ADHD, autism, trauma. #ActuallyADHD, #ActuallyAutistic. Also cats. I like to think I'm funny. She/her
Best friend of @cmiriam.bsky.social
www.resiliencymentalhealth.com
https://linktr.ee/dramypsyd
Promoting diversity in the #RStats community via meetups, mentorship and global collaboration! 200+ groups worldwide.
#RLadies
Rotating Curator for the @rladies.org community💜
🔗 https://guide.rladies.org/rocur/
This week's curator: TBA
❤️📊 | 🗣️DE|EN|FR | #rstats | #econsky
We're a community of millions of people who are building new skills and getting new jobs together. A 501(c)(3) public charity.