'When authoritarians seize power, it is crucial to recognize courageous defenders of freedom who rise and resist,' the Norwegian Nobel Committee said as it announced Maria Corina Machado as the winner of the 2025 Nobel Peace Prize
10.10.2025 09:30 — 👍 5232 🔁 1858 💬 142 📌 400

Cross-Chapter Box 10 | Policy Attribution – Methodologies for Estimating the Macro-level
Impact of Mitigation Policies on Indices of Greenhouse Gas Mitigation
Authors: Mustafa Babiker (Sudan/Saudi Arabia), Paolo Bertoldi (Italy), Christopher Bataille (Canada), Felix Creutzig (Germany),
Navroz K. Dubash (India), Michael Grubb (United Kingdom), Erik Haites (Canada), Ben Hinder (United Kingdom), Janna Hoppe
(Switzerland), Yong-Gun Kim (Republic of Korea), Gregory F. Nemet (the United States of America/Canada), Anthony Patt (Switzerland),
Yamina Saheb (France), Raphael Slade (United Kingdom)
This report notes both a growing prevalence of mitigation policies over the past quarter century (Chapter 13), and ‘signs of progress’
including various quantified indices of GHG mitigation (Table 2.4). Even though policies implemented and planned to date are clearly
insufficient for meeting the Paris long-term temperature goals, a natural question is to what extent the observed macro-level changes
(global, national, sectoral, technological) can be attributed to policy developments. This Assessment Report is the first to address that
question. This box describes the methods for conducting such ‘attribution analysis’ as well as its key results, focusing on the extent to
which polices have affected three main types of ‘outcome indices’:
• GHG emissions: emissions volumes and trends at various levels of governance including sub- and supra-national levels, and
within and across sectors.
• Proximate emission drivers: trends in the factors that drive emissions, distinguished through decomposition analyses, notably:
energy/GDP intensity and carbon/energy intensity (for energy-related emissions); indices of land use such as deforestation rates (for
LULUCF/AFOLU); and more sector-specific component drivers such as the floor area per capita, or passenger kilometres per capita.
• Technologies: developments in key low-carbon technologies that are likely to have a strong influence on future em…

Cross-Chapter Box 10 (continued)
from micro-level data evaluation, and inference from combining multiple lines of analysis, including expert opinion. Additionally, the
literature contains reviews, many of them systematic in nature, that assess and aggregate multiple empirical studies.
With these considerations in mind, multiple lines of evidence, based upon the literature, support a set of high-level findings, as
illustrated in Figure 1 in this Cross-Chapter Box, as follows.
1. GHG Emissions. There is robust evidence with a high level of agreement that mitigation policies have had a discernible impact on
emissions. Several lines of evidence indicate that mitigation policies have led to avoided global emissions to date of several billion
tonnes CO2-eq annually. The figure in this box shows a selection of results giving rise to this estimate.
As a starting point, one methodologically sophisticated econometric study links global mitigation policies (defined as climate laws
and executive orders) to emission outcomes; it estimates emission savings of 5.9 GtCO2 yr–1 in 2016 compared to a no-policy world
(Eskander and Fankhauser 2020) (Section 13.6.2).
A second line of evidence derives from analyses of the Kyoto Protocol. Countries which took on Kyoto Protocol targets accounted
for about 24% of global emissions during the first commitment period (2008–12). The most recent robust econometric assessment
(Maamoun 2019) estimates that these countries cut GHG emissions by about 7% on average over 2005–2012, rising over the period to
around 12% (1.3 GtCO2-eq yr–1) relative to a no-Kyoto scenario. This isconsistent with estimates of Grunewald and Martinez (2016) of
about 800 MtCO2-eq yr–1 averaged to 2009. Developing countries’ emissions reduction projects through the CDM (defined in Article 12
of the Kyoto Protocol) were certified as growing to over 240 MtCO2-eq yr–1 by 2012 (UNFCC 2021c). With debates about the full
Policies
Increase in number of mitigation policies implemente…

Cross-Chapter Box 10 (continued)
extent of ‘additionality’, academic assessments of savings from the CDM have been slightly lower, with particular concerns around
some non-energy projects (Section 14.3.3.1).
A third line of evidence derives from studies that identify policy-related, absolute reductions from historical levels in particular
countries and sectors through decomposition analyses (Le Quéré et al. 2019; Lamb et al. 2021), or evaluate the impact of particular
policies, such as carbon pricing systems. From a wide range of estimates in the literature (Sections 2.8.2.2 and 13.6), many evaluations
of the EU ETS suggest that it has reduced emissions by around 3% to 9% relative to unregulated firms and/or sectors (Schäfer 2019;
Colmer et al. 2020), while other factors, both policy (energy efficiency and renewable support) and exogenous trends, played a larger
role in the overall reductions seen (Haites 2018).
These findings derived from the peer-reviewed literature are also consistent with two additional sets of analysis. The first set concerns
trends in emissions, drawing directly from Chapters 2, 6 and 11, showing that global annual emission growth has slowed, as evidenced
by annual emission increments of 0.55 GtCO2-eq yr–1 between 2011 and 2019 compared to 1.014 GtCO2-eq yr–1 in 2000 and 2008.
This suggests avoided emissions of 4–5 GtCO2-eq yr–1 (see also Figure 1.1d). The second set concerns emissions reductions projected
by Annex I governments for 2020 in their fourth biennial reports to the UNFCCC. It is important to note that these are mostly projected
annual savings from implemented policies (not ex-post evaluations), and there are considerable differences in countries’ estimation
methodologies. Nevertheless, combining estimates from 38% of the total of 2,811 reported policies and measures yields an overall
estimate of 3.81 GtCO2-eq yr–1 emission savings (UNFCCC 2020d).
2. Proximate emission drivers. With less overt focus on emissions, studies of trends i…
listen up, climate policies have resulted in the avoidance of greenhouse gases and global emissions would be way higher had we done nothing
here is a wall of text from the IPCC report with evidence
www.ipcc.ch/report/ar6/w...
IPCC AR6 WG3 Chapter 14 Cross Chapter box 10 (14-43, line 39)
24.04.2025 21:37 — 👍 305 🔁 116 💬 6 📌 5
Every country is warming.
Every country is experiencing more extreme weather events because of climate change, mainly caused by burning fossil fuels. www.ShowYourStripes.info
Time to #ShowYourStripes and start climate conversations to prompt actions to reduce emissions, personally & collectively.
21.06.2025 16:23 — 👍 602 🔁 344 💬 13 📌 22
If you grew up in the UK in the 80s/90s, you should check you had all your vaccinations. I just checked and apparently I had a single measles vaccine as a baby and one dose of MMR later, which doesn't fully protect you. Just booked an MMR vaccination in a couple of weeks 🧪
19.06.2025 11:24 — 👍 14 🔁 6 💬 0 📌 0
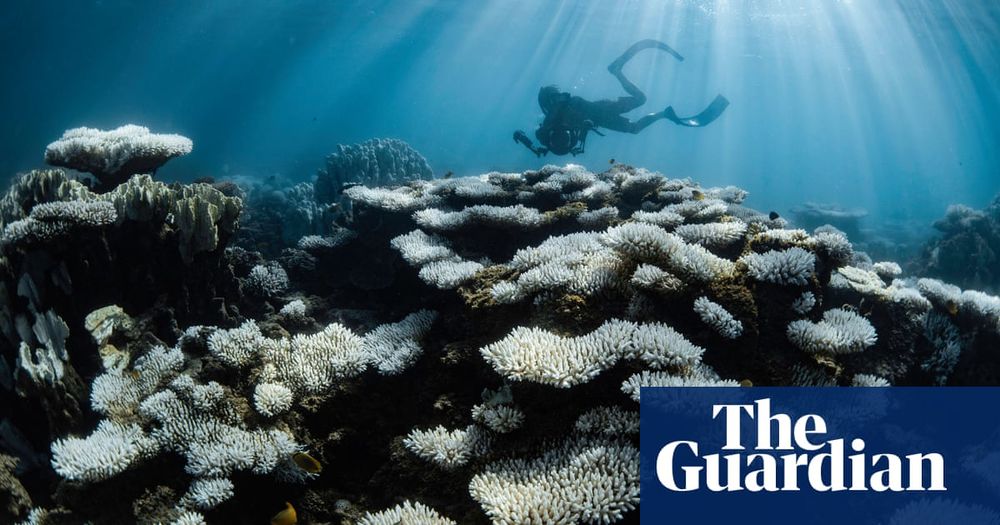
Earth is likely to cross a key climate threshold in two years
A new World Meteorological Organization report spells the end of the world’s most famous climate goal.
Earth will warm 1.5 degrees Celsius above preindustrial levels in just two years, new data shows. Irreversible tipping points — like the melting of Arctic ice sheets or the collapse of coral reefs — are closer at hand than previously believed.
04.06.2025 22:04 — 👍 4852 🔁 2413 💬 390 📌 313
Cuts have consequences, illustrated. As seen on TV 📺
03.06.2025 00:45 — 👍 23511 🔁 9466 💬 837 📌 1327
This is a core idea of The Serfdom of the Self, that we're all serfs on the digital land owned by companies who exist to extract value from us, while at the same time stripping us of any rights we have to protect ourselves (and avoiding as much tax as possible).
02.06.2025 12:58 — 👍 87 🔁 17 💬 2 📌 1

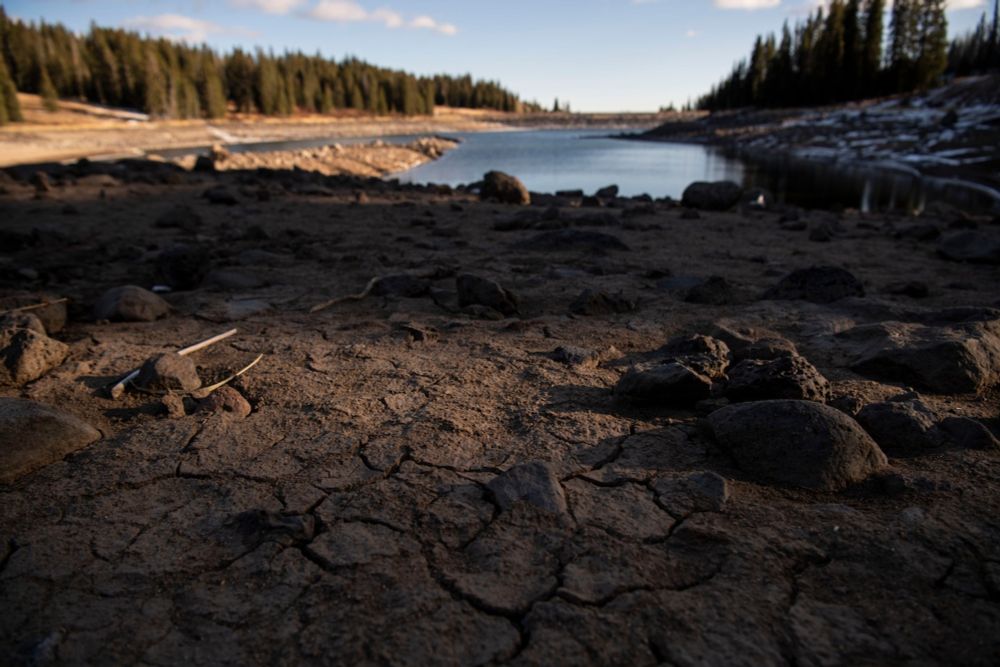
Why isn’t it raining?
One statistic helps us understand climate change—and why we are lurching from droughts to floods to droughts again
For every 1°C rise in global temperature, the water vapour held in the atmosphere increases by 7 per cent. So a warmer world will face both droughts and floods, writes @timsmedley.bsky.social.
www.prospectmagazine...
02.06.2025 12:49 — 👍 18 🔁 18 💬 1 📌 0
=
FINANCIAL TIMES
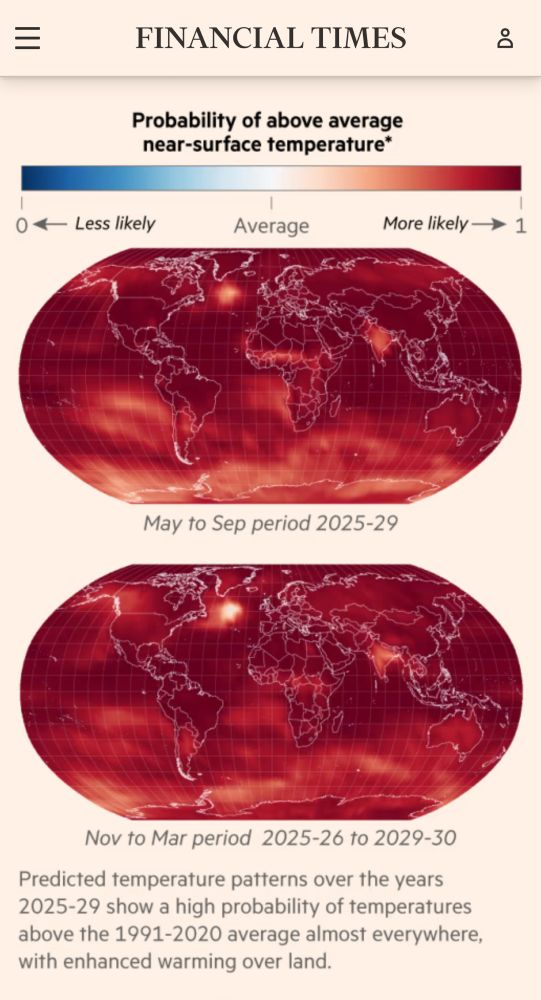
Probability of above average near-surface temperature*
0 4— Less likely
Average
More likely →> 1
May to Sep period 2025-29
Nov to Mar period 2025-26 to 2029-30
Predicted temperature patterns over the years 2025-29 show a high probability of temperatures above the 1991-2020 average almost everywhere, with enhanced warming over land.
Global average temperature is expected to rise to almost 2C above preindustrial in the next five years, according to the WMO, with falls in crop yields and more than a third of the world’s population being exposed to extreme heat.
People, I'm sorry but we have to deal with this. Later is too late.
28.05.2025 11:06 — 👍 1148 🔁 660 💬 46 📌 137
Naomi Klein suggests that the elites that have gathered around Trump share an understanding that they are bringing about the apocalypse. Any opposition to their nihilistic vision must coalesce around a future for this world.
27.05.2025 06:27 — 👍 358 🔁 136 💬 13 📌 35
Quite possibly the biggest climate story of the year (especially when we look back on this in a few years' time)
For the first time on record, China's emissions are falling due to clean energy growth, not slow power demand...
15.05.2025 06:17 — 👍 744 🔁 294 💬 11 📌 16
The text "Stories That Inspire: The 89 Percent Project" superimposed over sand in the desert. Click on post and scroll down for links to today's stories!
And we’re off! Covering Climate Now is proud to announce the launch, TODAY, of a new Joint Coverage Week, focused on the overwhelming majority of people globally who want governments to do more to fight climate change. #The89Percent
⬇️ Scroll down for today's stories! 👀
21.04.2025 21:14 — 👍 142 🔁 50 💬 35 📌 6

Europe ‘Frankly Insane’ To Keep Importing Fossil Fuels, Scientist Says
Experts have blasted both the EU and U.S. governments in response to a new report confirming that Europe is the world's fastest warming continent.
🚨NEW: Europe ‘Frankly Insane’ To Keep Importing Fossil Fuels, says @frediotto.bsky.social. There are dozens of stories about the new @copernicusecmwf.bsky.social climate report, so I thought I'd highlight something a little different.
15.04.2025 09:44 — 👍 180 🔁 81 💬 6 📌 10
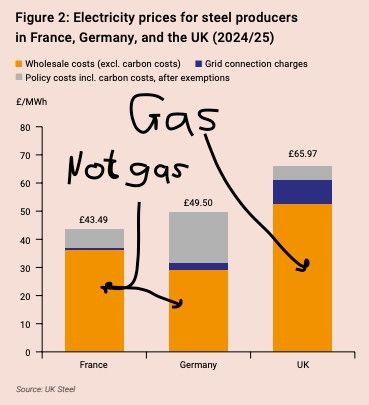
The crisis for UK steel is exposing another – perhaps even bigger – crisis for the UK
Our news media seems incapable of even the most basic factchecking
YES energy for UK steelmakers is costly
NO it's not due to net-zero
YES it is due to GAS
Here's what UK media isn't telling you🧵
14.04.2025 15:26 — 👍 686 🔁 362 💬 20 📌 26

Bluesky’s Quest to Build Nontoxic Social Media
X and Facebook are governed by the policies of mercurial billionaires. Bluesky’s C.E.O., Jay Graber, says that she wants to give power back to the user.
Profile of @jay.bsky.team & Bluesky!
"The platform is not yet populated enough to qualify as the internet’s new town square." -this metaphor persists but it's the age of 'community gardens' now. I hope they form around common shared values,not partisan identity...
www.newyorker.com/magazine/202...
07.04.2025 15:15 — 👍 131 🔁 31 💬 2 📌 2

Climate crisis on track to destroy capitalism, warns top insurer
Action urgently needed to save the conditions under which markets – and civilisation itself – can operate, says senior Allianz figure
The climate crisis is on track to destroy capitalism, a top insurer has warned, with the vast cost of extreme weather impacts leaving the financial sector unable to operate.
The world is fast approaching temperature levels where insurers will no longer be able to offer cover for many climate risks, said Günther Thallinger, on the board of Allianz SE, one of the world’s biggest insurance companies. He said that without insurance, which is already being pulled in some places, many other financial services become unviable, from mortgages to investments. Continue reading...
Climate crisis on track to destroy capitalism, warns top insurer
03.04.2025 09:51 — 👍 480 🔁 199 💬 56 📌 153

Piazza Europa
Piazza del Popolo, 15,30h.
Roma.
(Foto:La Repubblica)
15.03.2025 14:56 — 👍 629 🔁 198 💬 14 📌 22
About fifty years ago, NASA strapped a message in a bottle to a rocket and flung it into the deep dark
It wasn’t supposed to go this far, but it did. Long past its mission, it’s still out there so far away now that a simple hello takes a day to reach it, and another day to hear if it says hello back
12.03.2025 05:04 — 👍 1650 🔁 647 💬 33 📌 228
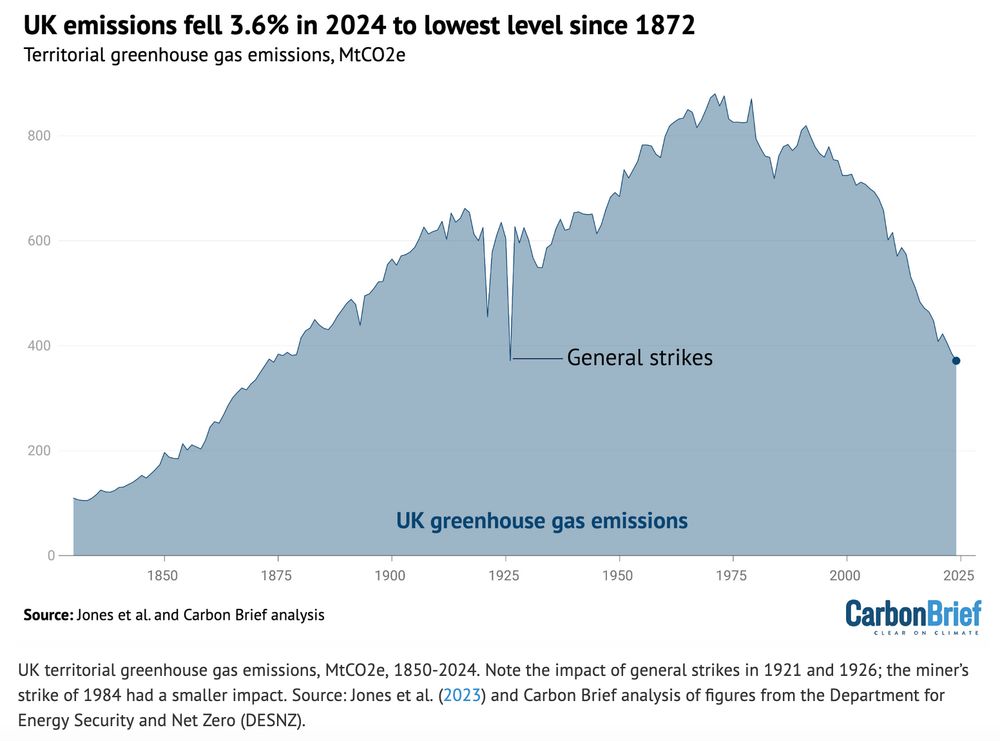
The news has been more than a bit grim of late, so hooray for @carbonbrief.org providing some genuine and really meaningful **good** news: the UK's carbon emissions in 2024 were the lowest since 1872, because demand for fossil fuels just keeps decreasing.
www.carbonbrief.org/analysis-uk-...
12.03.2025 22:47 — 👍 3255 🔁 772 💬 53 📌 58
I fear a great many journalists and even environmental orgs did not read the most recent IPCC report past the Summary for Policymakers. Here's why that is a big problem: that part of the report is the only one that is lobbied to hell and back by politicians. Saudi + US pushed CCS hype into it
12.03.2025 17:33 — 👍 188 🔁 75 💬 7 📌 9
Next time someone tells you that the energy transition cannot be done remember:
In 2012 almost 40% of UK electricity was coal.
Since 1 October 2024 it is zero.
This is the moment Britains last coal power plant shut down on 30 September - the end of 142 years of coal.
HT @neso-energy.bsky.social
11.03.2025 10:13 — 👍 332 🔁 83 💬 4 📌 5
To preserve our humanity, I think it's important to be offline more. The truth is we can get all the news we need in one or two sittings a day, and then decide what to do about it, one day at a time. Platforms like this one can be helpful, but like everything else in life, dosage matters!
06.03.2025 18:53 — 👍 1393 🔁 206 💬 21 📌 19
We’ll likely reach 2C of global warming by 2040s. Here’s what that looks like
02.03.2025 07:17 — 👍 37 🔁 15 💬 3 📌 0
What we’re witnessing in America is what happens when disordered discourse captures a political party, then the state itself. The Republican Party was the first to fall - abandoning truth for conspiracy, ideology for grievance, and policy for performative outrage.
28.02.2025 21:47 — 👍 10511 🔁 2858 💬 172 📌 344

How can I get involved?
13/ TLDR: there IS something you can do – and there IS still work to be done – to put a check on these channels spreading harmful misinformation.
Here’s 6 easy ways you can get started: stopfundingheat.info/how-can-i-ge...
26.02.2025 16:11 — 👍 3 🔁 2 💬 0 📌 0
“But Accu-Weather!!” They get their data from NWS. “But my local TV station has their own radar on a truck!” Sure, and they use it to fill small geographic gaps in the broader radar coverage that’s provided by NWS. “My weather app!” It’s getting its data from NWS.
28.02.2025 02:33 — 👍 628 🔁 193 💬 12 📌 4
Big news from The People's Pension: European asset managers will be rewarded for their more responsible approach to climate risk. Pensions will take £28bn will taken away from US asset manager State Street & brought over to Amundi & Invesco. Pension power!
27.02.2025 14:42 — 👍 16 🔁 10 💬 4 📌 0
PhD in History, fiction published by Sea Lion Press and original non-fiction research published by Historical Research.
Lecturer in History and Politics at a Nid-Tier University.
Energy/climate/carbon markets @ Compass Climate, Aotearoa-NZ. Mum, Ph.D ex quantum physicist. Climate stuff also on Linkedin. She/her. Posts deleted weekly-ish.
FT, E17, Unhedged podcast, gardening, making bread, plazzy Scouser, crap at charts, 6 Music Mum. I don't deserve my bad Uber rating and I never give investment advice - if it looks like I am, it's a scam.
Writer, journalist, filmmaker, professor. Pro-democracy advocate: Not capitulating. Author of Lee Harvey Oswald book, The Gunman & His Mother. Writing/publishing America, America on politics and society: America.substack.com
President of Signal, Chief Advisor to AI Now Institute
Postdoctoral oceanographer studying the ocean carbon sink 🦈🤿🕹️
🏠 @imev-mer.fr (CNRS-Sorbonne Université) as part of the Horizon Europe @tricuso.bsky.social project
💻 https://louisedelaigue.owlstown.net/
🚀 http://bit.ly/3HWFD5I
Survey research on public views of science & environment; climate change; human/environment interactions; society in the Arctic. Also: walking my dog through the woods, and gazing at the night sky. All graphs & photos are my own unless otherwise cited.
Climate | ocean | science policy & diplomacy | Copernicus Climate Change Service, @ECMWF | Partner to @edhawkins.org | ex 🐼 | Views own | 🌍 🌡🌊 🛰 🪸| Born on Wurundjeri Country | 🇦🇺🇬🇧🇪🇺 |
www.pulse.climate.copernicus.eu
The #CopernicusClimate Change Service (#C3S) & #CopernicusAtmosphere Monitoring Service (CAMS), implemented by @ecmwf.int on behalf of the European Commission.
⚡ Energy Expert
🎙 Host: Energy Capital Podcast
📜 Author: Texas Energy & Power Newsletter
🌎 Founder of Stoic Energy
www.douglewin.com
Science for safe & just #Climate future. Scientific Directors: Johan #Rockström, Ottmar #Edenhofer // Website EN: https://www.pik-potsdam.de/en, DE: https://www.pik-potsdam.de/de // All PIK social media channels: https://pik-potsdam.de/socials
Econ professor at Michigan ● Senior fellow, Brookings ● Intro econ textbook author ● Think Like An Economist podcast ● An economist willing to admit that the glass really is half full.
Reporter and writer: https://fallows.substack.com/ and https://www.ourtownsfoundation.org/ One-time speechwriter, long-time pilot, longer-time husband of linguist/writer Deborah Fallows. Note same wristwatch in the two photos, more than 50 years apart.
Climate Philanthropy • Former M.A. Peace Studies studying more-than-human rights and peacebuilding in Colombia at the University of Notre Dame • 🇸🇬🇺🇸🇨🇴🏴
Climate, Economy, Nature, People. Soy de Costa Rica. Based in Norway. Let's keep Bluesky #PuraVida.
Distinguished Fellow, ClimateWorks (only my views here). Board Director at Natural Resources Governance Institute. Own views.
www.monicaaraya.org
Paleoclimatologist and Arctic scientist. Currently associated with the World Climate Research Programme’s Office for Climate and Cryosphere at the University of Massachusetts in Amherst.
〰️ Mobilizing the voice of the workforce on climate policy
〰️ Led by @debmcnamara.bsky.social + founded by Bill Weihl
〰️ When employees speak, companies act
www.climatevoice.org
Deb McNamara is the Executive Director of ClimateVoice (@climatevoice.bsky.social), a nonprofit leveraging the power of corporate influence to win crucial policy battles. Her focus: social change + environmental protection non-profits for over 20 years.