“Instead of” there is doing a lot of work
If I were still teaching, I would be talking about how to use AI to make us better writers… E.g. giving us feedback or critique… But the mental muscles I went to train have to to be the students’
28.12.2025 22:25 —
👍 0
🔁 0
💬 1
📌 0
Ask copilot or chat gpt. It can output a csv no sweat.
06.12.2025 15:52 —
👍 1
🔁 0
💬 0
📌 0
Possibly. We might also admit some things are not very knowable— without other “ways of knowing”
28.11.2025 21:49 —
👍 4
🔁 0
💬 0
📌 0
I often hear researchers feeling bad about this. But it’s called prioritization. The key is to do it intentionally and strategically. You have finite time and can’t do everything.
28.11.2025 20:39 —
👍 4
🔁 1
💬 1
📌 0
On the one hand, people need better education about AI
On the other hand, do we even understand what it means to be conscious in the first place?
27.11.2025 16:56 —
👍 4
🔁 0
💬 1
📌 0
Ah, but read what I said. I’m not saying it’s impossible to do valid online research. I am saying that volume will need to shrink. It’s going to be harder to stay on top of this. Some folks will give up or mess it up. There will be an arms race. Reviewers will start raising flags. Etc.
19.11.2025 15:50 —
👍 0
🔁 0
💬 1
📌 0
The volume of social psych papers that ran on prolific and mturk is going to need to shrink soon, and that will have a big impact on a lot of small labs
19.11.2025 08:19 —
👍 6
🔁 2
💬 1
📌 0
A huge pain, but doable with undergrad participants essentially for free (or at least historically so).
I’m not saying what is right… I’m saying what is driving behavior
14.11.2025 09:04 —
👍 2
🔁 0
💬 0
📌 0
If we want this to change, then we need to make it feasible
TMP factor: Time, money, pain
Whether a study gets done depends a lot on how difficult it is. The question is one of ROI. I suspect many researchers are thinking to themselves, “that’s a great thing, but it’s not something I can do”
13.11.2025 16:01 —
👍 9
🔁 0
💬 2
📌 0

My 11-year-old sitting with her pile of Halloween candy, sorting it into a bar graph
We have progressed from data collection to data analysis.
01.11.2025 00:31 —
👍 34758
🔁 4123
💬 983
📌 366


ladies and gentlemen...we got him
30.10.2025 19:10 —
👍 18284
🔁 4054
💬 170
📌 185
* hoppening
10.10.2025 04:20 —
👍 1013
🔁 147
💬 12
📌 3
But where does 1a say anything about personhood? I’m reading it and it seems clear that you can’t restrict speech—and that would obviously apply to one or more people organized under a LLC. IMO the bigger question is “when is money free speech, vs when is it corruption”
04.09.2025 04:24 —
👍 1
🔁 0
💬 2
📌 0

Slide titled: "Assumptions of the model and model checking"
with a scatterplot with axes how much people should worry vs how much people do worry.
this slide is from a colleague's introductory stats course, I think it fits many statisticians' experiences
18.08.2025 00:31 —
👍 93
🔁 24
💬 8
📌 2
45. Academia doesn't reward building useful tools nearly as much as it should
28.07.2025 00:44 —
👍 35
🔁 4
💬 2
📌 1
14. We mostly evaluate latent variable models with the equivalent of Rorschach tests
27.07.2025 16:20 —
👍 11
🔁 1
💬 1
📌 0
5. You should use a precision-recall curve for a binary classifier, not an ROC curve
27.07.2025 13:42 —
👍 23
🔁 2
💬 1
📌 1
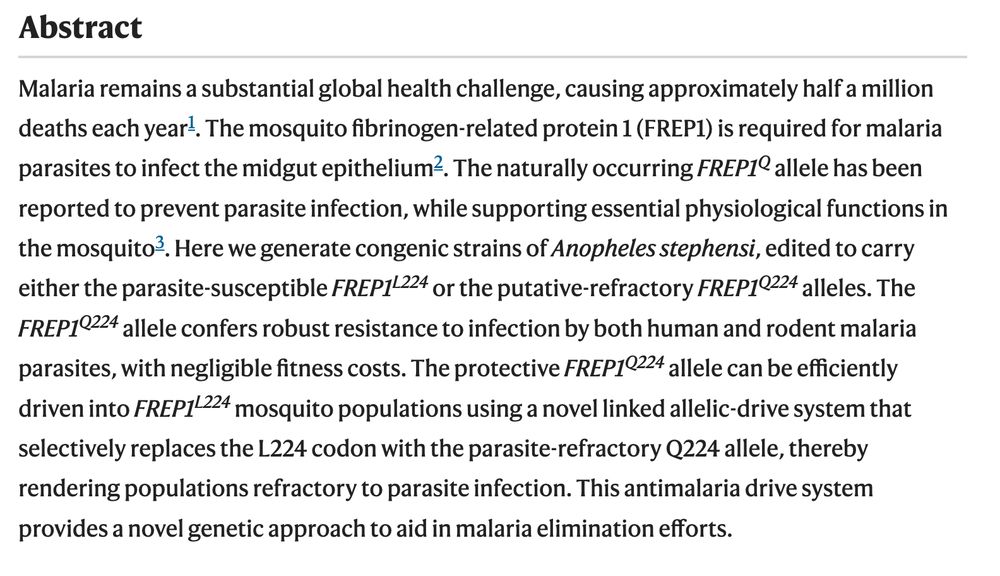
Wow. Scientists have edited mosquito DNA to prevent the spread of malaria to humans "while supporting essential physiological functions... and negligible fitness costs" to the mosquito population.
Potentially ending the mosquito-born spread of malaria to humans.
www.nature.com/articles/s41...
25.07.2025 15:23 —
👍 1089
🔁 310
💬 39
📌 44
… set of paths consistently supported by the data. Even getting that down is a trick. And making sense of it is fraught and doesn’t get you much further than one would get from regression. But at least then we would have some confidence we understand the correlational relationships!
23.07.2025 16:18 —
👍 0
🔁 0
💬 0
📌 0
… the model is correct and then gives you what the path would be under that specification. There’s nothing different when we go to SEM other than your ability to p-hack goes up exponentially. IMO this would be a great place to use machine learning approaches to train / tune models to find …
23.07.2025 16:18 —
👍 0
🔁 0
💬 1
📌 0
… all those hypotheses together (in the same way that ANOVA contest many multiple comparisons at once). There’s nothing different between this and running a bunch of regressions and claiming the results support the way you specified those models. In reality, it’s the reverse. Regression assumes …
23.07.2025 16:18 —
👍 0
🔁 0
💬 1
📌 0
Yes and see this a lot in social too. Proper use of SEM implies a particular philosophy of hypothesis testing in regression contexts. An omitted path is hypothesizing that path is exactly 0. A non-omitted path hypothesizing it is non-zero. Model fit is effectively the joint set of …
23.07.2025 16:18 —
👍 0
🔁 0
💬 1
📌 0
Yikes!
23.07.2025 03:52 —
👍 1
🔁 0
💬 1
📌 0
… SEM for causal discovery. However, if you have a good read on the causal process, it can be great for estimating parameters such as factor, loadings or paths with latent variables
23.07.2025 03:35 —
👍 5
🔁 0
💬 0
📌 0
This is probably not anything you don’t already know …. But I did a lot of SEM work and will repeat it anyway. The model assumes you know the causal structure. Fit indices will confirm that the model is a fit to the data, but many incorrect models can fit the data. So I would not use …
23.07.2025 03:34 —
👍 9
🔁 1
💬 2
📌 1
Curious how this compares to the cost of living per state
19.07.2025 20:27 —
👍 2
🔁 0
💬 0
📌 0
09.07.2025 05:30 —
👍 6
🔁 0
💬 0
📌 0
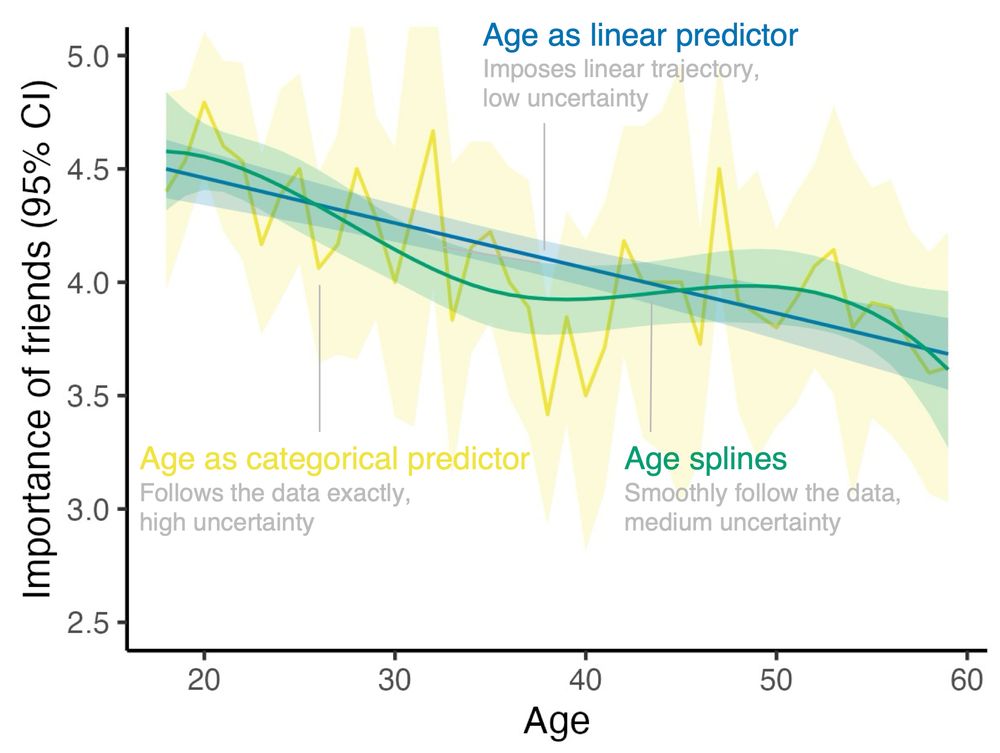
Plot that depicts the average importance people in my data assign to their friendships (y-axis, on a scale from 1 to 5, depicted with 95% confidence intervals) by their age (x-axis, from 18 to 60).
Depicted are 3 different ways to model importance of friends as a function of age.
Using age as a linear predictor: this imposes a linear trajectory which comes with very tight confidence intervals (i.e., uncertainty is low).
Using age as a categorical predictor: this imposes no trajectory whatsoever but instead simply reproduces the means by age. The confidence intervals are very wide, in particular for those ages not well represented in the data (i.e., uncertainty is high).
Age splines: This results in a smooth trajectory that follows some of the bumps in the data, but not all of them. The confidence intervals are somewhere between the linear and the categorical case (i.e., uncertainty is medium)
Let's say you want to include age as a predictor in your model. How do you do that?
Here's an illustration of three options -- it's for a paper I'm working on (so if you feel like anything could be tweaked...).
08.07.2025 12:03 —
👍 158
🔁 29
💬 33
📌 2
There should be a corner at Home Depot where a guy with a table saw will slice you off custom lengths of hot dog from an infinite hot dog coming out of the wall
05.07.2025 00:15 —
👍 4133
🔁 615
💬 86
📌 56

Adele shattering a glass in her hand
There were two girls at Wawa just now talking about funny movies and one said, “Have you ever seen the movie Office Space? It’s an old people movie but it’s funny”
25.06.2025 01:10 —
👍 6868
🔁 372
💬 413
📌 62