Zillow’s climate risk reversal looks like a setback. It’s really a wake‑up call.
When private models sow confusion, it’s a flashing warning sign that Washington needs to fix federal flood maps,
Zillow’s climate score rollback is a wake-up call: build open, future‑conditions federal flood maps -- gold‑standard, trustworthy data for building codes, mortgages, and our future. Column today: open.substack.com/pub/susanpcr...
03.12.2025 13:44 — 👍 135 🔁 61 💬 2 📌 9
A reminder, in light of that NYT story today, about skill and spread across climate analytics providers:
Getting good climate info in the hands of individuals would be highly valuable. Just not convinced we're actually there yet.
30.11.2025 20:19 — 👍 30 🔁 10 💬 0 📌 3
Consulting* with experts, of course.
30.11.2025 20:04 — 👍 1 🔁 0 💬 0 📌 0
Better yet: consisting with experts who know the local conditions and have the experience to interpret, adapt, and translate “global-scale” climate risk outputs to locally reliable information. Modeling quality is one, local applicability is another. Above all, honest communication is essential!
30.11.2025 19:53 — 👍 1 🔁 0 💬 1 📌 0
IMO - this should become part of any regular due diligence in the real estate business. Of course, accurate information is important, but climate risk models are hard to interpret, subject to large uncertainties, and risks hard to communicate (probability vs risk vs occurrence vs intensity).
30.11.2025 19:53 — 👍 1 🔁 0 💬 1 📌 0
As both banks and insurance industry will start to use v granular information for their decision making, too, (which will impact people living or buying in the most vulnerable places most), it is becoming increasingly important for individuals to be informed on climate risks.
30.11.2025 19:53 — 👍 2 🔁 0 💬 1 📌 0

Zillow Removes Climate Risk Scores From Home Listings
The discussion on accuracy here is somewhat moot. I find it most intriguing that this information does seem to go into and does impact individual customer decision making and even house sale price (paper here www.nber.org/papers/w33119).
www.nytimes.com/2025/11/30/c...
30.11.2025 19:53 — 👍 2 🔁 0 💬 1 📌 0
New text @cop30brazil.bsky.social provides a glimpse of where #COP30 might land.
Some reflections on references to science and evidence. /1
unfccc.int/sites/defaul...
22.11.2025 15:42 — 👍 11 🔁 11 💬 1 📌 0

A line graph shows the time series of Arctic mean surface temperature anomalies for each October from 1850 through 2025. There is a long-term increasing trend and large year-to-year variability. The mean surface temperature anomaly in October 2025 was 3.78°C for this region. Anomalies are computed relative to a 1910-2000 climate baseline. All data is from NOAA/NESDIS/NCEI NOAAGlobalTemp v6.0.0 on this graphic.

A line graph shows the time series of Antarctic mean surface temperature anomalies for each October from 1850 through 2025. There is a long-term increasing trend and large year-to-year variability. The mean surface temperature anomaly in October 2025 was 1.43°C for this region. Anomalies are computed relative to a 1910-2000 climate baseline. All data is from NOAA/NESDIS/NCEI NOAAGlobalTemp v6.0.0 on this graphic.
Was there any coverage of the recent record warmth in both the Arctic and Antarctic? Multiple global datasets now confirm these records, and I think it's really quite striking.
Here's some very quick plots showing NOAAGlobalTempv6 data from October too. And see my earlier posts.
22.11.2025 02:20 — 👍 270 🔁 143 💬 10 📌 13
Happy to share our experience organizing the 2022 Firn Workshop! @tridatta.bsky.social
07.11.2025 07:54 — 👍 0 🔁 0 💬 0 📌 0
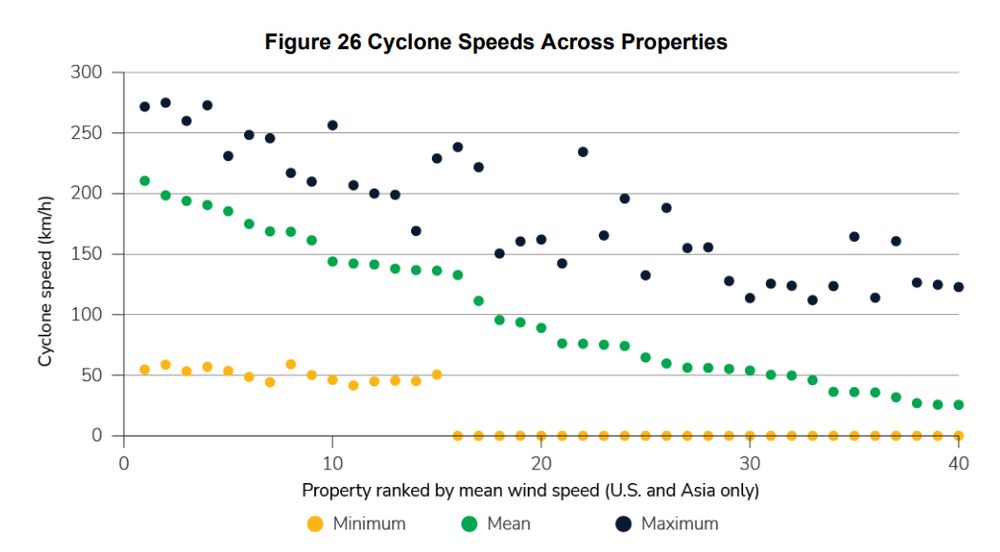
Assessing future cyclone speeds at the same location across climate analytics vendors. For the same spot, high risk properties range from sub-tropical storm to Cat 5.
Absolutely fantastic study comparing anonymized outputs of climate analytics models.
Everyone loves to bag on flood (rightly so), but can we talk about how the spread here is "30mph breeze to Cat 5 hurricane" www.fca.org.uk/publication/... HT @ruarirhodes.bsky.social
24.10.2025 18:09 — 👍 49 🔁 17 💬 4 📌 4
environmental seismologist - doctor of glacier vibes - geoscience educator - she/her - opinions only my own - puns only my worst - www.crlabedz.net
International Hydrology and Water Resources | Elevation models | Mapping | Landscape, Groundwater and Ecohydrological Systems Analyses
Helps making useful information out of data.
Loves and promotes #OpenData.
Open to requests but no promises on the results.
In English and Nederlandsch.
https://datagraver.com
I run a newsletter/podcast called Volts about clean energy & politics. Subscribe & join the community at http://volts.wtf!
Menswear writer. Editor at Put This On. Words at The New York Times, The Washington Post, The Financial Times, Esquire, and Mr. Porter.
If you have a style question, search:
https://dieworkwear.com/ | https://putthison.com/start-here/
Rich Pancost, Earth Scientist at the University of Bristol. Interested in past climates and earth system processes, from peatlands to the deep sea. First gen/ working class. Privileged white cis male. Anti-racist, pro LGBTQ+, unapologetically woke. He/Him
Climate scientist, professor of Physics of the Oceans in Potsdam. Opinions my own.
Associate Professor at the Niels Bohr Institute, University of Copenhagen. Interested in ice, climate, sea level, and extreme events. 🧪 ❄️ 🌊 🌀 🥼 🌡️
Dad of two teen girls, and one toddler boy.
Also on mastodon here: @agrinsted@fediscience.org
I am a climate scientist, focused on paleoclimate, sea level change and the evolution of Quaternary glaciations.
I reconstruct ice sheets using glacial isostatic adjustment and ice sheet modelling. In Japan but have been all over the place. 🇨🇦🇯🇵🇦🇺🇩🇪🇸🇪
Solid-earth deformation, geodesy, ice sheets, and sea level. Director of the Australian Centre for Excellence in Antarctic Science. Professor at U Tasmania. Comments mine. Host of Geodesy Feed - like and pin for geodesy content. Flawed follower of Jesus.
Research & teaching on Glaciers, Geohazards, Geomorphology, Climate Change at University of Dundee | https://www.dundee.ac.uk/people/simon-cook
Glaciologist at the University of Idaho; supporter of Wrangell Mountains Center
Committed to enabling actionable projections of sea level rise for adaptation planning
http://tbartholomaus.org/
Glaciologist @ NASA/GSFC. Earth’s ice is great. Let’s keep some around. Views my own. He/him. 👨👩👧 🐶 🐶 🐈 🧊 🇬🇧 🇨🇦 🇺🇸 🇬🇱 🇦🇶
Glaciology jack of all trades. Ice mud and satellite botherer at Liverpool Uni. He/him ❄️🛰️🏳️🌈
Antarctica and all things ice sheets ❄️ sea level rise; Earth systems science; bushwalking, birds, bikes and adventures. Senior Lecturer at Monash University. CI on ARC SAEF 🇦🇶 Views my own
🧪geek who ❤️ 3 big science M’s = minerals, microbes, microscopes
I study biogeochemical cycles, polar processes, climate change
I work in 🇩🇪🇮🇸🇳🇴🇬🇱 on 🌎💎🧊❄️🦠🧬🔬⚗️
I ❤️all📚and am a speed reader
https://www.gfz-potsdam.de/en/section/interface-geochemistry/overview/
Professor of Glaciology at Scripps Polar Center, UC San Diego
https://bsky.app/profile/scrippsocean.bsky.social
Studies Antarctica with satellites
🇦🇶🛰️🧊
Graduate of @UCL & @UTAS
Happy to be safely on Bluesky
❄️❄️❄️
Climate scientist specialising in ice cores, Antarctica and glaciology. Interested in science and how we use it to navigate our place in the universe. Adjunct Professor at U. Tasmania.
Glaciologist at University of Bristol, loves ice, meltwater, dirt, microbes and inventing new ways to measure them
Professor of Earth Observation and glaciology at University of Bristol and Technical University Munich. Open Access advocate, sports fanatic, European.