Link to article⬇️
doi.org/10.1111/sum....
11.02.2026 19:17 — 👍 1 🔁 1 💬 0 📌 0
Link to paper⬇️
doi.org/10.1111/sum....
11.02.2026 19:14 — 👍 0 🔁 1 💬 1 📌 0

***NEW*** #OpenAccess
Long-Term Organic Inputs Effects on Soil Carbon and Nitrogen Sequestration in a Temperate Agroecosystem
Munna & Lal
#SoilScience #soil
doi.org/10.1111/sum....
10.02.2026 09:44 — 👍 0 🔁 0 💬 0 📌 0

Number of EGD strategies addressing soil threats. Source: own elaboration.
***NEW***
Between Policy Ambition and Legal Fragmentation: Soil Protection in the EU After the European Green Deal
Susanna Paleari
#soil #soilscience @wileyecology.bsky.social
doi.org/10.1111/sum....
(Image shows the number of EGD strategies addressing soil threats)
03.02.2026 09:57 — 👍 2 🔁 0 💬 0 📌 0

Show us your #SoilScience! The call for abstracts for the 2026 Soil Science Australia National Conference is now open and will close 24 April 2026. The submission process is simple. conference.soilscienceaustralia.org.au
02.02.2026 02:20 — 👍 4 🔁 3 💬 1 📌 0

Known mechanisms of P-solubilisation through PSB inoculation.
***NEW***
Phosphate-Solubilising Bacteria and the Phosphorus Crisis: Mechanisms, Applications, and Future Prospects
Balkrishna, Verma, Sahu, Kumar Singh & Arya
#soil #soilscience
doi.org/10.1111/sum....
27.01.2026 13:35 — 👍 5 🔁 2 💬 1 📌 0

Total nitrogen (Total-N) stocks by soil layer and land use in the southeastern Amazon. (A) Stocks in each 100 cm layer; (B) cumulative stocks to 800 cm. Mean values from n = 9 (forest), 5 (deforested), 9 (single crop), 9 (double crop) ± standard error at 0–200 cm. Mean values from n = 7 (forest), 3 (deforested), 7 (single crop), 7 (double crop) ± standard error at 300–800 cm. The same lower-case letters within the same soil layer do not differ by Tukey's test (p > 0.05). nsnon-significant differences according to the ANOVA test (p > 0.05).
***NEW***
Legacy of Land Use: Deep Soil Nitrogen Accumulation Driven by Deforestation and Agriculture in the Southeastern Amazon.
Popin, de Resende, Siqueira-Neto, Huddell, Jankowski et al.
@woodwellclimate.bsky.social
#soil #soilscience
doi.org/10.1111/sum....
26.01.2026 10:49 — 👍 4 🔁 1 💬 0 📌 0

Mean weight diameter (MWD) for the different age categories at two soil depths. Letters indicate significant differences within each depth (Tukey HSD, p < 0.05). The Age × Depth interaction was significant (χ2 = 42.88, p < 0.001), indicating age effects between depths. At 0–15 cm, pasture (a) differed significantly from 81 to 160-year woodlands (b); groups sharing letters (ab) did not differ significantly from either. At 15–30 cm, no significant pairwise differences were detected (all groups share letter ‘a’). The violin plots show the probability density of the data; overlaid box plots display the median and interquartile range.
***NEW*** #OpenAccess
Long-Term Effects of Woodland Creation on Soil Carbon Stocks and Aggregate Distribution in Central Scotland
Azevedo, Vanguelova, Ashwood et al.
@forestresearchuk.bsky.social #soil #soilscience
doi.org/10.1111/sum....
13.01.2026 17:35 — 👍 0 🔁 0 💬 0 📌 0

New Anniversary Editorial
Thank you to our authors, editors, and readers! Soil Use and Management turns 40—and it’s all thanks to the global soil science community.
Soil Use and Management #soil #SUM40 #soilscience
Discover the highlights.
https://ow.ly/PU8P50XNc0a
05.01.2026 14:25 — 👍 1 🔁 1 💬 0 📌 0

Alpha (left) and beta (right)-multifunctionality. Alpha-multifunctionality is measured by the inverse of the Simpson's diversity index and represents the diversity of soil function supply at the LUCAS locations. Beta-multifunctionality is measured by the total-based dissimilarity between all sites within the NUTS3 region and the LUCAS point. The colours for beta show the unique supply of soil function relative to the NUTS3 supply of functions, between one and five functions. The colours indicate the number of functions supplied at a high level, between one and five functions. The background colour refers to the environmental zones of Metzger et al. (2012).
***NEW*** #OpenAccess
Modelling of Soil Multifunctionality Across Europe
Wadoux, Debeljak, Lagacherie & Creamer
@rachelcreamer.bsky.social @sbl-wur.bsky.social
doi.org/10.1111/sum....
05.01.2026 12:15 — 👍 2 🔁 0 💬 0 📌 1
New Anniversary Editorial
From acidification to soil health, Soil Use and Management has tackled the biggest challenges in soil science. Join us in celebrating four decades of impact!
#soilscience #soil #SUM40
🔗 https://ow.ly/43KE50XKzy6
22.12.2025 14:25 — 👍 1 🔁 1 💬 0 📌 0

N2O emissions from lysimeters over the period of the experiment. (a) Daily N2O fluxes; (b) total N2O emissions. The vertical bars indicate the standard error of the mean (SEM), n = 4. Stars above the bar indicate whether the difference between subsoiling (SS) and non-subsoiling (NS), or between subsoiling + urine (SSU) and non-subsoiling + urine (NSU) (*p < 0.05, **p < 0.01, ***p < 0.001).
***NEW** #OpenAccess
Subsoiling Combined With Winter Active Italian Ryegrass Can Reduce Nitrous Oxide Emissions Without Increasing Nitrate Leaching: Evidence From Lysimeter and Field Plot Trials.
Liu et al.
#soil #soilscience
doi.org/10.1111/sum....
18.12.2025 18:03 — 👍 0 🔁 1 💬 0 📌 0
New Anniversary Editorial
Celebrating 40 years of Soil Use and Management! From practical roots to global impact, @sumjournal.bsky.social continues to shape soil science. Explore the journey.
Celebrating 40 years of Soil Use and Management! From practical roots to global impact, Soil Use and Management continues to shape soil science.
Explore the journey: https://ow.ly/600550XAMQ8
#soil #soilscience #SUM40
02.12.2025 17:30 — 👍 1 🔁 1 💬 0 📌 0
New Anniversary Editorial
40 years of Soil Use and Management 40 landmark papers. The “40@40” collection showcases the evolution of applied soil research. Discover the highlights.
#soil #soilscience #SUM40
➡️ https://ow.ly/jV3M50XGmJT
09.12.2025 19:00 — 👍 1 🔁 1 💬 0 📌 0

📢📢We are delighted that our Special Issue '40@40' celebrating our 40th anniversary is now available. The 40 selected papers and accompanying editorial reflect the changes in applied soil science across our 4 decades of publication📢📢
doi.org/10.1111/sum....
doi.org/10.1111/sum....
26.11.2025 10:03 — 👍 0 🔁 0 💬 0 📌 0

***NEW*** #OpenAccess
The Effect of Long-Term Underlying Management on Soil Faunal Communities of a Newly Established Herbal Ley.
Cannon, Booyse, Murray & Crotty.
@ejsoilscience.bsky.social
#soil #soilscience
doi.org/10.1111/sum....
14.11.2025 09:51 — 👍 0 🔁 0 💬 0 📌 0

Is biochar production the answer to biosolid reuse? at University of York on FindAPhD.com
PhD Project - Is biochar production the answer to biosolid reuse? at University of York, listed on FindAPhD.com
Does converting #biosolids to #biochar maintain their benefits as a #soil amendment whilst minimising any residual risk due to #contaminants? We are recruiting to a #NERC Ecosolutions #PhD. Please share and DM me for more information if interested. shorturl.at/ldwVW
31.10.2025 09:07 — 👍 3 🔁 1 💬 0 📌 0

Schematic representation of the relationship between post-normal science with professional consultancy and applied science (adapted from Funtowicz and Ravetz 2003).
***NEW COMMENTARY***
Transdisciplinary Research May Be Hindering Rather Than Fostering Progress and Policy-Making: Discussion With Examples in Soil Research.
Philippe C. Baveye
#soil #soilscience
doi.org/10.1111/sum....
24.10.2025 09:09 — 👍 0 🔁 0 💬 0 📌 0
🧑🌾 Into soil science & land planning?
📍 Cranfield Uni | Nov 12–13
Intro to Agricultural Land Classification (ALC) course by the British Society of Soil Science (BSSS) is happening!
Only 9 spaces left!
🗓️ Register here: soils.org.uk/events/intro...
#soilscience #BSSS #Planning #ALC
13.10.2025 10:25 — 👍 4 🔁 2 💬 1 📌 0
Photo by Melissa Askew on Unsplash
***NEW*** #openaccess
How a Decade of Different Tillage Intensity Influences Yield Response to Seasonal Weather Variations.
Cannon & Rial-Lovera
#soil #soilscience
doi.org/10.1111/sum....
09.10.2025 10:22 — 👍 0 🔁 1 💬 0 📌 0
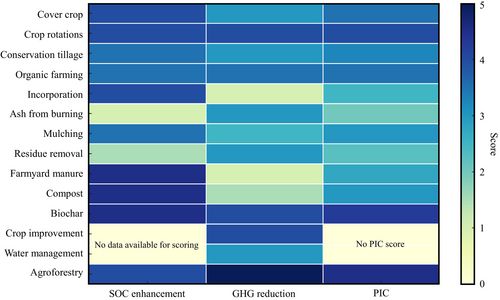
Heat map illustrating the effectiveness of various soil management practices in terms of soil organic carbon (SOC) enhancement, greenhouse gas (GHG) reduction and their aggregated practice impact coefficient (PIC). Pale yellow cells indicate ‘no data available for scoring’.
***DID YOU MISS THIS PAPER?***
A Critical Review of Regenerative Soil Management: A Novel Scoring System for SOC and GHG Emissions in Southeast Asia
Udomkun, Rupngam, Müller, Masso, Boonupara & Kaewlom
doi.org/10.1111/sum....
#soil #soilscience
07.10.2025 11:33 — 👍 1 🔁 0 💬 0 📌 0

Schematic of temporal dynamics of topsoil structure and hydrology: (a) post-tillage, (b) post-flood, and (c) vegetated. The middle circle represents the soil water retention potential.
***NEW*** #OpenAccess
Spatial and Temporal Variations in Arable Soil Structure and Hydrology Affect the Functioning of Nature-Based Solutions for Flood Mitigation
Roberts, Wilkinson, Geris & Hallett
#soil #soilscience
doi.org/10.1111/sum....
02.10.2025 13:11 — 👍 0 🔁 0 💬 0 📌 0

📢IN THE NEWS📢
New field test shows how farming reshapes underground life - A simple research tool links soil pore networks to respiration, offering fresh insights into soil health.
Read the full article⬇️
seedquest.com/news.php?typ...
...and the paper⬇️
doi.org/10.1111/sum....
#soil #soilscience
30.09.2025 10:54 — 👍 1 🔁 1 💬 0 📌 1

(Left) Unsegmented image and (right) the corresponding segmented image.
***NEW*** #OpenAccess
3D Image-Based Pore-Network Simulations to Analyse Soil Pore Architecture Variations due to Wetting and Drying Cycles
Pires, Lin & Ghanbarian
#soil #soilscience
doi.org/10.1111/sum....
28.09.2025 11:20 — 👍 2 🔁 0 💬 0 📌 0
📢New paper: Innovative field macropore test can accurately track soil health. Infiltration matched with X-ray scans and measurements of soil respiration reliably captures differences in soil structure and function.
Full story 👇
www.rothamsted.ac.uk/news/new-fie...
25.09.2025 08:36 — 👍 5 🔁 3 💬 1 📌 0

Predictions of changes in total soil organic carbon (SOC) stocks in mineral soil (thick lines, coefficients and p values from Figure 4c) and peat soil (thin lines, coefficients and p-values from Figure 4b) along the chronosequence, at sites with low (orange lines) or high (solid blue lines) topographic wetness index (TWI). Total SOC was calculated at: (a) fixed depth of 60 cm, (b) fixed soil mass of 200 kg m−2, and (c) fixed ash mass of 200 kg m−2. Low and high TWI correspond to the first and third quartile of all the TWI values (5.23 and 11.73, respectively). Dotted, dashed and solid lines respectively indicate that the TSC effect was not significant (p > 0.1), marginally significant (0.05 < p < 0.1), or significant (p < 0.05).
***DID YOU MISS THIS PAPER?*** #OpenAccess
Long-term #soil organic carbon changes after cropland conversion to grazed grassland in Southern Sweden.
Johansson, Livsey, Guasconi et al.
@ejsoilscience.bsky.social
doi.org/10.1111/sum....
15.09.2025 11:50 — 👍 5 🔁 5 💬 0 📌 0

***NEW*** #OpenAccess
Change in Soil Macroporosity With Land Use and Its Effect on Soil Respiration
Rickard, Zhang, Hossain, Mooney, Crawford, Neal & Whalley
@ejsoilscience.bsky.social
@rothamsted.bsky.social
#soil #soilscience
doi.org/10.1111/sum....
11.09.2025 10:13 — 👍 1 🔁 2 💬 0 📌 0
Feed your curiosity in #sustainableagriculture, #ecology, #environmentalscience, #plantscience, and #geography. We’ll help you build your career, get published, and access the latest research. What will you discover?
M.Sc. Graduate, KNT University
Remote Sensing | Photogrammetry
---→ Environmental Monitoring, Forest Ecology, Wildfire, UAV Photogrammetry, Bundle Adjustment, Canopy Cover
#RemoteSensing #Photogrammetry #UAV #Drone #DeepLearning #GIS
We study soil-plant interactions to make farming more regenerative and sustainable. More info here: https://www.soil-plant.com/
🇪🇺 EU Project: Environmental Analysis and Resilience for Transformative Human-Optimised Natural Environments
👉 https://earthone-project.eu/
Associate professor, soil microbiology, Sultan Qaboos University
Post doc in political science University of Gothenburg.
Behavioral public policy, conservation policy, transparency, behavior change, open science
www.patrikmichaelsen.com
EU4Advice is a Horizon Europe-funded project to boost short food supply chains across Europe.
Website: https://www.eu4advice.eu/
Head gardener and neglectful allotmenteer in Aberdeen, Scotland. Knits and sleeps a lot.
• regen market grower
• ecology
• built environment
Forester & tree farmer
🌲🌳👨🏽🌾🐂🥜🥭🪵
Inclusive landscape scale solutions
Regenerative bioeconomy
Sustainable cities
Works with the amazing Inovaland team
Lives in Edinburgh
Agriculture and Food Business Management Group at the University of Göttingen & Faculty of Agricultural Sciences
Website: https://www.uni-goettingen.de/de/655593.html
MIBIREM is an EU project, specialising in developing a microbiomes-based toolbox for soil remediation of contaminated sites.
MIBIREM is a Horizon Europe project. @HorizonEU GA 101059260
For more details see: www.mibirem.eu
We are a research lab at Western University, Canada studying soil biodiversity.
The Oxford Nature Network is a network of researchers & practitioners in & around the University working on biodiversity. www.nature.ox.ac.uk/
Our talks in person & online: https://bookwhen.com/oxfordbiodiversitynetwork
Associate Profesor in Soil Science & Agricultural Chemistry area at @ETSIIAAPalencia @YoungForesters. Mumx2
🇧🇷 Living in 🇳🇱 | Ph.D. candidate at NIOO-KNAW | Soil microbial ecologist 🦠🧬👨🏼💻 (He/Him)
PhD researcher at ICA-CSIC. Soil organic carbon, crop yield and sustainable agriculture.
Collaborative Research in https://glten.org/experiments/381
Social media https://www.facebook.com/profile.php?id=61558335688672&sk=grid
We build sustainable future and well-being from renewable natural resources.
Rakennamme hyvinvointia ja kestävää tulevaisuutta uusiutuvista luonnonvaroista.
www.luke.fi
Land steward, Soil Scientist, Agronomist, Soil and Water conservationist and general overall nature lover.