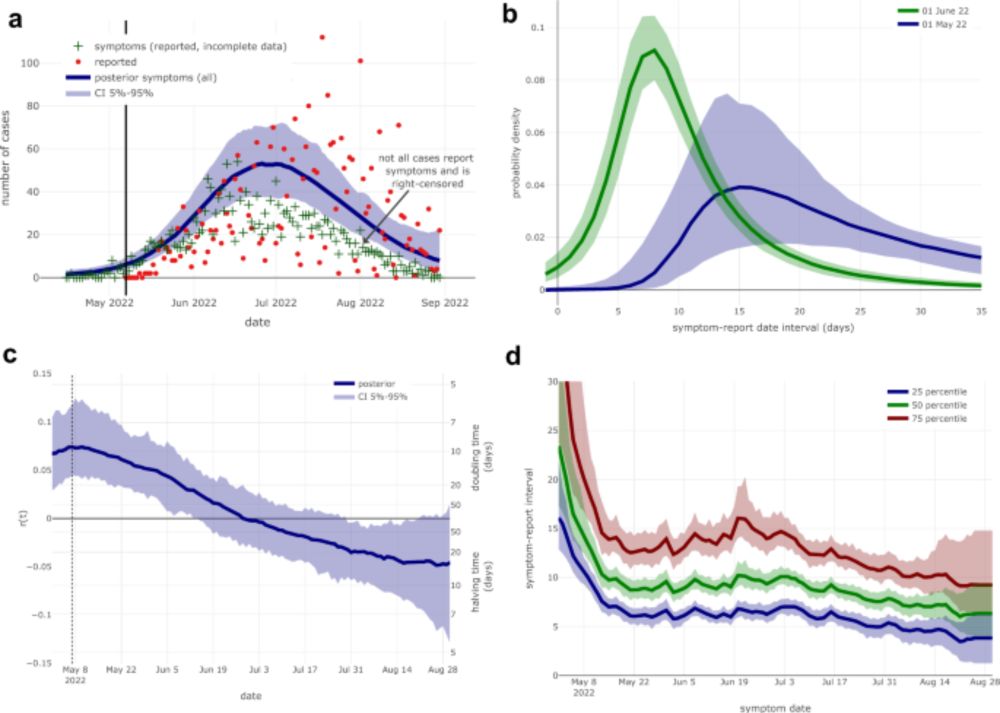
Want to build an interactive dashboard so others can explore epidemic scenarios? For COVID, @ngdavies.bsky.social spearheaded a great drag-and-drop approach, which made use of the JavaScript-based nature of RShiny... 1/
08.10.2025 09:44 — 👍 32 🔁 10 💬 2 📌 1
"I have long felt that the risks of sharing your data - the possibility that your information will fall into the hands of people who are up to no good - are given far more prominence that the potential rewards in the form of advances in medicine."
25.06.2025 08:35 — 👍 1 🔁 0 💬 0 📌 0
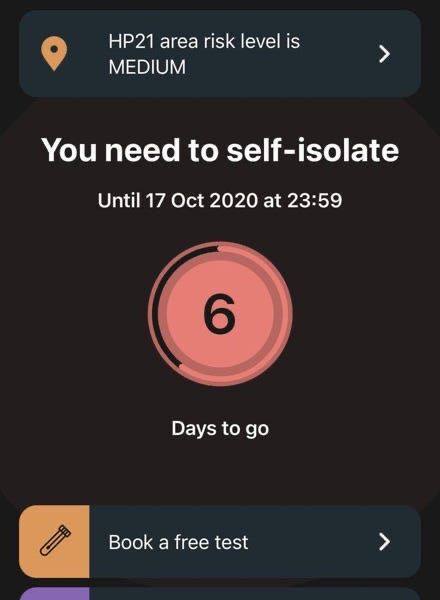
The Truth About the Covid App
Myths about its cost and effectiveness stop us learning lessons
open.substack.com/pub/rorycell... This post about the importance of knowing the difference between truth tellers and myth makers in healthcare has already attracted a comment from a member of the “plandemic” community which nicely makes my point about the dangers of disinformation
15.05.2025 10:56 — 👍 119 🔁 16 💬 5 📌 0
Right? Maybe there are good reasons for the scheduling, and only a small minority of us working part/flexi hours and not using after school clubs. But if we had been considered even for a moment I would expect them to at least offer a recording, and I can’t see one mentioned…
27.02.2025 12:59 — 👍 0 🔁 0 💬 0 📌 0
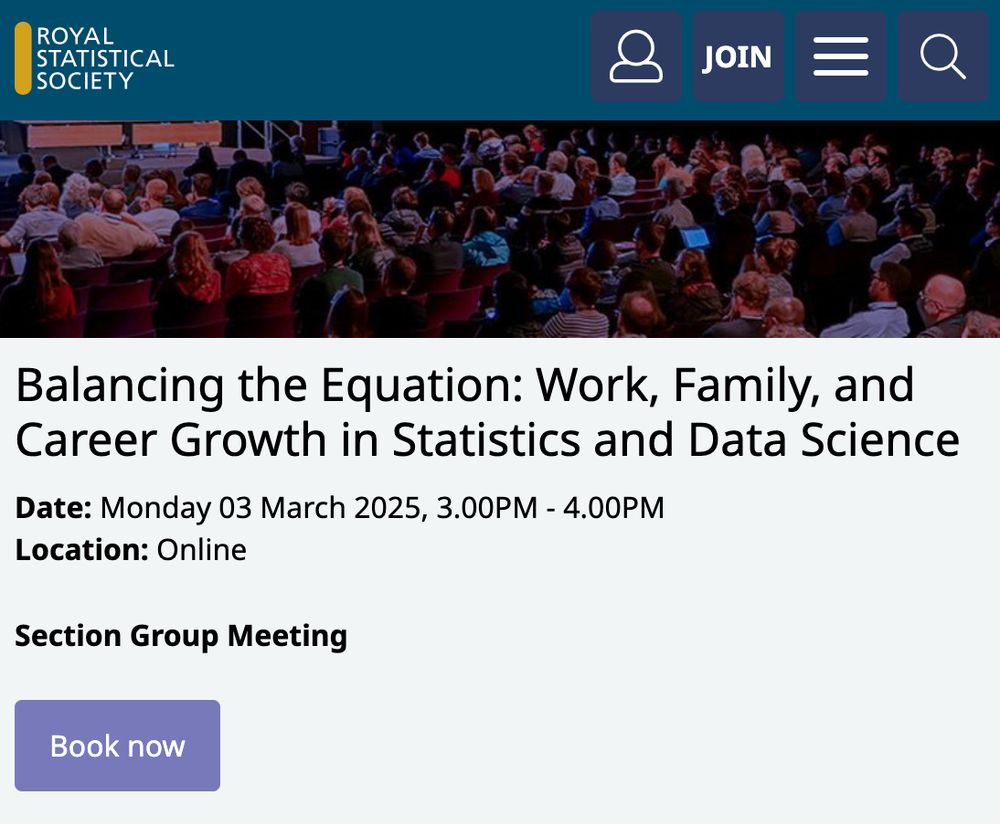
Screenshot of details for a Royal Statistical Society event, titled "Balancing the Equation: Work, Family, and Career Growth in Statistics and Data Science". It is scheduled for Monday 3 March from 3 to 4pm.
🪧 What do we want? 🪧
Help balancing work and family life!
🪧 When do we want it? 🪧
School pick-up time!
27.02.2025 10:00 — 👍 10 🔁 2 💬 1 📌 0
@psioxford.bsky.social are hosting the International Pandemic Sciences Conference on 30 June – 1 July 2025 in Oxford and online, theme
'Getting ahead of the curve' 📈
Visit the website now to:
➡️ Register to attend
➡️ Submit an abstract
www.psi.ox.ac.uk/conference25
#episky #IDsky
21.01.2025 11:51 — 👍 3 🔁 3 💬 0 📌 0
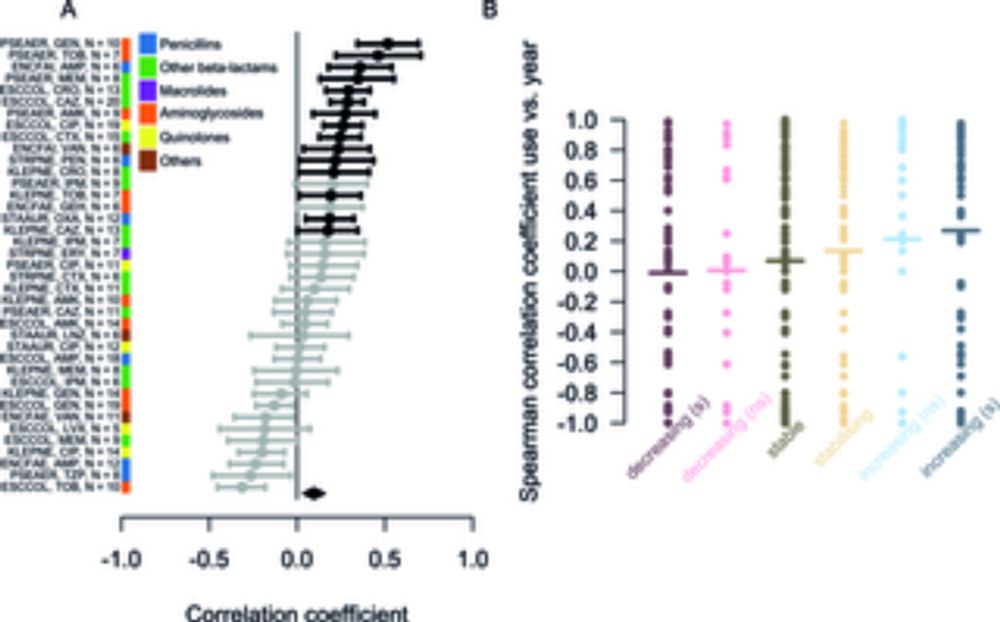
Interesting thread about calculating the reproduction number and reflecting on its utility
19.12.2024 15:29 — 👍 3 🔁 1 💬 1 📌 0
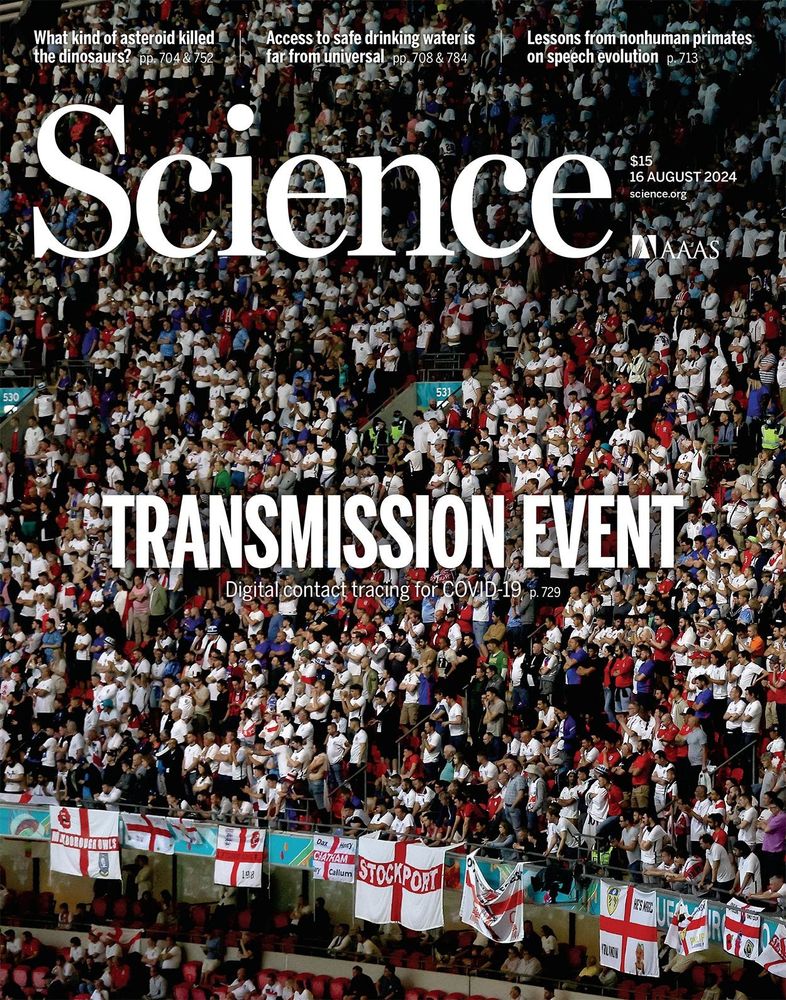
Front cover of Science Magazine shows a large crowd of people watching a football match, with the title TRANSMISSION EVENT: Digital contact tracing for COVID-19

Example of app-based epidemic monitoring in England during the Euro 2020 football tournament. A graph shows how the daily number of close contact events and transmission events detected by the NHS COVID-19 app in England had sharp and increasing peaks on days of England football matches.
Kendall & Ferretti et al, Science: we showed anonymised data from app-based contact tracing enables analytics for epidemic monitoring that is virtually real-time, high-resolution & national scale. Nice Science mag front cover 👀 (Remember outdoors safer than indoors!)
045.medsci.ox.ac.uk/monitoring
16.12.2024 08:57 — 👍 3 🔁 1 💬 2 📌 1
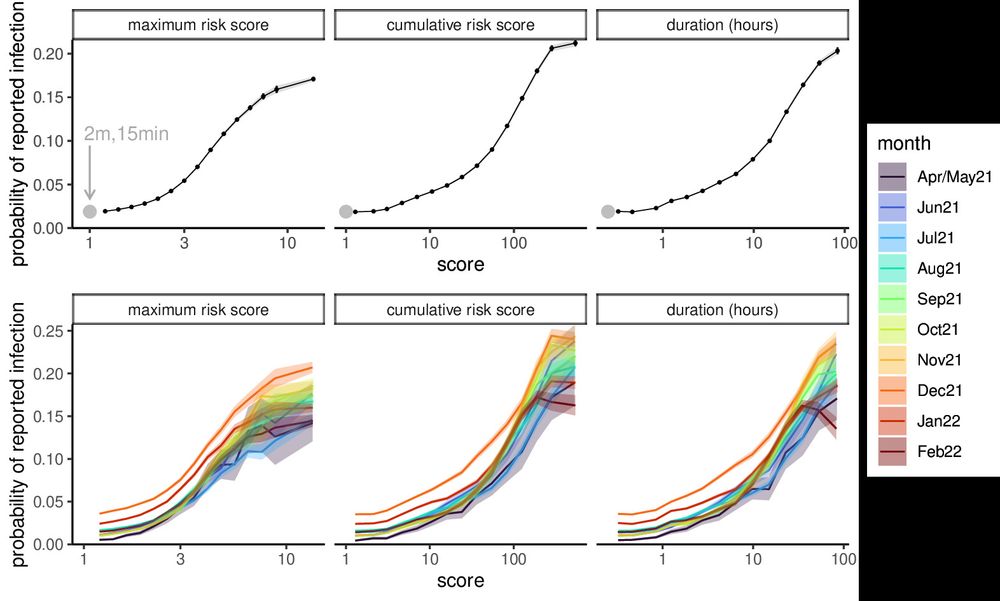
Image shows how the probability of reported infection with SARS-CoV-2 among people notified by the NHS COVID-19 App increases with the risk score calculated by the app.
👋 Hello World! Some of our papers this year ICYMI
Ferretti & Wymant et al, Nature: using 7 million digitally recorded COVID exposures, we found app-based contact tracing successfully measured the actual risk of transmission and we decomposed contributors to risk 045.medsci.ox.ac.uk/risk_measure...
16.12.2024 08:57 — 👍 10 🔁 5 💬 1 📌 0
Digital Pandemic Preparedness
This programme will develop a blueprint for digital health systems that can be deployed during pandemics, create a funding model for implementation, and…
Another opportunity to come work @universityofoxford.bsky.social on the @oxmartinschool.bsky.social project on *Digital Pandemic Preparedness* together with Profs. Christl Donnelly, Christophe Fraser, Melinda Mills, Michael Parker, Luca Ferretti and me.
my.corehr.com/pls/uoxrecru...
18.11.2024 16:01 — 👍 14 🔁 12 💬 0 📌 1

17 key charts to understand the COVID-19 pandemic
The pandemic has resulted in over twenty million deaths. In this article, we review the key insights from global data on COVID-19.
New article by me & Lucas at Our World in Data!
The COVID-19 pandemic is estimated to have killed more than 25 million people; it caused grief & suffering among their loved ones, impacted people's health worldwide & disrupted work & lifestyles.
We look back on the pandemic with 17 charts:
18.11.2024 10:21 — 👍 226 🔁 96 💬 22 📌 13
Really handy! Thanks!
12.11.2024 09:00 — 👍 0 🔁 0 💬 0 📌 0
Shout out to everyone who worked on the NHS COVID-19 app, particularly my amazing academic collaborators Christophe Fraser, @chriswymant.bsky.social, Luca Ferretti, @daphnetsallis.bsky.social, @alicele.bsky.social and Xavier Didelot who all played a central role in the work I've described.
11.11.2024 16:32 — 👍 3 🔁 0 💬 0 📌 0
2. Motivations for pandemic preparedness. Digital contact tracing apps could:
a. play a key, low-cost role in mitigating future outbreaks.
b. gather valuable insights in real time, helping to evaluate and fine-tune our choices of public health interventions (towards minimising negative impacts).
11.11.2024 16:32 — 👍 2 🔁 1 💬 1 📌 0
To round up. Why is all this important?
1. Retrospective insights:
a. we've quantified the epidemiological effectiveness of digital contact tracing.
b. we've found out more about COVID-19: how and when it spread during the years the app was active, in lots of detail.
11.11.2024 16:32 — 👍 3 🔁 1 💬 1 📌 0
Further results and more details are of course available at the links provided, with discussion of subtleties, limitations etc. to unpack this big list of statements.
For easy-read versions with just a bit more detail, you may prefer the corresponding blog posts: michellekendall.github.io/blog/
11.11.2024 16:32 — 👍 1 🔁 0 💬 1 📌 0
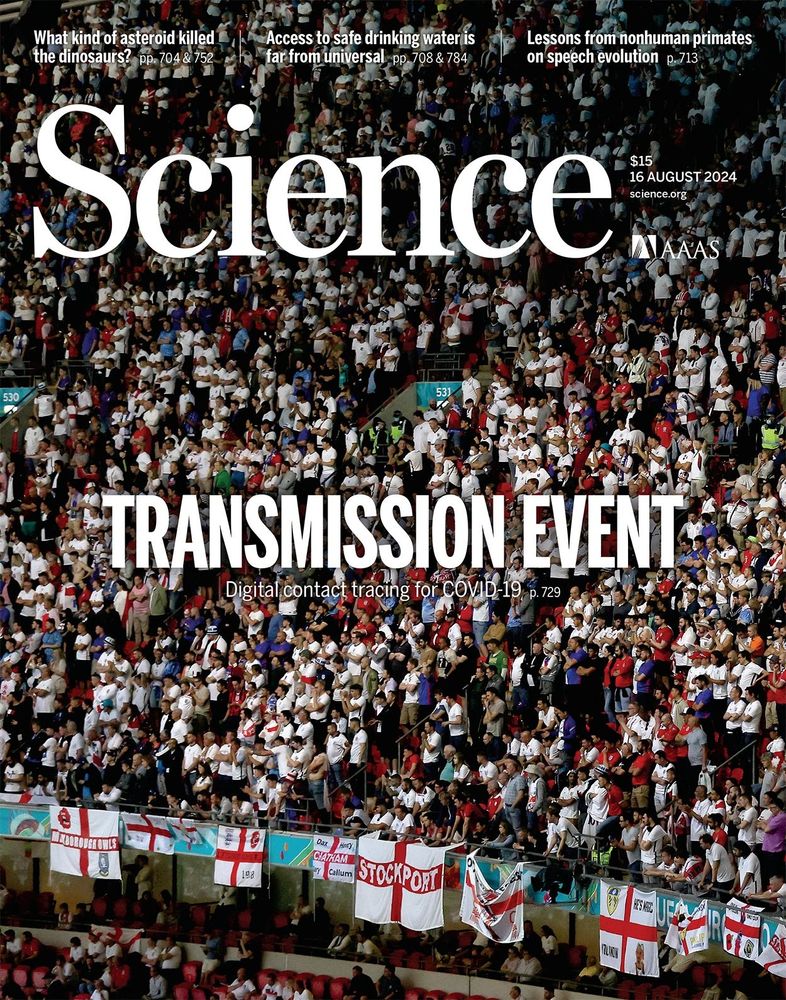
Science magazine cover showing England football fans in Wembley stadium, titled "Transmission Event: Digital contact tracing for COVID-19"
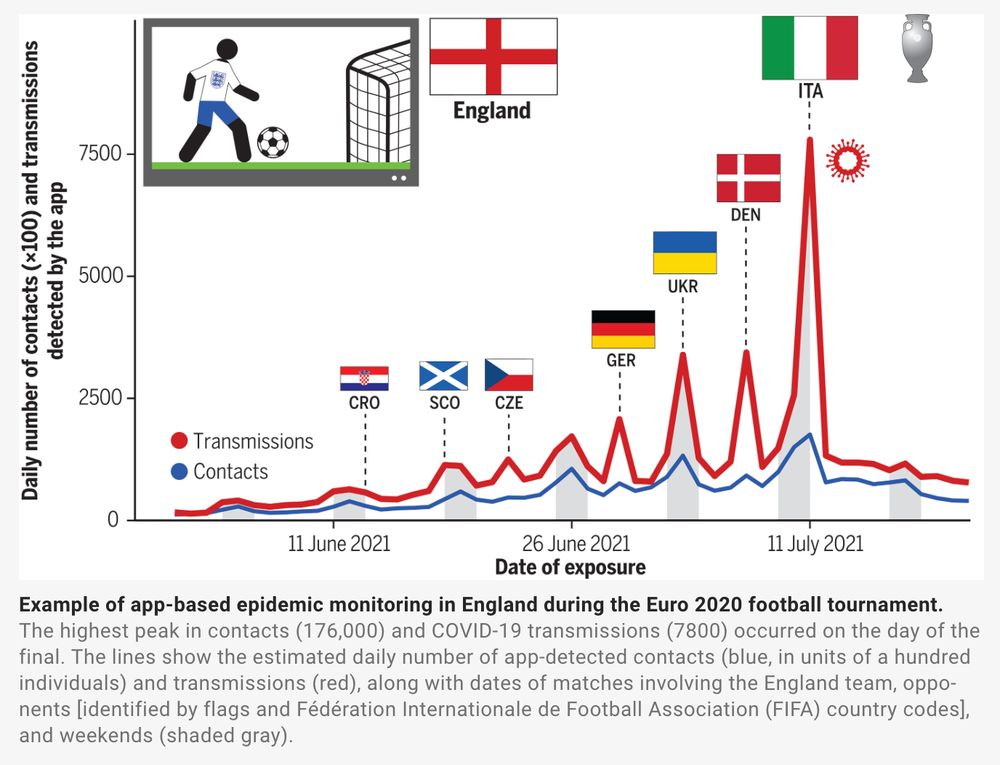
Figure showing contacts and transmissions associated with England match days during the Euros
Christmas and the Euros were associated with big increases in spread, driven by synchronised (likely inter-generational) meet-ups across England and/or Wales. Excess transmissions on Euro match days accounted for 29% of all app-recorded transmissions during the month-long tournament scim.ag/86t
11.11.2024 16:32 — 👍 2 🔁 0 💬 1 📌 0
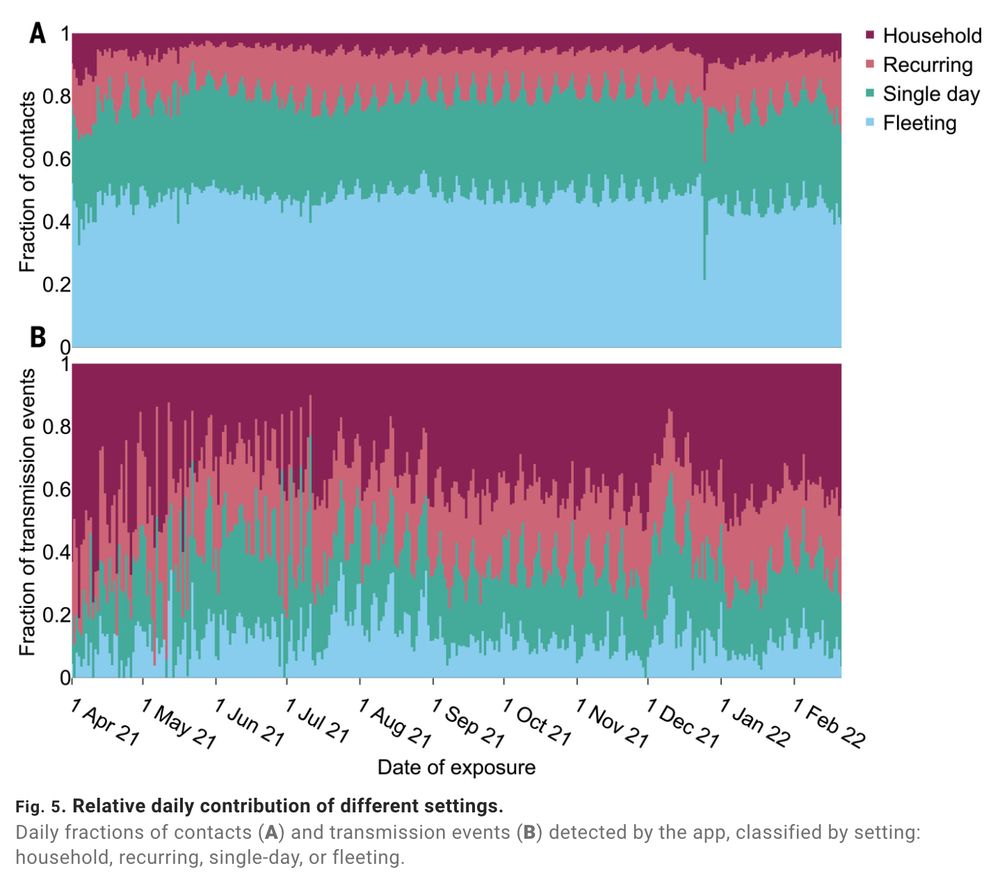
Figure showing relative daily fractions of contacts which were from households, recurring, single day or fleeting encounters, and the corresponding proportions of transmissions. Christmas Day stands out as having many more household contacts and fewer fleeting contacts than usual.
Plus the data captured fine-grained insights into the drivers of transmission, including the effects of day-of-the-week, setting (longer vs more fleeting contact), and geographical region.
11.11.2024 16:32 — 👍 2 🔁 0 💬 1 📌 0
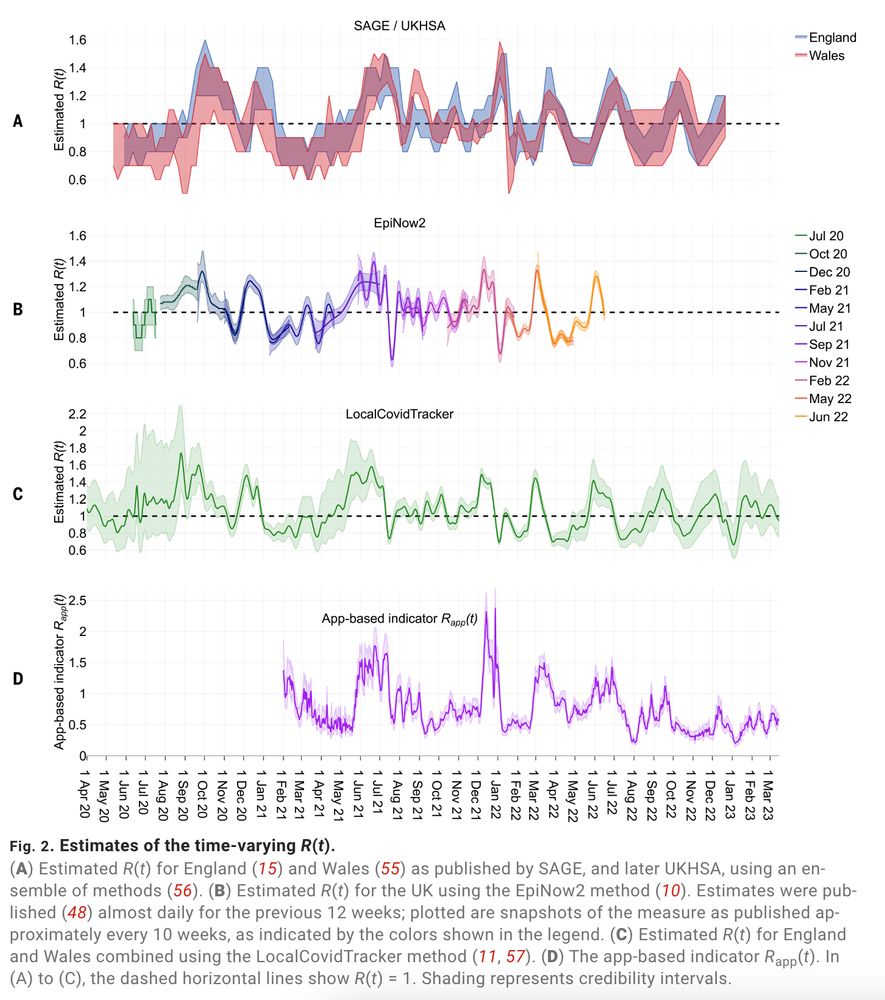
Figure showing various estimators of the reproduction number R over the course of the epidemic
Analysis of app data provided a leading indicator of the reproduction number R, available at least 5 days earlier than other estimates. This provided valuable situational awareness for policy makers.
11.11.2024 16:32 — 👍 2 🔁 1 💬 1 📌 0
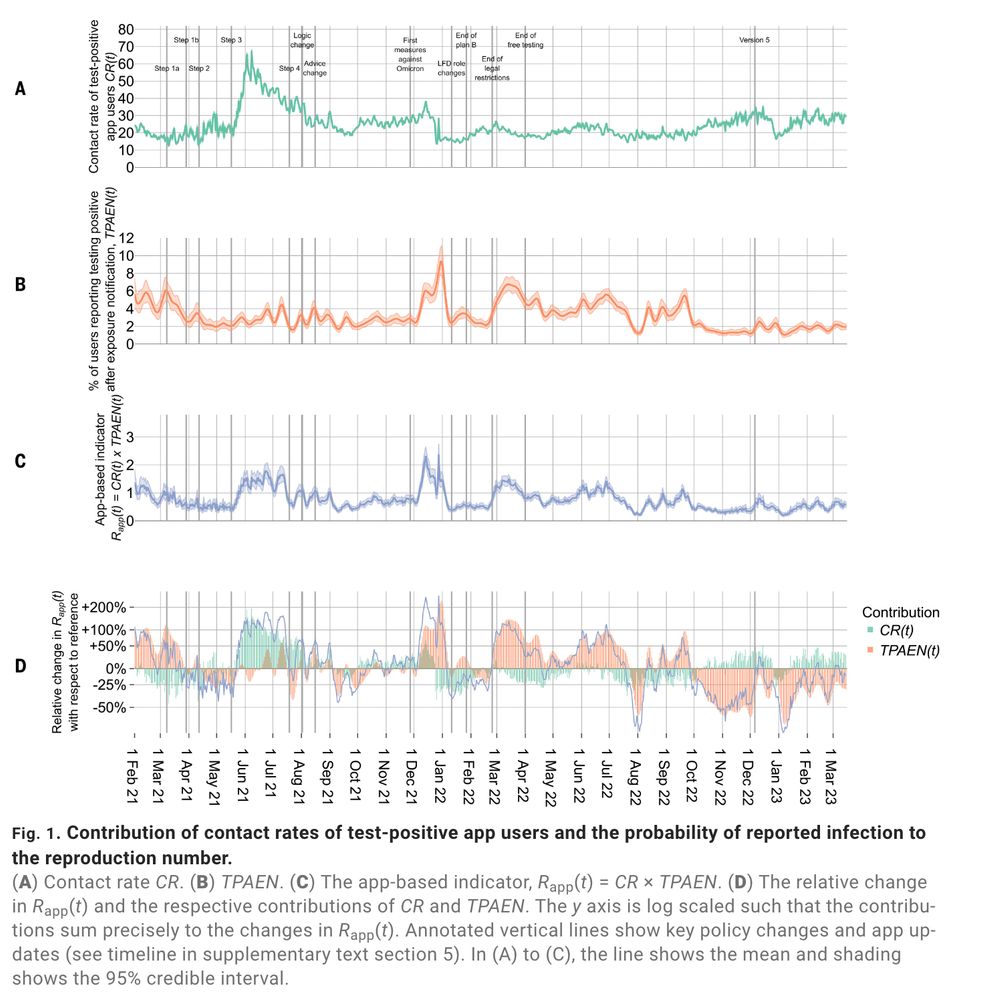
Figure showing the contributions of (a) contact rates and (b) probability of reported infection to (c) the reproduction number.
Finally, app data provided near real-time insights into the drivers of the epidemic. We could see if a wave was driven by an increase in contact rates or infectiousness.
doi.org/10.1126/scie...
11.11.2024 16:32 — 👍 2 🔁 1 💬 1 📌 0
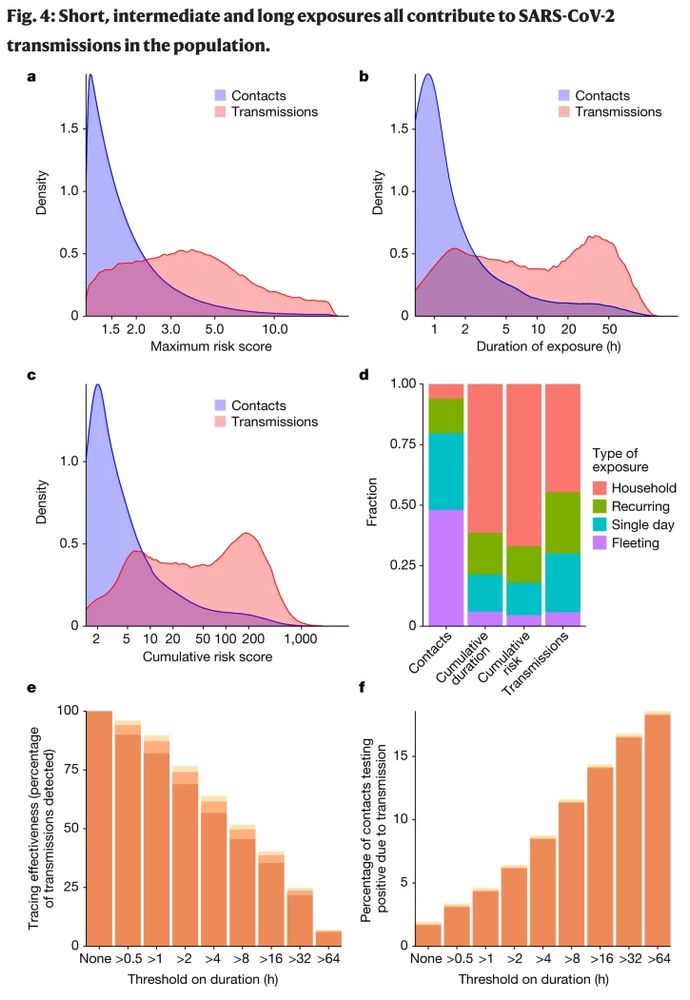
Figure showing how short, intermediate and long exposures all contribute to COVID transmission
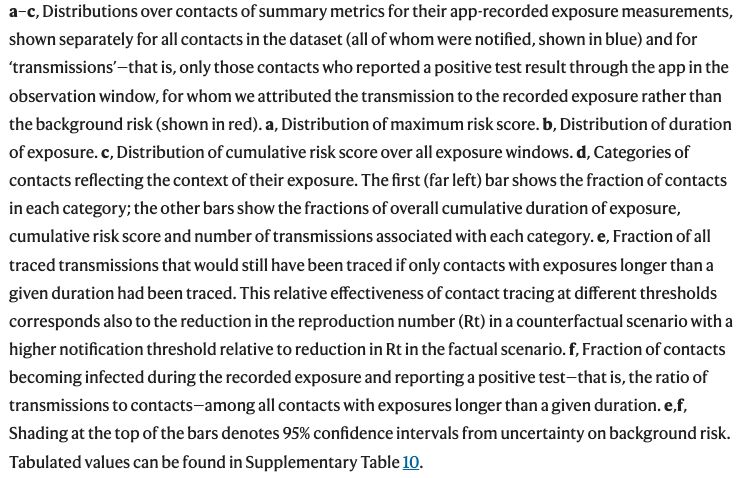
Figure caption, providing full details
"Whereas most exposures were short (median 0.7 h, interquartile range 0.4–1.6), transmissions typically resulted from exposures lasting between 1 h and several days (median 6 h, interquartile range 1.4–28). Households accounted for about 6% of contacts but 40% of transmissions."
11.11.2024 16:32 — 👍 1 🔁 0 💬 1 📌 0
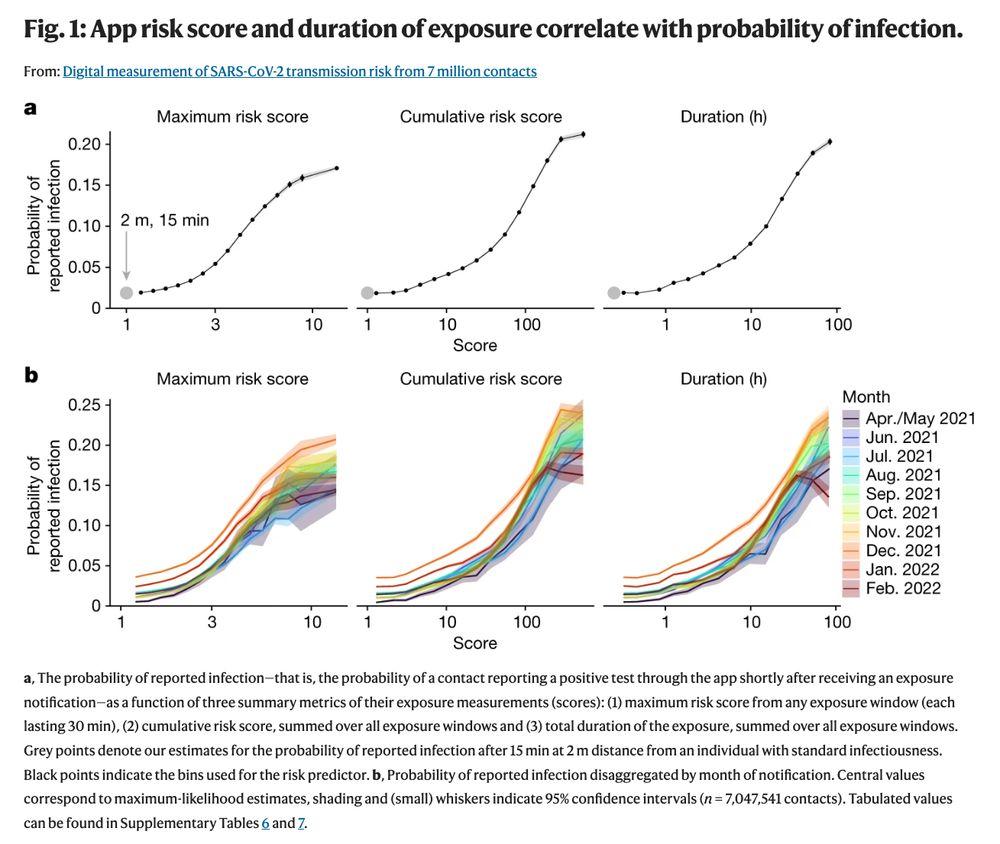
Figure showing app risk scores and duration of contact correlating with probability of infection, both overall and disaggregated by month of the year
By analysing 7 million contacts captured by the app, we (a) concluded the app was good at measuring "riskiness" of contact, and (b) quantified for the first time the "riskiness" of contacts according to distance and duration. doi.org/10.1038/s415...
11.11.2024 16:32 — 👍 2 🔁 1 💬 1 📌 0
But that's not all!
The huge user base and near-instant data collection from the NHS COVID-19 app meant that we could gain some epidemiological insights that had never before been possible 👀
11.11.2024 16:32 — 👍 1 🔁 0 💬 1 📌 0
Weekly measure of the percentage of cases in England and Wales from the government dashboard which were reported through the app
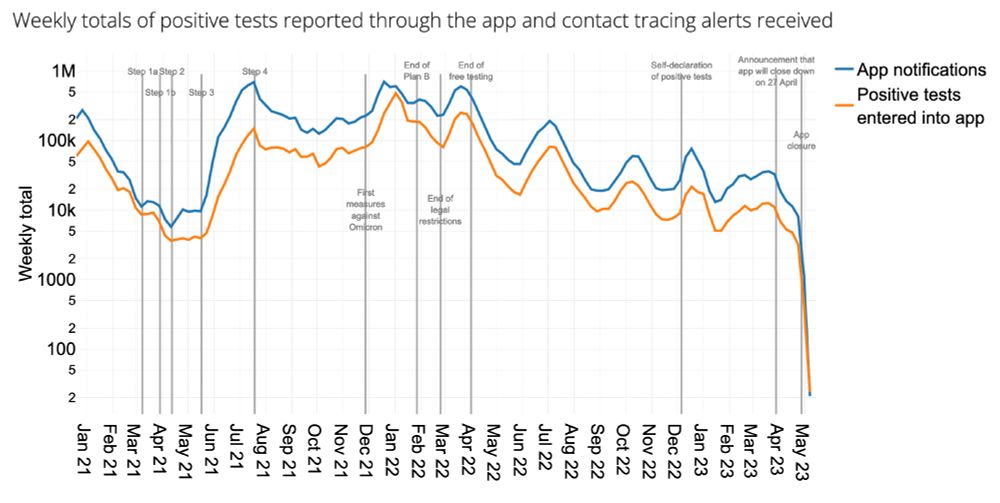
Weekly totals of positive tests reported through the app and corresponding contact tracing alerts received
App usage declined as vaccines (happily!) did most of the life-saving work, but it continued to help reduce pressure on the NHS. Each week in 2022, 30-60% of nationally-registered positive tests were reported via the app and 1000s of contacts were traced.
bdi-pathogens.shinyapps.io/NHS-COVID-19...
11.11.2024 16:32 — 👍 1 🔁 0 💬 1 📌 0
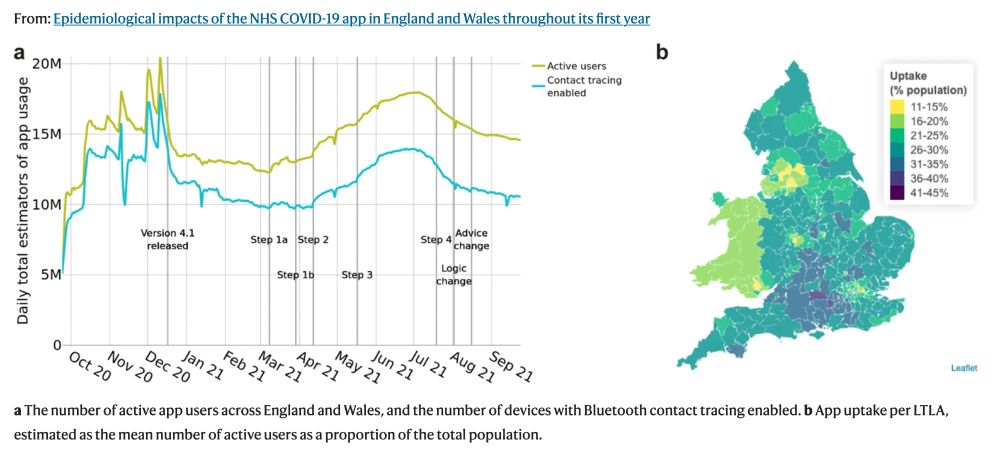
Graphs showing app uptake (a) as a timeseries across the year, (b) as a map, varying across authorities in England and Wales
Impressive achievements for a new technology built rapidly during a pandemic by teams who had largely never met before 🏆
Frequent, rapid updates were required to maintain it in line with national policy changes 💪👏
And of course huge thanks to the >18 million users who made it such a success ✨🙏
11.11.2024 16:32 — 👍 2 🔁 1 💬 1 📌 0
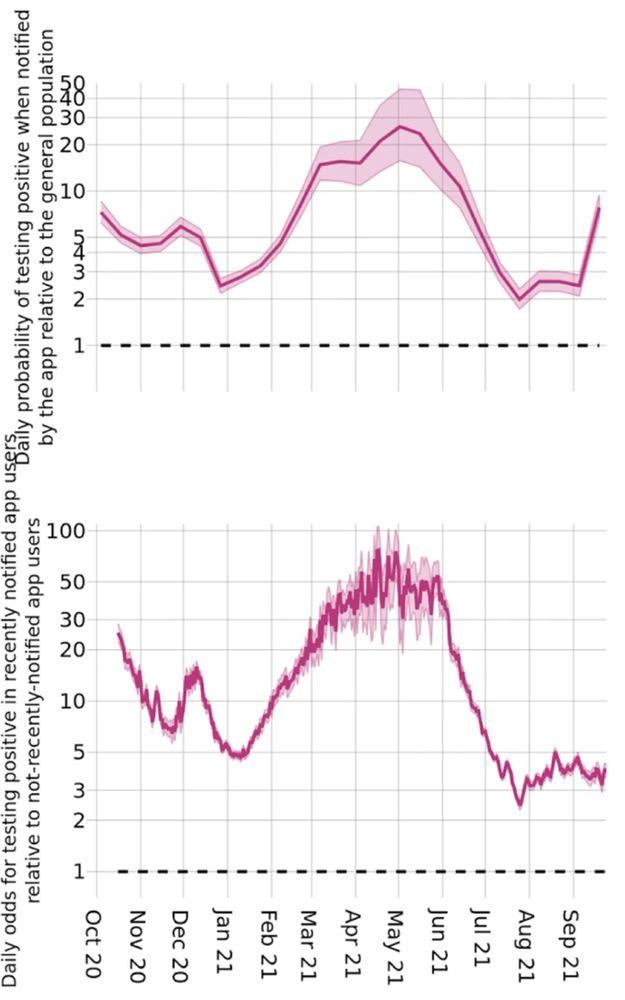
Figure showing the timeseries of (a) probability of testing positive when notified by the app relative to the general population, (b) odds for testing positive in recently notified app users relative to not-recently-notified app users
The app's popularity and accuracy made it effective: a user getting an alert was always at least twice as likely to be infected as a person randomly selected from the population. At its peak, a notified app user was 77 (CI 54, 106) times more likely to be infected than a not-notified app user.
11.11.2024 16:32 — 👍 2 🔁 1 💬 1 📌 0
Evolutionary genetics. Assistant Professor @ Rutgers—Camden genevalab.io
Computational disease ecologist. Executive Director of @ropensci.org. Co-founder of https://grant-witness.us/. Brooklynite. One Health, open science, #RStats, cities, civics, bikes, fun, love, progress + justice. he/him
Coalition for Epidemic Preparedness Innovations (CEPI). Working to end epidemics & pandemics by developing new vaccines for a safer world. #100DaysMission
Set theorist. Panel show enthusiast. Reader of too many books at once.
Mathematical embroidery by a PhD student! Sharing my creations to inspire crafty folks to engage with maths - all designs have free patterns available on my website :) https://www.threadedtheorems.com
Mathemactivist and Craftamatician.
Constantly trying to unleash the beauty of Maths for all to see! 🌈✨
I do nerdy things on the internet, and “real life”
60% freelancer exploring & challenging science through art & events.
40% Patient & Public Involvement @britsocimm.bsky.social
100% nerd.
Views my own!
She/her
Spoonie / medical mystery
🏳️🌈🇬🇧🇸🇬
Hanaayoob.co.uk
Mathematician, Musician, Speaker, Teacher. Freelance - MEI - Uni of Bath
Working with @Numberphile @MathsInspiratn @TMiPUK and on YouTube @SparksMaths
Get in touch and/or book me for a maths talk or workshop:
www.bensparks.co.uk
📚 Innovation Research Associate and Engagement Lead at CAMaCS, University of Warwick
➕ MathsComm on Twitch
🎩 Wearer of Hats
💙💜🩷 She/They
A conference for maths communicators. Every two years in the UK. Next conference Aug 2025, Warwick University. More info: talkingmathsinpublic.uk
Official feed of the UK Health Security Agency (UKHSA) providing regular news updates on the work of the organisation.
Postdoc at University of Oxford. Interested in Bayesian stats, computational methods and infectious diseases.
Global collab (https://www.javeriana.edu.co/, https://www.uniandes.edu.co/, @mrcunitgambia.bsky.social, @lshtm.bsky.social) developing a trustworthy data analysis ecosystem to get ahead of the next public health crisis.
📌 https://epiverse-trace.github.io/
Head of Bioinformatics at Broken String Biosciences.
https://www.brokenstringbio.com/
Still love microbial bioinformatics. Now working in the cell and gene therapy space. Keen Python and Nextflow coder
Bringing together global expertise, knowledge, research and teaching to help humanity adapt faster to outbreaks of disease.
PSI is a research institute at the University of Oxford with a mission to discover, create and enable practical solutions to infectious disease threats worldwide.
Researcher in epidemiology and mathematical modeling of vector-borne diseases @CIRAD @ICIPE. My goal is to improve animal and global health by integrating translational and basic science in control programs and to inform policy.
Bioinformatician, microbial genomics, 🤓 💙 Pneumo, E. coli, capsules, AMR, vaccine evaluation and general adventure seeker living in Norway.