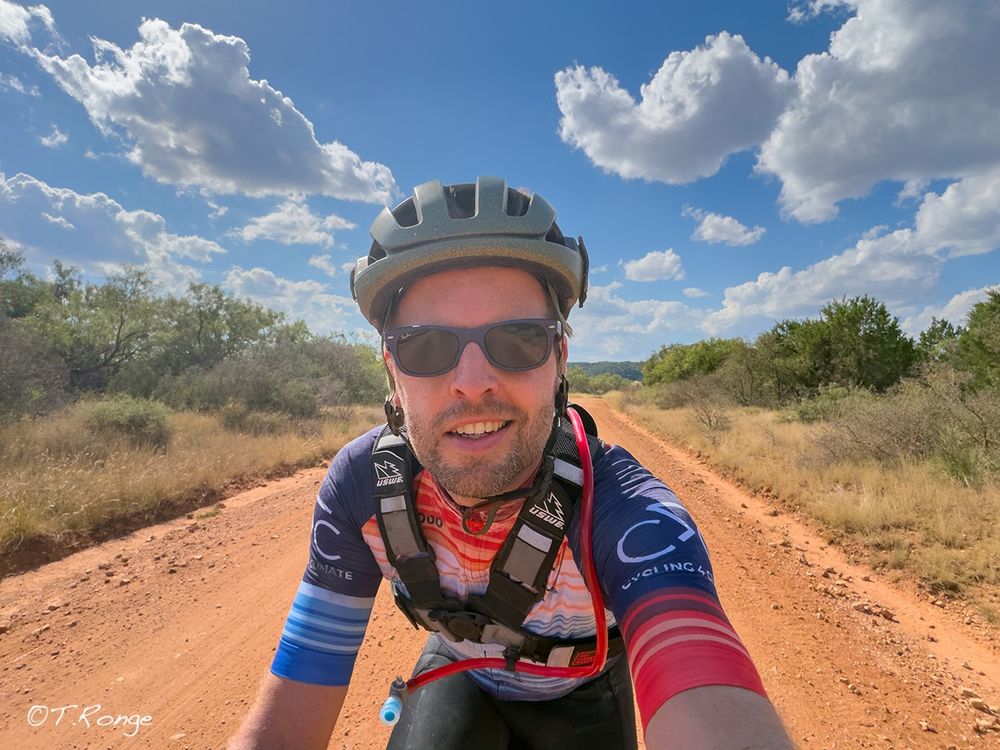
Cyclist in a climate stripes jersey.

A road in the Texas Hill Country seen from a cyclist's POV.

A road in the Texas Hill Country and a geological outcrop seen from a cyclist's POV.
Back from a 105mi bike race through the TX Hill Country where the July floods caused unspeakable devastation (race fees went to flood relief). It's hard to directly attribute specific rain events to climate change, but we know that storms like these become more likely as CC worsens.
#ShowYourStripes
05.10.2025 20:47 — 👍 17 🔁 1 💬 2 📌 0
Looking for more information?
• Climate Shift Index: csi.climatecentral.org
• Climate Change's effect on lingering summer heat: www.climatecentral.org/climate-matt...
05.10.2025 23:02 — 👍 0 🔁 0 💬 0 📌 0

October not really feeling like October used to around here?
That's because summer creep continues to eat into our fall months.
#bcstx now experiences the average last 90° day around 3 weeks LATER than we did back just 50-55 years ago.
05.10.2025 23:02 — 👍 0 🔁 0 💬 1 📌 0

Another sweaty, hot, above-average October day for #bcstx.
🌡️ Easterwood reached 92° this afternoon. A high 6° HOTTER than average for this time of the year
🔴 Human-caused climate change makes this type of late summer heat now 3x MORE likely to occur here in the Brazos Valley
05.10.2025 23:02 — 👍 3 🔁 0 💬 1 📌 0
Showers & storms are swirling in the northern Gulf around a low, sliding northwest into waters running 1–2°F warmer than normal for early October.
✅ Good news: hostile upper winds = no tropical development.
❌ Bad news: close enough to crank up humidity in the Brazos Valley—but not bring us rain.
04.10.2025 16:25 — 👍 1 🔁 0 💬 0 📌 0
Summer-like, record heat made at least TWICE more likely to occur on October 4th due to climate change.
Not to say every Gameday in early October will be this hot -- but we know 'summer creep' into the start of football season is becoming more common.
More info + data ➡️ impactsus.org/cfb/
04.10.2025 16:20 — 👍 1 🔁 0 💬 0 📌 0

Pope Leo hits out at critics of global warming
In his first major statement on climate change, the pontiff criticises those who minimise climate change.
"God will ask us if we have cultivated and cared for the world that he created for the benefit of all and for future generations, and if we have taken care of our brothers and sisters - what will be our answer, my dear friends?"
Story from BBC ⤵️
share.google/VCtmobYtPktK...
03.10.2025 02:03 — 👍 9 🔁 2 💬 0 📌 0

Also...if you were hoping for some rain anytime soon?
Keep on waiting.
Reminder: October *typically* is expected to be the WETTEST month of the year for #bcstx -- clocking 4.93".
Oct 2024 produced 0" of rain.
Last above-average October rainfall was...*checks notes* 2018
02.10.2025 02:48 — 👍 4 🔁 1 💬 0 📌 0

Remember when October used to feel like October?
02.10.2025 02:48 — 👍 5 🔁 0 💬 1 📌 0

With just 0.04" of rain, #bcstx just experienced the 4th DRIEST September of record in 136 years of record keeping.
For perspective, 2024's just-shy-of-0.75" tied as the 12th DRIEST of record
#txwx
30.09.2025 15:28 — 👍 3 🔁 0 💬 0 📌 0

In South Texas, a town struggles for water
The city of Mathis typically pumps its drinking water from Lake Corpus Christi, but worsening drought conditions are expected to plunge water levels too low to safely extract usable water.
"The situation in Texas highlights a growing problem in drought-prone parts of the country — and the world — as climate change alters precipitation patterns, intensifies drought and saps the availability of safe drinking water"
share.google/B0YjFBlBuGh0...
28.09.2025 14:07 — 👍 2 🔁 0 💬 0 📌 0

#Humberto strengthened 85mph in 24hrs.
The 3rd hurricane of the 2025 Atlantic season...& 3rd to undergo Extreme Rapid Intensification (+58 mph in 24 hrs)
This. is. climate. change.
Unusually warm waters boosted Humberto’s strength, made 50x more likely by carbon pollution.
27.09.2025 12:43 — 👍 39 🔁 12 💬 2 📌 0
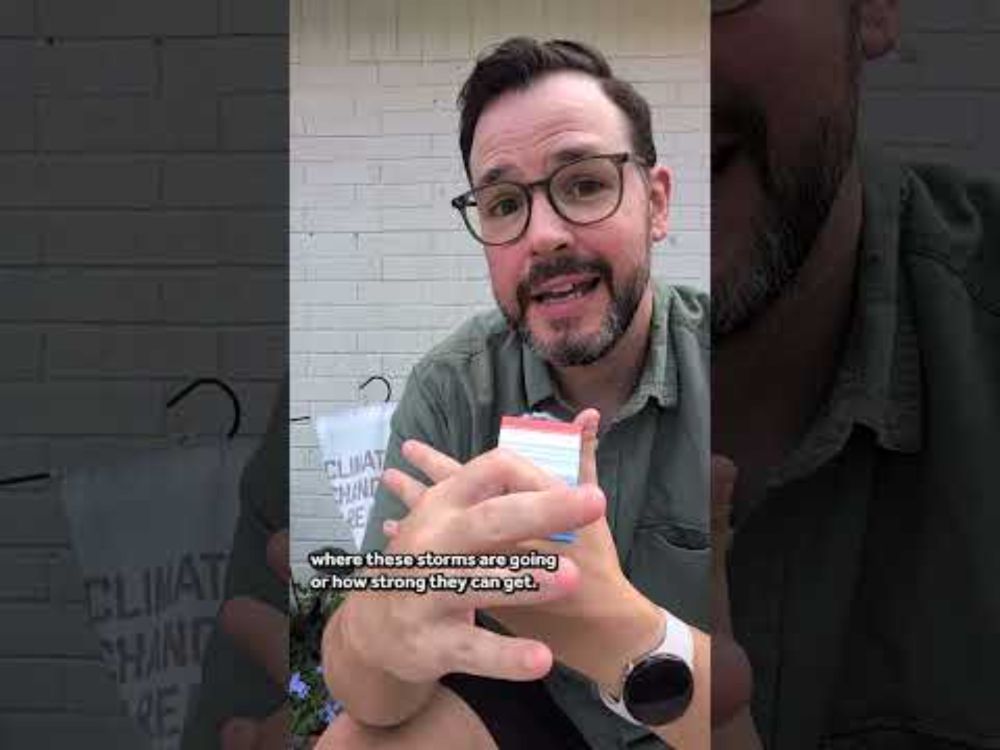
YouTube video by climatecentral
How climate change warmed ocean waters could impact Hurricane Humberto & Imelda
#Humberto is officially a hurricane.
#Imelda is expected to form -- potentially as early as late Friday
How can warmer-than-average Atlantic temperatures impact the intensity of storms? What about the rain they bring?
Let's talk tropics ⤵️
youtube.com/shorts/qG5Jd...
26.09.2025 16:34 — 👍 6 🔁 6 💬 0 📌 0
📱 Come make meaningful content with us!
This gives a creative, climate-motivated creator the chance to bring science & data to life through digital storytelling.
Grow your video & editing skills while communicating climate change impacts. (Probably work in a little fun along the way, too!)
25.09.2025 19:20 — 👍 3 🔁 2 💬 1 📌 0

Anticrepuscular rays making for an A+ sunrise on this Thursday morning.
25.09.2025 12:35 — 👍 1 🔁 0 💬 0 📌 0

Tropical Storm #Humberto officially formed per NHC in "favorable environment w/ warm sea surface temperatures."
Currently, over waters ~1°F warmer than avg (50x more likely from climate change)
Next week: expected to interact with 2.5°F above avg waters (100x-300x more likely by human activities)
24.09.2025 21:44 — 👍 6 🔁 3 💬 1 📌 0

The U.S. generated a record 756,621 gigawatt-hours (GWh) of electricity from 🔅solar and 🍃wind in 2024...
🏡...enough to power the equivalent of more than 70 million average American homes.
This is more than 3x what was generated just a decade ago.
🤠Texas led the way in wind generation in 2024
24.09.2025 18:51 — 👍 3 🔁 1 💬 1 📌 0
🎧You can also snag the episode at your favorite place to put podcasts into your ears
🟢Spotify: open.spotify.com/episode/0wXX...
🔴Apple: podcasts.apple.com/us/podcast/g...
#ClimateMatters
23.09.2025 18:08 — 👍 0 🔁 0 💬 0 📌 0
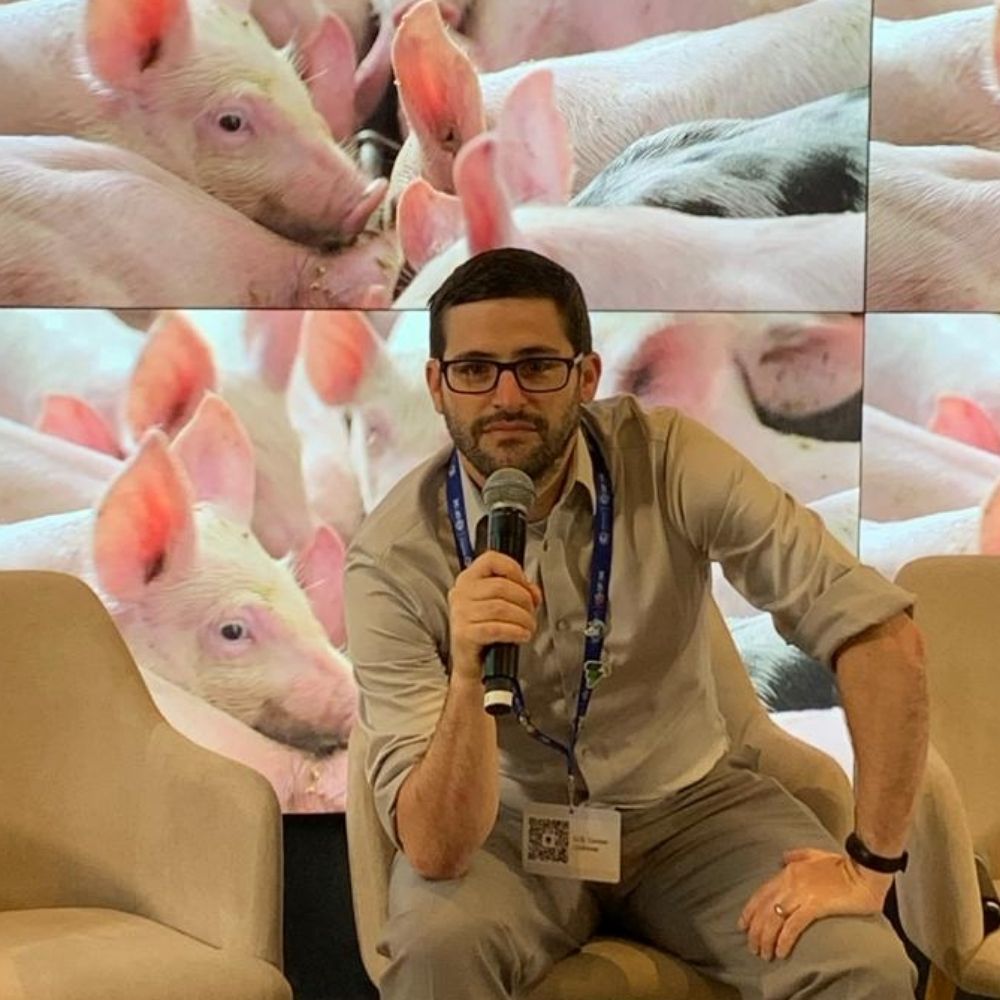
YouTube video by GeoTrek
Making Sense of Extreme Weather: Climate Communication and Attribution with Shel Winkley
🗣️"Conversation & communication are a solution to climate change."
Big thanks to "Hurricane" Hal for letting me come chat on the GeoTrek podcast to communicate the importance of communication & the way we are putting it to work at @climatecentral.org
Check it out ⤵️
www.youtube.com/watch?v=OQAJ...
23.09.2025 18:08 — 👍 5 🔁 2 💬 1 📌 0
The leaves are trying to tell us something.
23.09.2025 17:52 — 👍 5 🔁 2 💬 0 📌 0

Map showing Hurricane Gabrielle’s track near Bermuda. Colored shading highlights record-warm ocean areas. Text: “Ocean warmth made at least 50x–100x more likely due to climate change.” Storm symbols mark Gabrielle’s intensification from Cat 1 to Cat 4.

Map of the Atlantic Ocean showing water temperature anomalies Sept 15–21, 2025. Large dark red area highlights record-warm waters where Hurricane Gabrielle traveled, surrounded by lighter red (above normal) and some blue (below normal) patche
Over the last 24hrs, #Gabrielle capitalized on record ocean warmth to undergo Extreme Rapid Intensification, becoming a powerful 140mph Category 4.
🌡️Sea temps 2°-3°F ABOVE the late September average
🔴Ocean heat made at least 50x-100x MORE likely by human-caused climate change
23.09.2025 15:34 — 👍 5 🔁 3 💬 2 📌 0

Is it the first signs of fall?
Or is it the first signs of drought?
*Whispers "it's drought..."*
23.09.2025 14:27 — 👍 5 🔁 1 💬 2 📌 1
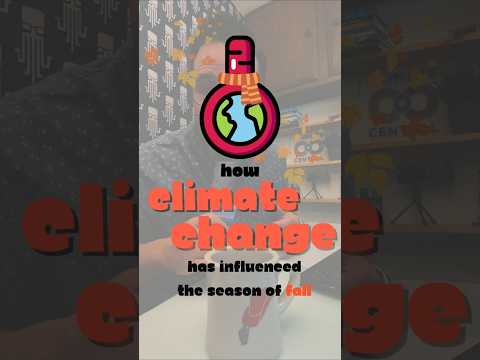
YouTube video by climatecentral
Climate Change is adding extra spice to your PSL as it warms the season of fall
Happy Fall, Y'all!
Climate change is putting the spice in our PSL as the season gets hotter across the entire U.S.
Let's not leaf you hanging ⤵️
youtube.com/shorts/-2SqO...
22.09.2025 23:23 — 👍 5 🔁 5 💬 1 📌 0

People Exposed to Climate Change: June-August 2025 | Climate Central
A seasonal analysis of how climate change boosted temperatures worldwide between June and August 2025
Looking for more info?
@climatecentral.org did seasonal analysis for 940 cities across 240 countries to understand the heat felt across the globe over June, July, & August.
Read the report. See the data ⤵️
www.climatecentral.org/report/peopl...
17.09.2025 18:55 — 👍 2 🔁 0 💬 0 📌 0

One last note here: 📍Houston
6th warmest summer of record.
#1 Ranked summer for overnight warmth
21 days of Risky Heat (Tavg = 84°+).
All 21 have a fingerprint of & were boosted by human-caused climate change.
🧵/5
17.09.2025 18:55 — 👍 2 🔁 0 💬 1 📌 1

2) Flip side: early July ran COOLER-than-average.
Why? The stuck weather pattern that brought days of rain & July 4th extreme flooding.
Using the same science, we know temps like this are certainly far LESS likely in a warming world in Texas at this time of the year.🧵/4
17.09.2025 18:55 — 👍 1 🔁 0 💬 1 📌 0


Data for Austin & San Antonio (Central Texas & the Hill Country) stand out to me for 2 reasons:
1) Significant early-summer heat started before and then lingered into the beginning of June. Heat that would be rare or almost impossible without climate change 🧵/3
17.09.2025 18:55 — 👍 2 🔁 0 💬 1 📌 0

Heat-trapping, carbon pollution drove excessive heat (aka more heat than even the "but it is summer" heat) across the globe over the past 3 months.
Utilizing attribution science, we can understand the fingerprint of climate change on this heat.
Let's dive into Texas 🧵
17.09.2025 18:55 — 👍 1 🔁 0 💬 1 📌 1
Associate Director, Program on Attribution Science @climatecentral.org
🌎 Into climate communications, circular economies, regenerative gardening, and land conservation.
Sharing Curated News About The Environment & Climate Change
https://www.climatenewsnow.com/
https://linktr.ee/climatenewsnow
Portfolio: haleythiem.myportfolio.com
Meteorologist with expertise in science writing, weather and climate communication, and digital content creation and management
University of Oklahoma alumni
(opinions are my own)
Californian • Climate Scientist • Canada Superfan
// All opinions expressed are my own //
Data scientist and water policy nerd.
Developing practical solutions for today’s most pressing challenges. Associate Climate Director @ Trust for Public Land.
Nature | Climate | Environmental Justice | Birds
📍Burlington, VT
climate and weather communicator 🐞🌞🌱
media associate for: @climatecentral.org
🤔 I don’t know. But I probably know who knows.
🙏🏼 Grateful for every day.
🎙 Radio/Podcasting
👍🏼 Texas A&M University, '91
🔗 https://linktr.ee/jaysocol
Explaining anti-democratic rhetorical tricks. Award winning #teamrhetoric professor & author. Very earnest. Democracy cheerleader. Views represent my academic research, not my university. I post things on substack: https://jennifermercieca.substack.com/
Climate scientist and science communicator who dabbles in comedy.
Creator of NOAA's Teek and Tom cartoon series focused on weather, climate and ocean science.
If in Washington DC, come check out my science improv troupe at Washington Improv theater
Covering climate change in the Pacific Northwest for The Seattle Times. On Signal @breda.45. 🐟🌲🏔️ (she/her)
From May 28th to June 1st, join meteorologists and climate scientists from across the US for a 💯-hour livestream! We will share our science and show why America's forecasts are worth saving. [Photo: NOAA]
Learn more: wclivestream.com/
Monitoring Mainstream and Independent Media about Climate related news and events.
Tracking Climate disruption related news and protests around the issue of Climate Breakdown.
🆘 @skyfleet.blue
Journalist, Geographer, Dad.
*322ppm. Context is King.
"Tweets" in 🇺🇲 🇩🇪 mostly about #ClimateChange, also #BioDiversity and Geo-stuff, some politics. Likes sometimes used as bookmarks...
Climate communications | Communications Manager, @granthamicl.bsky.social | Former journalist | 🇮🇪 in London | Views my own
🌦Meteorologist
🎙Host of For The Love of Weather podcast
🌍Science communicator
⛈Weather presenter
🌿Nature lover
BSc MSc
Media Advisor & Senior Operational Meteorologist UK Met Office
Parent to 2 mini daxies
Love running
Views & opinions my own
@Petagna on X
KCCI Storm Team 8 Meteorologist. Chasing storms and the northern lights. Cycling enthusiast. KC → Springfield, MO → Omaha, NE → Des Moines, IA.