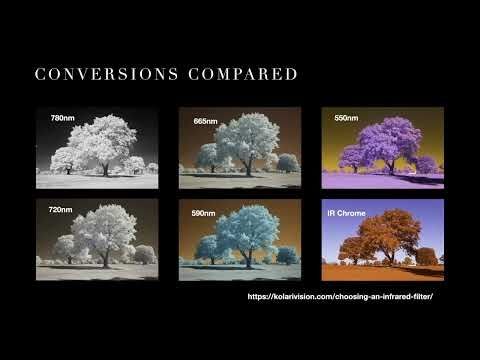
A nice introduction to Infrared photography
youtu.be/26-WC2UqDe4?...

@seismologic.bsky.social
Seismologist PhD student from UC Riverside. Interested in seismic studies of earthquakes, ambient noise and anthropogenic events. Currently looking for postdoc opportunities.
A nice introduction to Infrared photography
youtu.be/26-WC2UqDe4?...
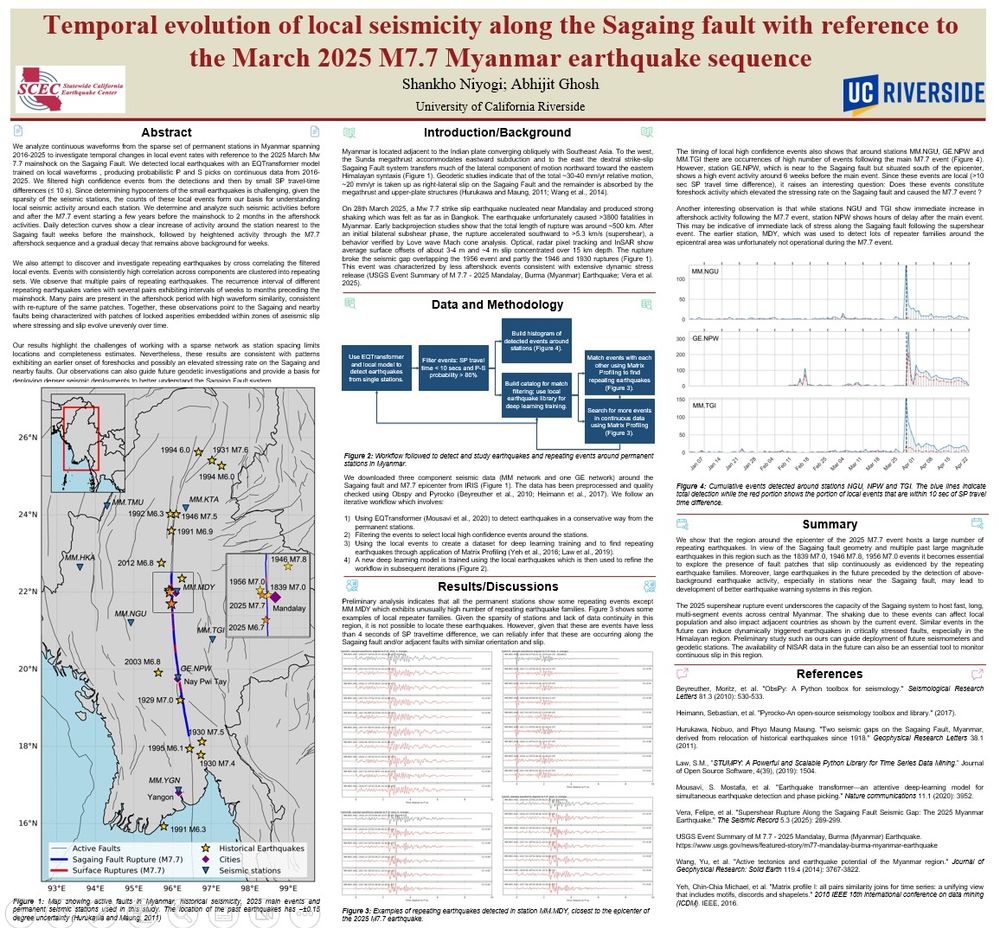
If you are attending SCEC 2025 and want to see some cool results about the evolution of local seismocity w.r.t. the 2025 Myanmar earthquake, please stop by my poster #55 Session A
#scecmeet #SCEC2025
Video Shows Pulsing and Curving Fault Behavior - Eos share.google/uuv6diA68EpY...
25.08.2025 21:56 — 👍 0 🔁 0 💬 0 📌 0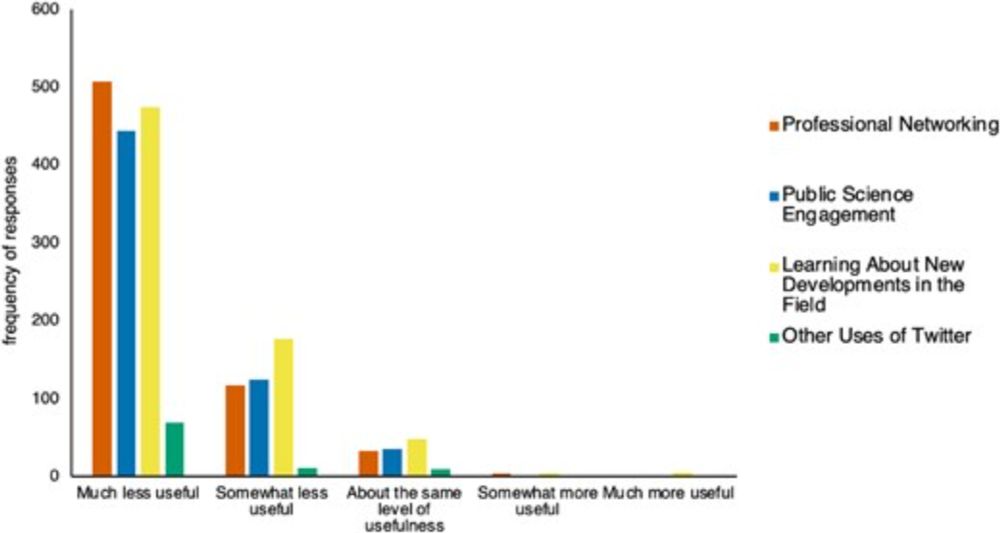
Hey everybody! @drjuliawester.bsky.social and I have a new paper!
We surveyed over 800 scientists, science communicators, and science educators who use social media.
Conclusion: Scientists no longer find Twitter useful or pleasant, and many have switched to Bluesky! 🧪🌎🦑
doi.org/10.1093/icb/...

Screengrab of the Zoom from today's class. On the left is the output of a Jupyter notebook showing multiple plots of potential displacement of the volcano for different source locations. On the right is Franz Meyer, my co-instructor, who is leading this session.
It's Day 1 proper of this year's EarthScope #InSAR Processing and Analysis short course (the "ISCE+" course)! Here, Franz Meyer is leading participants through a simple Mogi source modeling exercise using InSAR data from Okmok volcano! Real data and real models on an interactive online platform!
18.08.2025 19:04 — 👍 20 🔁 3 💬 1 📌 0Quick tip: you can export the points to PyGMT to create more visually stunning maps
18.08.2025 04:34 — 👍 2 🔁 0 💬 0 📌 0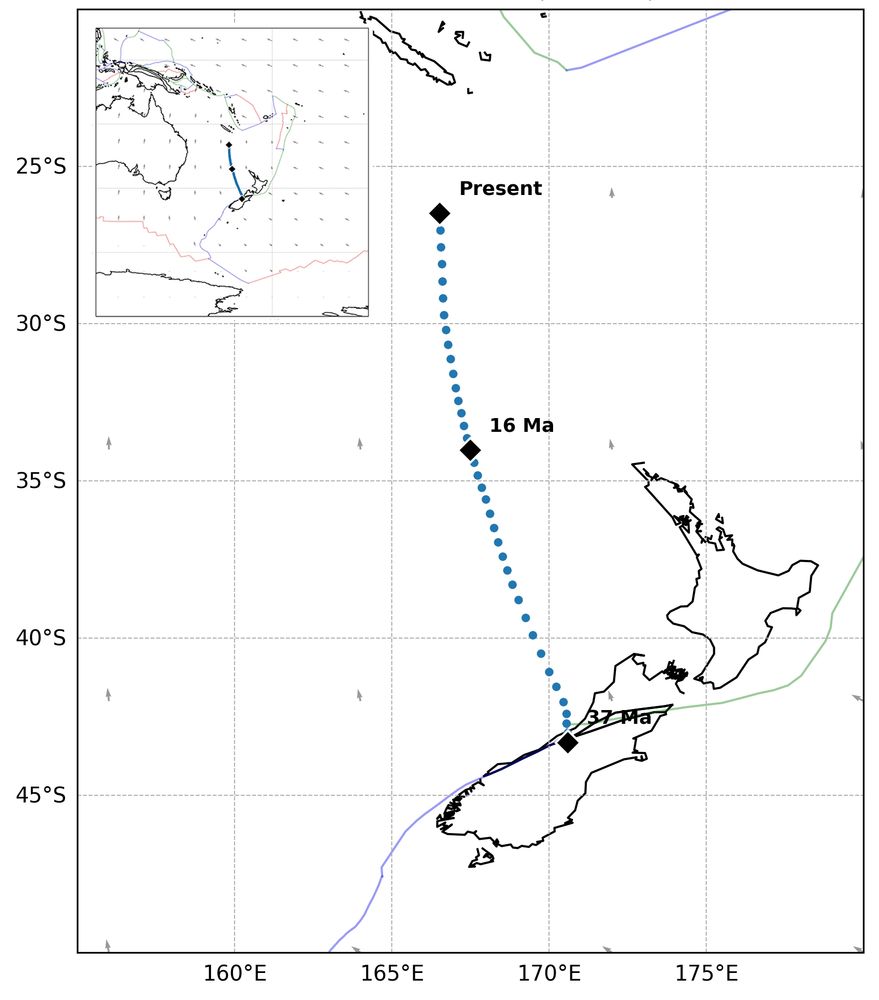
A big shout-out to the team behind GPlates and PyGPlates. Visualization of plate motions and points is very convenient now.
github.com/GPlates/GPla...

Picture taken by pilot Jacek Maselko. Shows the South Sawyer Glacier, and in the background is the scar in the mountain that the landslide originated from

Picture taken by pilot Jacek Maselko. This one shows a different angle of the mountain that the landslide originated from, and also the water in the fjord that is now filled with debris. The terminus of the glacier is also visible, and is covered with rock and debris.

Picture taken by pilot Jacek Maselko. Another angle of the mountain that the landslide originated from, with a different view of the debris-filled fjord and the terminus of the glacier. The light-colored part of the mountain is the scar. Pilot states they were flying at about 3500 ft.

Picture taken by pilot Jacek Maselko. Another angle of the scar on the mountainside and the debris-covered glacier terminus. Pilot was flying at about 3500 ft.
Copied from AEC post on X: Check out these amazing photos of the Tracy Arm Landslide! Thank you to Jacek Macelko for sharing these images, taken on Tuesday, August 12 from 3,500 ft. The pale triangle of the landslide scar stands out. 🧪⚒️🪨 1/2
14.08.2025 18:34 — 👍 31 🔁 12 💬 2 📌 0It has been a busy couple of days! There was a large landslide and tsunami in SE Alaska, in Tracy Arm, Sunday morning. Luckily, no injuries or casualties were reported. This region is outside of our current landslide coverage, but we were able to get a quick location after hearing about the event. 🧵
13.08.2025 02:29 — 👍 57 🔁 27 💬 5 📌 5
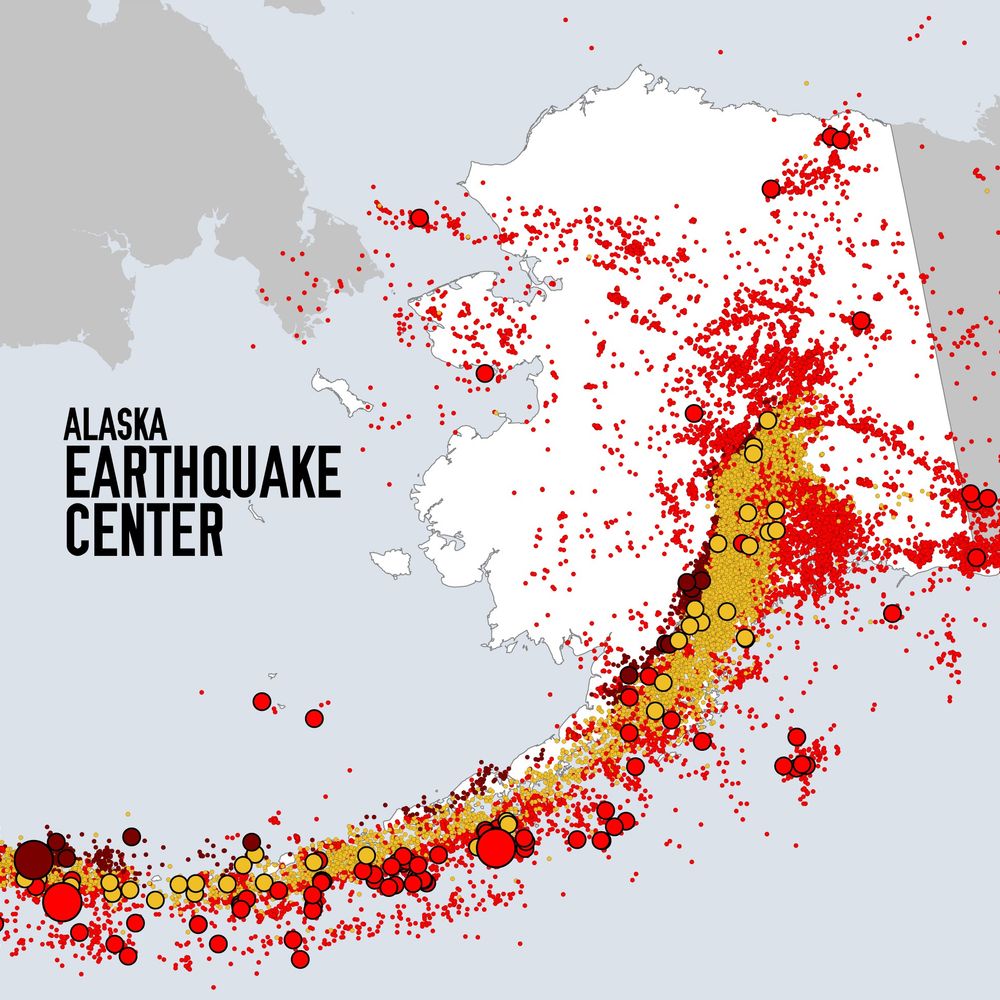
Seismicity map of western Turkey
The M6.1 shallow #earthquake near Bigadic, Turkey, occurred on a normal fault system, possibly the Sindirgi-Sincanli Fault Zone. A similar event occurred near Simav in 2011 and generated significant damage around the epicenter. ⚒️🧪
10.08.2025 18:15 — 👍 21 🔁 11 💬 1 📌 0Dharali flash flood analysis by ISRO
www.isro.gov.in/indian_satel...
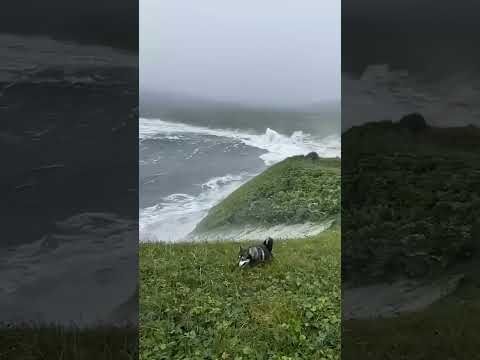
Tsunami video allegedly taken at Pionerskaya bay after the M8.8 Kamchatka #earthquake. HOLY SHIT! This guy and his dog are unbelievably lucky. 🧪⚒️ #geology
youtube.com/shorts/LhFQ2...
Looks like a small swarm in the Fontana trend. This M4.2 had a few foreshcoks including a M3.0. The Fontana trend is a NE-striking lineation of earthquakes under the sediments of the San Bernardino Vslley. We believe it is one of the left-lateral striking faults that are south of the San Gabriels.
31.07.2025 16:41 — 👍 79 🔁 20 💬 3 📌 1Watch the seismic waves from the magnitude 8.8 earthquake off the coast of Russia sweep beneath seismic stations in North America.
By the time the waves reached North America, they are far too small to be felt by people, but can still be detected by seismic instruments. 🧪
A rule of thumb for tsunamis is that in open ocean, they move at similar speeds to commercial airliners. If you're ever curious how long it would take for a tsunami to get from one place to another, look up the duration of a similar-length flight.
30.07.2025 01:38 — 👍 848 🔁 213 💬 6 📌 14In 1952 there was a M 9.0 in the vicinity of today’s M 8.8 - here’s USGS info about that prior event off Kamchatka - earthquake.usgs.gov/earthquakes/...
30.07.2025 03:02 — 👍 12 🔁 6 💬 1 📌 0
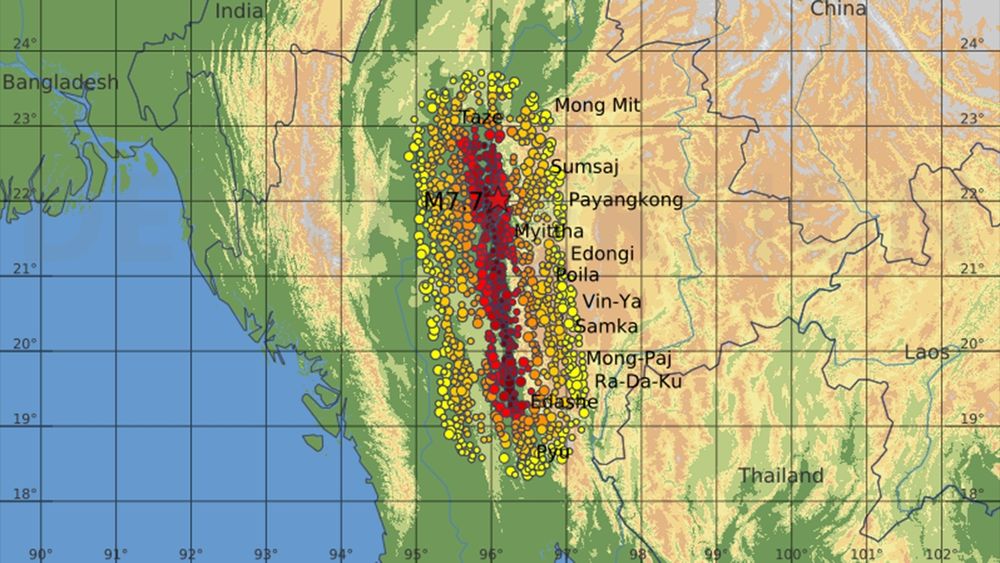
🔥OPEN ACCESS+PRESS RELEASE🔥The 28 March 2025 Mw 7.8 Myanmar Earthquake: Preliminary Analysis of an ∼480 km Long Intermittent Supershear Rupture#TSR ⚒️
A study of the recent Myanmar earthquake suggests supershear for some sections, reaching speeds of 5 to 6 km/s.
www.seismosoc.org/news/first-a...
BREAKING: Scientists are staging a “science fair” in the lobby of a Congressional building to tell elected officials about the critical knowledge the US will lose because their research grants have been canceled.
08.07.2025 15:31 — 👍 40592 🔁 11378 💬 1094 📌 864Please suggest what else can be done with the seismological data. If anyone is working on this already and wish to collaborate, please let me know :)
29.05.2025 19:45 — 👍 0 🔁 0 💬 0 📌 0A particle motion plot is needed to verify the earlier observation. I will also remove the instrument response to generate velocity and generate a shaking intensity map similar to what USGS does for earthquakes. Currently looking for any precursory event that might have been caught in the data.
29.05.2025 19:45 — 👍 0 🔁 0 💬 1 📌 0

One interesting observation is that for stations LAUCH and LKBD2, which are situated to the west of the landslide, the HHE component registered a higher energy than other components. My interpretation is that it is due to the incoming surface waves generated by the landslide from the east.
29.05.2025 19:45 — 👍 0 🔁 0 💬 1 📌 0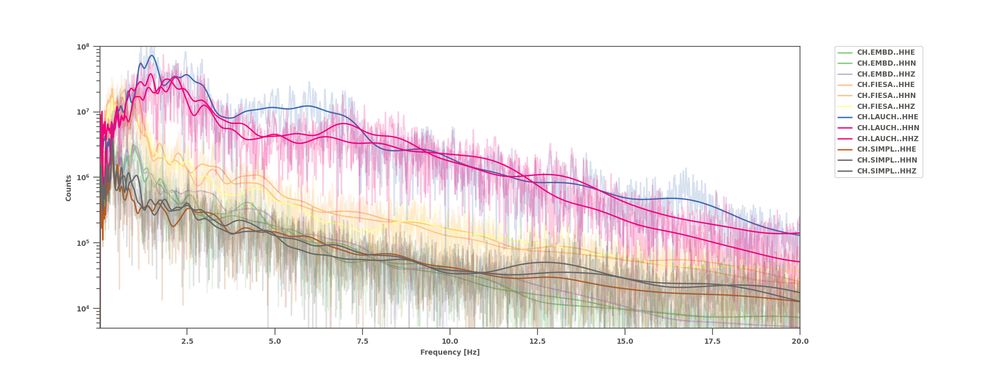
Amplitude spectrum shows that in the nearby stations the highest energy is concentrated in the 0.5 - 3 Hz bandwidth.
29.05.2025 19:45 — 👍 1 🔁 0 💬 1 📌 0The Blatten landslide was registered on nearby seismometers (station LAUCH is closest, within 10 kms). Spectrogram of the raw waveform shows high energy content in the frequency band 1 - 10 Hz. The spectral signature is similar to those recorded in other parts of the world.
29.05.2025 19:45 — 👍 2 🔁 0 💬 1 📌 0