blue and white dots on a black background in a pattern that somewhat resembles a snowflake
passed a dot density map I made of snow plows in toronto through a kaleidoscope filter and it kindof looks like a snowflake ❄️
29.01.2026 23:05 — 👍 6 🔁 0 💬 0 📌 0

Screenshot of a web-page with two side-by-side images of downtown Toronto. Left is nighttime aerial imagery from 2020, and the right is daytime aerial imagery from 2024.
Toronto open data has some cool nighttime aerial imagery from 2020
can view it alongside other historical aerial imagery on our page here: schoolofcities.github.io/historical-a...
20.01.2026 01:41 — 👍 9 🔁 2 💬 0 📌 0

heatmap with layer of blue-to-white points showing density of snow plows in Toronto on a black background
where do the snow plows go?
little weekend project mapping density of ~21 million GPS locations of snow plows during 48-hour period of on/off snow fall in toronto
#toronto #maps #gis #dataviz
18.01.2026 19:29 — 👍 12 🔁 4 💬 2 📌 1

Toronto Building Heights
Interactive map of building massing data across Toronto
made a quick interactive #map of building heights in #toronto (2025 data)
big fan of #tippecanoe -> #pmtiles -> #maplibre -> #github pages workflow, can pretty easily take a ~300mb .shp like this and viz it in-browser (no fancy db, server, or saas hosting)
schoolofcities.github.io/toronto-buil...
16.01.2026 13:01 — 👍 10 🔁 1 💬 1 📌 0
recent fun scrolly-maps by Aniket Kali and I on history of languages in Toronto
schoolofcities.github.io/languages/to...
#toronto #history #maps #languages
15.01.2026 16:14 — 👍 3 🔁 0 💬 0 📌 0

Multivariate map of Canada showing environmental vulnerabilities – biodiversity loss, water stress, soil degradation, and deforestation – alongside accumulated climate events from the past several years – including floods, wildfires, long-term sea level rise, and droughts. The map combines these eight impacts via small pie charts, that when combined represent the intensity of climate-change risks.

Eight small maps of Canada arranged in a grid showing climate change vulnerabilities – biodiversity loss, water stress, soil degradation, and deforestation – alongside accumulated climate events from the past several years – including floods, wildfires, long-term sea level rise, and droughts
couple interesting maps of climate change vulnerability across Canada by Isabeaux Graham on our team
check out more here: schoolofcities.utoronto.ca/layers-of-cl...
#maps #gis #canada #climateChange
14.01.2026 21:23 — 👍 14 🔁 3 💬 0 📌 0

map of the Annex neighbourhood in Toronto with a blue background and shades of blue to white indicating buildings, roads, trees, and sidewalks.
here's a blueprint style map of the Annex
(made this a few years ago, came to mind while working on something else recently)
#maps #toronto
12.01.2026 13:49 — 👍 9 🔁 0 💬 0 📌 0

5x10 grid of thumbnail images of maps I've made over the past couple years or so
recently updated a grid gallery of my maps on my personal website/portfolio -
check it out here :) jamaps.github.io/maps.html
#maps #dataviz #gis
04.01.2026 20:18 — 👍 8 🔁 2 💬 1 📌 0

interesting short-lived TTC subway map from 2007 with 5 lines/routes
source: transittoronto.ca/spare/0053.s...
#toronto #transit #ttc #maps
23.12.2025 20:04 — 👍 3 🔁 1 💬 0 📌 0

greyscale map of beirut and the surrounding area showing topography (highlighting hills and mountains) and building footprints (highlighting urban/built-up area)
made a map of Beirut yesterday
testing out a textured-greyscale style this time
#maps #beirut #rayshader #qgis #gimp
22.12.2025 13:51 — 👍 13 🔁 1 💬 0 📌 0

topographic hillshade map of cuba - land is shown in shades of greens and browns, water is a light blue
iterating on a map of Cuba via rayshader and gimp
testing out some different coastline/hierarchy effects this time
#cuba #rayshader #gimp #maps
21.12.2025 19:06 — 👍 7 🔁 1 💬 0 📌 0

topographic hillshade map of the island of taiwan - land is shown in shades of greens and browns, water is a light blue
more rayshader experimenting - made a quick map of Taiwan
#taiwan #rayshader #maps
18.12.2025 20:16 — 👍 14 🔁 2 💬 1 📌 0

topographic hillshade map of the island of Ireland - land is shown in shades of green-yellow, water is a light blue
trying to learn how to use rayshader - made this map of Ireland during the process
#ireland #rayshader #maps
18.12.2025 14:39 — 👍 16 🔁 1 💬 0 📌 0

map of glen stewart ravine in toronto with a dark background, glowing green lines to show contours, blue lines for streams, and dashed line for paths
iterating on a neon-topographic map style this evening
#maps #qgis #gimp
11.12.2025 00:39 — 👍 14 🔁 1 💬 2 📌 0

Bar chart comparing provincial or territorial minimum wages to living wages in 13 locations across Canada. The living wage is based on what a parent needs to earn in a two-parent household with two children, to support housing costs and other essentials based on location of residence. The bar chart is linked to locations of a map of Canada. Minimum wage varies from 15 to 20 dollars per hour, while living wage ranges from 20 to 30 dollars per hour.
Chart comparing minimum wages to local living wages across Canada
Created by Isabeaux Graham on our team for this report: schoolofcities.utoronto.ca/wp-content/u...
09.12.2025 12:55 — 👍 3 🔁 0 💬 0 📌 0

Map of Canada with a dot layer symbolizing different types of 'local solutions', organizations and initiatives working to solve complex challenges that communities are facing across Canada. Dots are coloured by different categories (e.g. housing, climate change, etc.) and clustered by province/territory.
Map we made for the School of Cities' Learning From What Works project — a major report profiling 89 amazing community projects and organizations from across Canada
Check out the report here: schoolofcities.utoronto.ca/research-pub...
05.12.2025 13:16 — 👍 5 🔁 1 💬 0 📌 0

Minimal map of Ottawa showing building footprints and rivers
Ottawa figure-ground type map digression from this morning
higher-res here: jamaps.github.io/maps/ott-bui...
#ottawa #maps
03.12.2025 12:42 — 👍 1 🔁 0 💬 0 📌 0

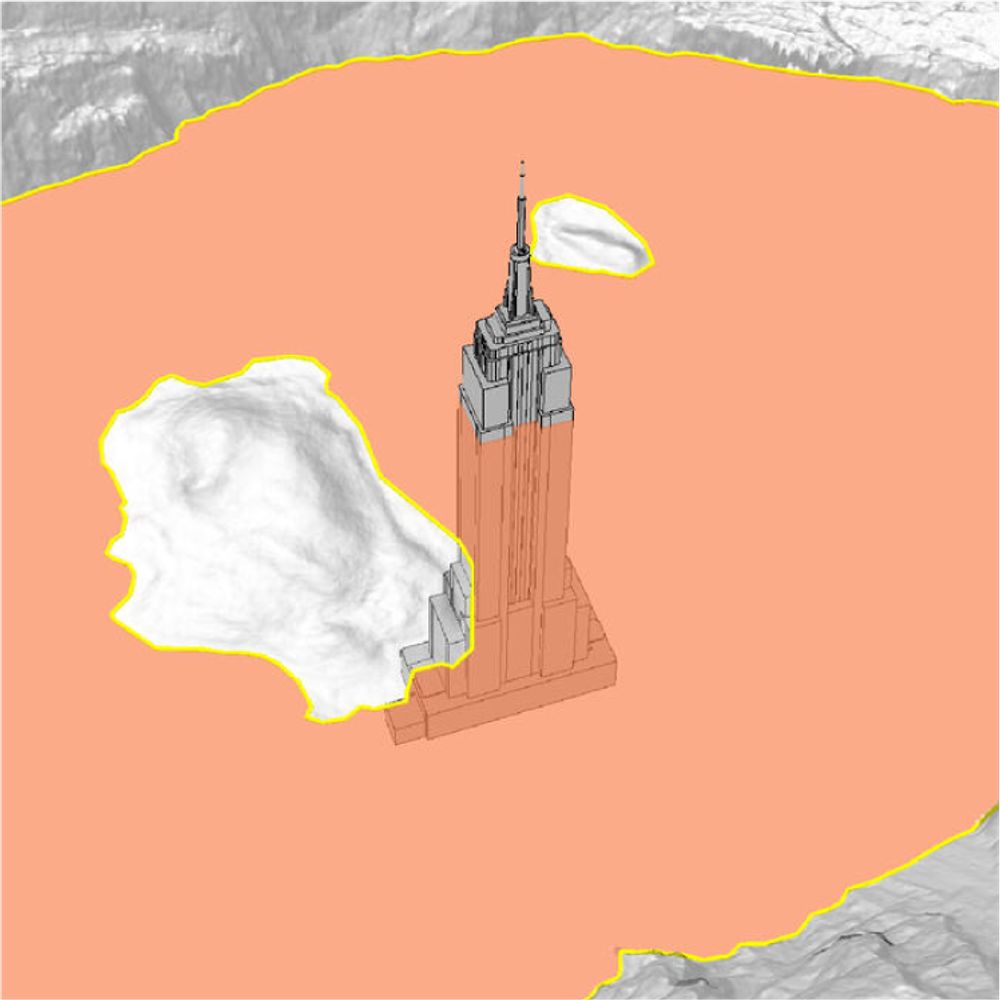
Map of the City of Toronto shaded on two gradients A) from light blue-ish green to light red based on elevation and B) from light to dark showing slope of the land. The map highlights overall elevation patterns in the City, as well as highlights big river valleys and escarpments
recent map experiment of Toronto's terrain
made via QGIS/Inkscape/GIMP and TIN data from @torontoopendata.cityof.toronto.ca
higher-res here: jamaps.github.io/maps/terrain...
#toronto #maps #terrain #topography
02.12.2025 13:49 — 👍 9 🔁 4 💬 0 📌 0

Graphic of six maps stacked on top of each other of Finch West Line 6 and surrounding land-use: Finch West LRT route, building footprints, population density, space for cars, trees and green space, and zoning. Each map is at the same geographic scale and area.
Recently made a few maps of the new Finch West Line 6 + surrounding land-use
More here: schoolofcities.utoronto.ca/maps-of-line...
#toronto #transit #maps
29.11.2025 16:02 — 👍 36 🔁 9 💬 3 📌 1

Line chart showing population within 800m from Line 6 Finch West LRT stations. There are two lines, one for the population in 1996 and the other population in 2021. The difference between the lines shows where there has been population growth or decline over this 25 year period.
Line 6 Finch West is opening soon - here's a chart of 25 years of population change along the route
I adapted this from Michael Liu's great work here: schoolofcities.github.io/tod-toronto-...
#transit #dataviz #toronto
27.11.2025 17:15 — 👍 20 🔁 4 💬 0 📌 0
correct!
23.11.2025 01:16 — 👍 1 🔁 0 💬 0 📌 0

Stacked bar chart showing the number of apartment units in Toronto by year of construction with categories for private, TCHC, and other social housing. The vast majority were built in the 1960s and 1970s, with a minor up-tick in recent years.
Charting number of rental units in apartment buildings in Toronto by year of construction
(This is a quick update to a similar chart I made ~2.5 years ago)
#toronto #housing #dataviz #NationalHousingDay
22.11.2025 13:03 — 👍 46 🔁 15 💬 3 📌 8
Really enjoy working on @uoftcities.bsky.social projects like this.
Heavy lifting by @jamaps.bsky.social with data analysis & visualization. Also Mia Wang who’s led data collection and GIS data processing.
Who are streets for?
h/t @daniel-romm.bsky.social @ohtheurbanity.bsky.social #IdeasAtWork
01.10.2025 13:33 — 👍 7 🔁 3 💬 1 📌 0

screenshot of map of rail trail route in Albuquerque

screenshot of a bar chart of visits to downtown Albuquerque

screenshot of maps of high-collision intersections in central Albuquerque

screenshot of maps of socio-economic metrics by neighbourhood in central Albuquerque
Graphics from our recent case study "From Tracks to Trail: Planning for equitable (re)development" (Albuquerque, New Mexico)
Read it here: schoolofcities.github.io/eddit/albuqu...
#maps #dataviz
26.09.2025 14:08 — 👍 3 🔁 0 💬 0 📌 0

linear heatmap of parking ticket density in the City of Toronto
mapped a decade of parking tickets in Toronto
made this a while ago, might update it in the new year if there's interest
schoolofcities.github.io/parking-tick...
#parking #toronto #maps #dataviz #opendata
24.09.2025 15:32 — 👍 12 🔁 4 💬 0 📌 2

Who are streets for?
81% of street space in Toronto is inequitably dedicated to motor vehicles. How can this be fairly re-designed?
check out our recent project mapping street space allocation in Toronto
we find that more than 80% of transportation infrastructure in Toronto is designed for cars, far more than how people actually travel
w/ @lanrickbennett.bsky.social & Mia Wang
schoolofcities.github.io/who-are-stre...
10.09.2025 12:39 — 👍 88 🔁 43 💬 2 📌 5

Choropleth map of the greater Toronto and Hamilton area showing what % of children (aged 6-17) are driven to school. The map legend includes a bar chart ranking municipalities in the region. Toronto is the lowest at 31% and Aurora the highest at 51%.
quickly mapped out estimates of what % of children are driven to school in the greater toronto/hamilton area
check out more related maps from this data here: schoolofcities.github.io/transportati...
02.09.2025 20:50 — 👍 9 🔁 3 💬 0 📌 0
recent maps/scrollytelling piece on under-valued surface parking lots in Toronto (via an analysis of property tax data)
view the project here: schoolofcities.github.io/underutilize...
#toronto #maps #dataviz #parking
21.08.2025 17:20 — 👍 5 🔁 2 💬 0 📌 0

a brick-paved raised pedestrian crossing with temporary orange-and-black traffic barrels on either side indicating recent construction
I like this new raised pedestrian crossing at Draper and Wellington
#toronto #urbandesign #walkability
20.08.2025 00:22 — 👍 6 🔁 0 💬 0 📌 0
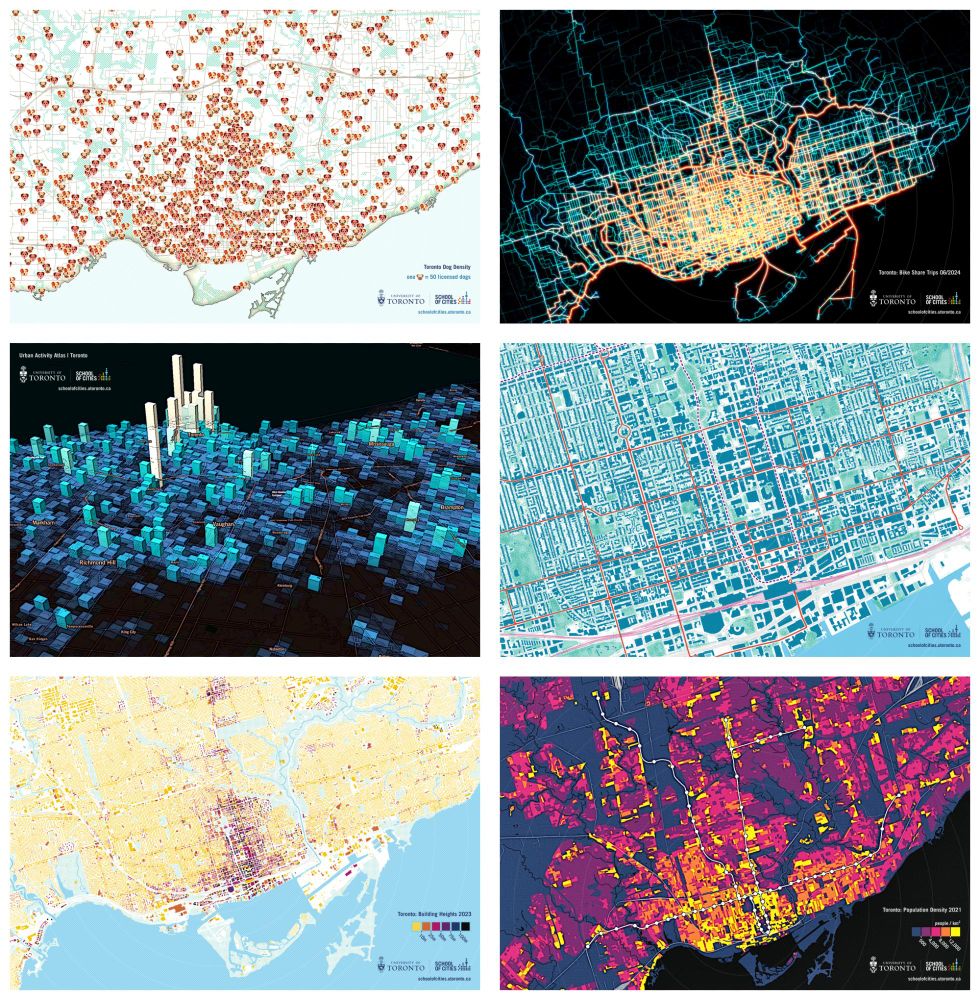
grid of 6 postcards of Toronto, each is an abstract map or data visualization of sorts
recently updated and printed more @uoftcities.bsky.social Toronto-map-viz postcards
planning to give out a bunch at Civic Spark tomorrow
#maps #dataviz #toronto
15.08.2025 18:58 — 👍 8 🔁 3 💬 0 📌 1
Former School Board Trustee, currently infuriated with Ford putting our school boards under supervision. Sign the petition at handsoffourschools.ca
Global advisor on better cities, city planning, transportation & urban change. City planner + urbanist leading @ToderianUW.bsky.social. Past Chief Planner for Vancouver BC. Past/founding President of @CanUrbanism.bsky.social. International speaker & media.
Population Geographer | Spatial Demographer.
Partial to words like orthogonal + heterodox.
Also very partial to shoes.
rachelfranklin.org + rachelfranklin.substack.com
Professor, UW Biology / Santa Fe Institute
I study how information flows in biology, science, and society.
Book: *Calling Bullshit*, http://tinyurl.com/fdcuvd7b
LLM course: https://thebullshitmachines.com
Corvids: https://tinyurl.com/mr2n5ymk
he/him
Chair, Computational BIology and Medicine Program, Princess Margaret Cancer Centre, University Health Network.
Associate Professor, Medical Biophysics, University of Toronto.
Disclosures: https://github.com/michaelmhoffman/disclosure/
📊 Data visualisation specialist.
💻 #RStats | #Python | #D3.
🎨 Generative artist.
🏃♀️ Runner.
Website: https://nrennie.rbind.io/
She/her. Views my own.
Researcher on urban planning and public transportation.
https://marcochitti.substack.com/
News and updates from the City of Toronto's Cycling and Pedestrian Projects unit. Email cycling@toronto.ca for inquiries. Social Media Terms of Use: toronto.ca/socialmedia.
Housing Policy | Race Relations | Community Development | Reparative Justice
Associate Professor - Sociology
University of Toronto
www.drdantzler.com
Founding Director - Housing Justice Lab
School of Cities
www.housingjusticelab.org
AI-skeptic AI researcher at the University of Toronto
The Urban Institute is a research-to-impact institution founded on one simple idea: To improve lives and strengthen communities, we need practices and policies that work.
New York Times journalist covering cities and urban policy for The Upshot. emily.badger@nytimes.com, ebadger.21 on Signal
Designer who knows some things about web archives, OpenStreetMap enthusiast, occasional maker of music.
Prev @webrecorder.net Currently @EQTY
City columnist, contributing to the Toronto Star & writing the award-winning City Hall Watcher newsletter. A lot about Toronto Politics and then some nerd stuff. Humber College prof. (he/him)
FSU Geography assistant prof. Geographies of aging, mobility, and technology. She/Her
● Professor @journalismdesign.bsky.social
● Interactive data journalist pudding.cool
● Moar buttondown.com/charthead // alv9n.com
Transport Planner & Researcher
Creative Director | cityux.com
Research Lead | infrastoryinsights.com
https://youtu.be/vAygH6SZg28?si=lY-5xtbZl6yPv823
The Pudding is a digital publication that explains ideas debated in culture with visual essays. https://pudding.cool/
Email: sup@pudding.cool
Support us: http://patreon.com/thepudding
Graphics editor @nytimes.com weather. Formerly @mapbox.com
https://williambdavis.ca/