Point of no return: a hellish ‘hothouse Earth’ getting closer, scientists say
Continued global heating could set irreversible course by triggering climate tipping points, but most people unaware
That we are in the process to trigger a runaway warming into a hot house is entering slowly mainstream
"The world is closer than thought to a “point of no return” after which runaway global heating cannot be stopped, scientists have said"
Only the full potential of humanity will be able to stop it
11.02.2026 18:47 — 👍 2 🔁 1 💬 0 📌 0
Point of no return: a hellish ‘hothouse Earth’ getting closer, scientists say
Continued global heating could set irreversible course by triggering climate tipping points, but most people unaware
Slowly I get mainstream:
"The world is closer than thought to a “point of no return” after which runaway global heating cannot be stopped, scientists have said"
Only the full potential of humanity will be able to stop it
So many feedback's now starting to operate
The ocean is the worst
#climate
11.02.2026 18:37 — 👍 4 🔁 2 💬 1 📌 0

A short on the main principle behind the recent intensification of extremes
The main driver behind intensifying extremes caused by global warming is now coming increasingly into focus: the mutual amplification of…
As I'm highly fascinated how this system goes now into overkill mode here a short on the main principle that drives the recent intensification of extremes
I even text corrected it - LOL***
#climate
11.02.2026 15:08 — 👍 3 🔁 1 💬 0 📌 0


@climatenews.bsky.social here you have the climatology peak that this MHW produced in June 2023.
Its all about mechanisms and their interacting complexity.
Sadly, simple narratives trump the complexity behind real world changes
Such peaks are impossible to be caused by just one mean change
11.02.2026 14:05 — 👍 0 🔁 1 💬 0 📌 0
Important: a second storm slamming into the atmospheric river is one of the possibility of how extremes can mutually amplify themselves...
11.02.2026 14:01 — 👍 0 🔁 1 💬 0 📌 0

Storms that hit Spain the last months...
The ocean atmosphere North Atlantic circulation is now being preconditioned to initiate storms and to intensify them...
14 till now since October 2025...
www.facebook.com/spainweather...
#climate
11.02.2026 13:58 — 👍 6 🔁 5 💬 1 📌 0
@climatenews.bsky.social here a small thread on the causes of the till date most exceptional marine heatwave that happened in 2023 in the North Atlantic
The one on the NP the last years is even more exceptional but will take a while for more studies.
Important: IMO2020 did not play a large role
11.02.2026 12:27 — 👍 1 🔁 0 💬 0 📌 0
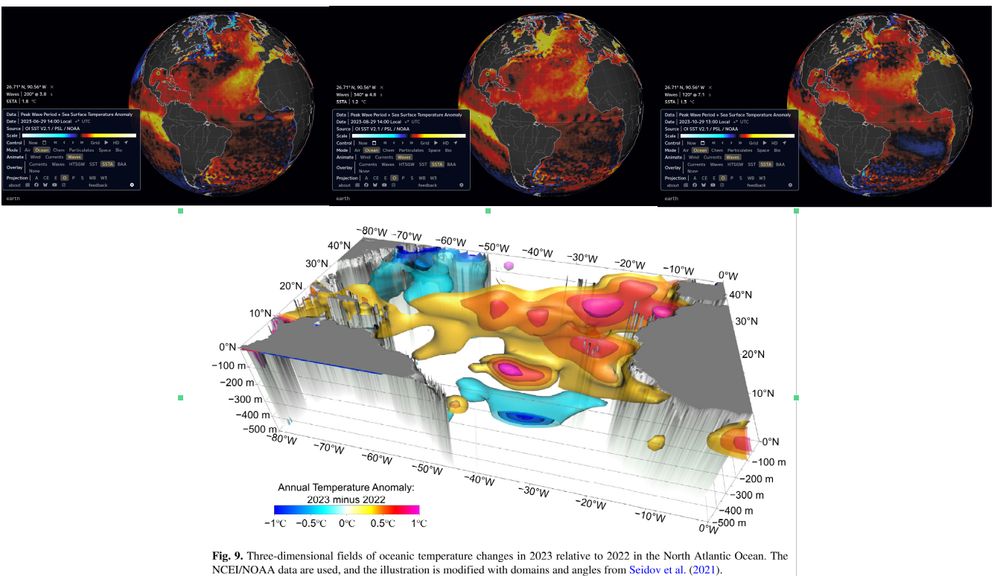
Shows the heat accumulation in the NA in 2023. Most of it happened in the area where the marine heatwave persisted, where ocean heat uptake had been confined to the first 300m.
The following graph shows a main principle of marine heatwaves:
The intensification of surface warming intensifies upper ocean stratification shifting ocean heat uptake to the first 300m.
The NA MHW in 2023 had been a striking example...
11.02.2026 12:24 — 👍 1 🔁 0 💬 0 📌 0

Remarkable 2023 North Atlantic Ocean Warming
The North Atlantic had record high sea surface temperatures (SSTs) and mixed layer temperatures in summer 2023 Extreme SSTs and mixed layer temperatures were caused by atmospheric heat flux Evap...
A shallower mixed layer of the upper oceans is a global feedback caused by wind changes and upper ocean stratification - summer and seasonal signals
"A second contributor to the record SSTs was the preconditioning of mixed layer temperature following a series of anomalously warm years."
11.02.2026 12:20 — 👍 1 🔁 0 💬 0 📌 0

The 2023 marine heatwave in the North Atlantic tropical ocean
Abstract. In the context of climate change, marine heatwaves (MHWs) are becoming more intense and frequent and/or lasting longer. During the year 2023 and based on the Copernicus Marine forecasting sy...
Highly relevant to understand todays changes: its mutual amplification between extremes (E) and upstream E's driving downstream E's
"This questions the hypotheses of additivity between mean climate and internal modes of atmospheric variability, which are traditionally made in attribution studies."
11.02.2026 12:19 — 👍 1 🔁 0 💬 0 📌 0
Shows the North Atlantic marine heatwave in 2023 - massive one extending in a horseshoe pattern from the tropical western NA all the way to the eastern basin bending up north off the northwestern coast of Africa.

Surface atmosphere coupling behind the marine heatwave:
A weak Azores high causing weak surface winds supporting less upper heat loss due to surface winds, thereby upper mixed layer depth declines, reduced cloud cover (higher SSTs evaporate low marine clouds and low moisture values suppress cloud formation), which then reinforces suns incoming radiation, all intensifying global warming caused upper ocean stratification, feeding back on SSTs as less heat is mixed below the upper mixed layer.

(a) shows how the heat accumulated especially across the first 100m of the North Atlantic over the area of the MHW.
(d) shows how stratification increased in this area.
(e) show the ocean heat anomaly in this area.

The graph gives an indication on how exceptional this event had been as it had been far outside the historical SST distribution range.
A new study finds only a marginal contribution of IMO shipping SOx reductions in 2020 and the exceptional marine heatwave in the North Atlantic in 2023
This result is inline with other studies of the event which had been driven by internal and external feedbacks and (forced) variability.
#climate
11.02.2026 12:15 — 👍 5 🔁 2 💬 7 📌 0
From a leading expert on marine heatwaves:
"Basin-scale averages often mask regional fingerprints, which are key to understanding the drivers of change"
Why the oceans are overheating is a story of the feedback complexes that drive regional extremes that show that we have here a global feedback
11.02.2026 10:30 — 👍 3 🔁 0 💬 0 📌 0

A graph showing the rise of sea surface temperatures
Here the sources for the numbers:
0.3°C warming in the second half of 2023
"Record High Temperatures in the Ocean in 2024"; https://link.springer.com/article/10.1007/s00376-025-4541-3
For the 0.97 °C number:
"Indicators of global climate change 2023: annual update of key indicators of the state of the climate system and human influence”; https://essd.copernicus.org/articles/16/2625/2024/
To understand the importance of ocean surface warming in 2023 the annual mean compared to the jump is a nice first step
In the second half of 2023 global SSTs increased by ~0.3°C. Compared to that jump the increase from 1850-1900 to 2014-2023 had been 0.97°C.
#climate #UÖÄÜ1SST
11.02.2026 10:23 — 👍 1 🔁 0 💬 0 📌 0
YouTube video by ITV News
UK weather: How bad has the flooding been? And will the rain ever stop? | ITV News
This year some regions in England had constant rain
Lots of low pressure system came in from the North Atlantic
Conditions become more favorable fast for storm series - mutual amplification possible
"How bad has the flooding been? And will the rain ever stop?"
www.youtube.com/watch?v=95Li...
11.02.2026 00:28 — 👍 1 🔁 0 💬 0 📌 0

Discovering new connections between Great Lakes' winter storms and global climate patterns
About a year ago, researchers at the University of Michigan found that the extratropical cyclones that are the biggest drivers of winter weather in the Great Lakes region are warming and trending nort...
"extratropical cyclones that are the biggest drivers of winter weather in the Great Lakes region are warming and trending northward", growing in size, and intensifying which then intensifies their teleconnections modulating increasingly NH circulation, driven by ocean warming...
#climate #earth
10.02.2026 11:30 — 👍 14 🔁 9 💬 1 📌 0

Scientists learn that forests capture more methane from the air as the planet warms
New research reveals that drying forest soils can boost methane uptake, offering a small but important climate benefit as warming continues.
While they will burn down...
Will happen now fast as forests are dried out by extremely hot thirst waves supported by drying out continents, circulatory feedbacks, and oceans heat accumulating increasingly closer to the surface speeding up intensification's of mutually amplifying extremes...
10.02.2026 09:49 — 👍 5 🔁 4 💬 0 📌 0
Hi Zack, I would love to read that study - highly important fundamental stuff...
"The Atmosphere as a Heat Engine Operating at Maximum Power" journals.ametsoc.org/view/journal...
07.02.2026 23:16 — 👍 0 🔁 0 💬 0 📌 0
"The Atmosphere as a Heat Engine Operating at Maximum Power"
I would love to read this study as it explains some intricacies...
If anyone can access this study?
Highly important stuff!
journals.ametsoc.org/view/journal...
07.02.2026 23:15 — 👍 1 🔁 0 💬 0 📌 0
One of my dreams:
What I would love would be a digital twin of all the important processes, infrastructures, and transport processes showing nodes that become dysfunctional for a time, also with a index showing mean "repair" times
I bet since some years the blinking activity increased markedly
07.02.2026 20:07 — 👍 0 🔁 0 💬 0 📌 0
Isn't that too high?
A mean annual increase by 3ppm should be way too high - more around >2ppm...
At least with all numbers I know...
07.02.2026 19:51 — 👍 1 🔁 0 💬 2 📌 0
YouTube video by DW News
Indonesia: Growing threat from far-right radicalization | DW News
Capital is spreading the rise of fascism to secure wealth concentration on a dying planet which will lead to the destruction of all wealth as these fucking morons have no idea of the oscillatory overkill mode that is now becoming operational inside the physical Earth system...
#Earth #climate
07.02.2026 11:08 — 👍 1 🔁 0 💬 0 📌 0

Showing mode results and in the lower left corner observations on the controlling factor (troposheric stability) of low marine cloud cover.
"Responses to Lower-Tropospheric Stability Dominate Intermodel Differences in the Historical Pattern Effect"; https://agupubs.onlinelibrary.wiley.com/doi/10.1029/2025GL117015?af=R

Shows the low marine stratocumulus regions located off the west coasts of the continents

Shows nicely the zonal temperature gradients in the oceans that controls low cloud cover - oops!
A nice graph showing how the SST pattern effect controlling low cloud cover over the oceans (low marine stratocumulus regions) is already end of the 90s close to leave mode spread.
Importance here: we get a significant cloud feedback driven by higher SSTs and drying out continents
#Earth #climate
07.02.2026 08:15 — 👍 4 🔁 0 💬 0 📌 0
Waitress turned Congresswoman for the Bronx and Queens. Grassroots elected, small-dollar supported. A better world is possible.
ocasiocortez.com
Australian snow and snow weather, hydrology, climate ... other stuff. I reciprocal follow, and block abusive posters.
News updates from the Southern Pole. Includes headlines & weather updates.
ECMWF senior scientist working on monitoring global #wildfire emissions, #airquality, atmospheric chemistry & #scicomm for the #CopernicusAtmosphere Monitoring Service @copernicusecmwf.bsky.social @ecmwf.int
News about the status of our changing climate and environment and the actions being taken to mitigate the risks of climate change. Main areas of focus are on climate politics, climate data, ecological research and renewable energy. 🌏
Energy, emissions, & climate
CICERO Center for International Climate Research, Oslo, Norway
https://cicero.oslo.no/en/employees/glen-peters
ClimaMeter is a rapid framework for understanding extreme weather events in a changing climate based on looking at similar past weather situations. Follow our study on https://www.climameter.org
Transform your Bluesky threads into elegant reading experiences.
Skywriter provides a thread unroll/ threadreader service. Just copy/paste the thread link on our homepage.
https://skywriter.blue
PhD, Conservation Biology, @uni-goettingen.de
#Science-based #community-led #conservation in #African #Rainforests
#CameraTrap #GIS #Ecology #Wildlife
🌍Cameroon & Germany
https://uni-goettingen.de/de/vianny+rodel+nguimdo+vouffo/673858.html
A bot by @Climatologist49.bsky.social showing ERA5 maps and charts. It randomly selects one from a folder that is reset every month. DM this account or Climatologist49 for map requests. He will run the script to generate the map/chart.
89-year old Holocaust survivor, Ph.D. in Political Science from Columbia University. I have strong opinions about politics, economics, societal problems and a life well lived.
Climate Systems Scientist
Website: PaulBeckwith.net
YouTube Channel: https://youtube.com/@paulhbeckwith?si=3ijcLGbn7mZgQZHM
Offizieller Account von netzpolitik.org, dem Medium für digitale Freiheitsrechte. Anfragen bitte per E-Mail an kontakt@netzpolitik.org.
Human | Climate Scientist | Meteorologist | Stormchaser | Queer
@unileipzig | ex-@ecioxford | @S4F | YIMBY | he/him 🏳️🌈🏳️⚧️🦄 💕
#bekind #diversity #equality #empathy #inclusivity #fightfascism
#WakeTheFuckUp!! #TeamJoyResistance
https://thueringen-weltoffen.de
The biosphere is in crisis due to factors that include global warming, biodiversity loss, overpopulation, overshoot, & plastic pollution. My aim is to increase awareness of urgency for action
editor of https://elephant.earth
mainly interested in the climate and environmental emergency
Climate Activist, Raising Climate & Humanitarian Awareness, Supporting Scientists getting their word out to Media, Politicians and the Public at international level, especially Europe and Italy
I'm an old guy, a field biologist with career trail to many places. i wound up growing native plants in the Northwest US. Now retired, I'm following some interesting study topics, like Oceanography and macroeconomics of our changed climate.
Meteorologe, WissenschaftsJournalist, NetzAktivist. Freund von Fakten und Pragmatismus. Mit einer renitenten Grundeinstellung gegenüber Geschichtsignorierenden #FCKNZS, #AfDern und anderen Dummköpfen wie #Physikignoranten.
Research Meteorologist at NOAA’s NCEI. We archive your data and I play with it. On this hell site too along with all the others.