I like it - a single unified risk disclosure. At least prospectuses would be shorter!
19.05.2025 21:02 — 👍 1 🔁 0 💬 0 📌 0
Regulators already struggle to define jurisdictional lines and cooperate with other agencies. I can't imagine how they would handle this new world order.
19.05.2025 20:15 — 👍 0 🔁 0 💬 1 📌 0

Bar chart comparing the top 10 ETFs by year-to-date net flows.
$VOO is on pace to shatter every ETF flows record this year. Only 3 ETFs ($VOO, $SPY, and $IVV) have brought in over $50B in a year.
It's good to see cheap versions of popular ETFs in the top 10 by inflows: $SPLG and $QQQM. Long-term investors will benefit from the cost savings.
19.05.2025 18:39 — 👍 0 🔁 0 💬 0 📌 0

4 Fund Fee Trends to Watch in 2025
A look at the forces shaping US fund fees in 2025 and beyond.
Dig deeper into these trends 👇
Article: spr.ly/6011N5aSN
Full report: spr.ly/6017N5aSL
Morningstar Direct users can run their own custom analysis using the U.S. Fund Fee Trends notebook in the Research + Analytics module.
15.05.2025 15:51 — 👍 1 🔁 0 💬 0 📌 0

Vanguard remains the low-cost leader with an asset-weighted average fee of just 0.07%.
Four of the five largest fund families were among the five cheapest in 2024, with Dimensional the cheapest provider outside the five biggest firms.
4/5
15.05.2025 15:51 — 👍 1 🔁 0 💬 1 📌 0
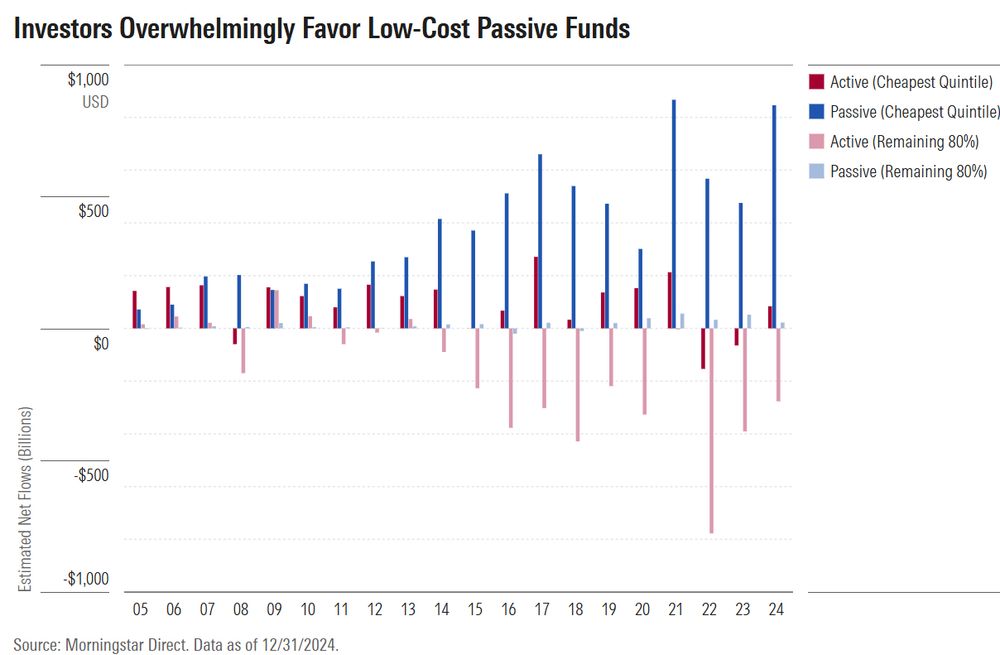
Bar chart comparing active and passive fund fees broken out by cheapest fee quintile and remaining 80%.
Investors have shown much more interest in cheap funds than expensive ones. The cheapest 20% of passive funds collected $2.8 trillion of inflows since 2021, while investors pulled $1.4 trillion out of the priciest 80% of active funds.
3/5
15.05.2025 15:51 — 👍 1 🔁 0 💬 1 📌 0

Historical line chart comparing average fee of new mutual fund and ETF fees annually.
ETFs hold a considerable fee advantage over mutual funds, partly because of their passive investing origin. That doesn't mean all ETFs are cheaper--new ones are actually raising the equal-weighted average price of ETFs due to increasingly complex and active new offerings.
2/5
15.05.2025 15:51 — 👍 1 🔁 0 💬 1 📌 0

Historical line chart comparing ETF and mutual fund fees.
Morningstar's 2024 US Fund Fee Study is live!
We estimate that investors saved $5.9 billion in fund expenses last year compared to 2023.
My colleague, Zachary Evens, analyzed the fee trends shaping the fund industry and explains what they mean for investors.
1/5
15.05.2025 15:51 — 👍 1 🔁 0 💬 1 📌 0

Graphic
Semiliquid vehicles like interval funds have exploded in popularity, but investors and advisors have lacked the right tools to evaluate them.
We’re proud to announce we're extending our Medalist Rating to cover these vehicles, helping investors make sense of the options.
06.05.2025 15:33 — 👍 0 🔁 0 💬 0 📌 0

Table comparing performance metrics of diversifier ETFs.
Diversifying your portfolio is critical as risks grow for US stocks. In this article, I look at some ways to hedge the risk of stocks and how you can construct a resilient portfolio.
Check out the link for more!
https://www.morningstar.com/funds/how-etf-diversifiers-performed-during-market-turmoil
16.04.2025 15:57 — 👍 0 🔁 0 💬 0 📌 0

Bar chart comparing fixed income ETF categories with most inflows and outflows from April 3 through April 7.

Bar chart comparing stock ETFs with most inflows and outflows from April 3 through April 7.
US ETFs brought in $18 billion as markets sold off from April 3-7.
$SPY and $VOO were the main beneficiaries, while bond investors rotated out of credit risk into Treasuries and ultrashort bond ETFs.
http://spr.ly/63327FLUPf
10.04.2025 20:13 — 👍 0 🔁 0 💬 0 📌 0

Line chart comparing TSLL and TSLA performance since 2022, with a performance table at the bottom.
Investors should avoid single stock ETFs like the plague.
Leverage resets daily, so the ETF buys more when prices go up and sells when they go down. This is known as volatility decay. More vol = faster decay. Over its short lifetime, $TSLL has lost 55% while $TSLA has lost 4%.
10.04.2025 19:18 — 👍 0 🔁 0 💬 0 📌 0
Buying the dip in TQQQ is a tale as old as time
12.03.2025 20:45 — 👍 1 🔁 0 💬 1 📌 0
Chief European Market Strategist @ Morningstar
A markets and finance blog that's outside the FT paywall. All we ask is that you register to read: https://on.ft.com/3tDRiiu
Founder, Life + Liberty Indexes (Freedom 100 EM Index: FRDM) We sponsor the world's first freedom-weighted emerging markets ETF.
freedometfs.com
We are a leading provider of independent investment research. Our mission is to empower investor success. http://www.morningstar.com
www.awealthofcommonsense.com
wrote a book called "in this economy?" | chair of the federal reserve | writing and youtube @ http://kyla.substack.com
Financial Advisor • CNBC Advisor Council • Father Figure • Internet Creature • Buy Money Together
http://www.domoneytogether.com
I ask a lot of questions. Lead Independent Director of Finance Bluesky. Portfolio Mangler. Take each post with a grain of sea salt. Not opinions of Bridgewater LLC.
Co-host of the Odd Lots podcast. I like financial crisis hindsight, spurious correlation and puppies. London ➡️New York ➡️Abu Dhabi ➡️Hong Kong ➡️New York
Equity Analyst/PM.
the most curious person in the world
An optimist who assumes everyone is full of shit or lazy. Smart because he forgets. Fuck everyone against sensible gun reform. 👨👩👦👦👶🏻🐶🍔🍺🏀⚾️📊🤘
Master shape rotator (yes, that Ramp Capital from Twitter)
Editor of FT Alphaville. Norwegian, despite the Harry Potteresque name.
Cohost of The Odd Lots Podcast
Singer and guitarist in Light Sweet Crude
The first word in business news.
Newsletters: http://bloom.bg/newsletters
Podcasts: http://bloom.bg/podcasts
The Big Take podcast: http://trib.al/jtoXfuT
Financial Futurist, Music Nerd. New content at Nadig.com. And playlists. And hot ETF takes. And Nerdery. And Woo.
Let's hope this one works out better...
Chair/CIO of RWM; Masters-in-Business podcast/radio host
Investor, CEO, Dad
https://www.downtownjoshbrown.com/
🤓 Your resident market nerd 💙 Author of OptimistiCallie 👉 https://www.optimisticallie.com/subscribe