Psychology adjacent here but Google scholar searches index article bodies; I’ve had some success searching something like “favorite journal name(s)” AND “lme4” AND “osf.io” AND “randomized”
15.12.2025 13:02 — 👍 1 🔁 0 💬 0 📌 0

course schedule as a table. Available at the link in the post.
I'm teaching Statistical Rethinking again starting Jan 2026. This time with live lectures, divided into Beginner and Experienced sections. Will be a lot more work for me, but I hope much better for students.
I will record lectures & all will be found at this link: github.com/rmcelreath/s...
09.12.2025 13:58 — 👍 658 🔁 236 💬 12 📌 20
Numerically. The same pp difference at baseline becomes very exaggerated in pomp terms as baseline scores improve.
09.12.2025 14:04 — 👍 0 🔁 0 💬 0 📌 0
Right. 16.7 vs 20 in pomp terms even with the exact same % point gain. More exaggerated at the tails too. I’m skeptical that requiring those with worse baseline scores to improve more in %point terms to have the same pomp scores is a desirable measurement property in most circumstances.
09.12.2025 12:34 — 👍 1 🔁 0 💬 1 📌 0
Doesn’t pomp potentially conflate differences baseline ratings with group differences? Both groups could have similar improvements on the ordinal scale but quite different pomp scores if they start with different satisfaction ratings.
09.12.2025 12:13 — 👍 1 🔁 0 💬 1 📌 0
Or at least that using a linear model on an ordinal outcome risks mis-specifying the difference between men and women if the variances of their sleep satisfaction also differ.
09.12.2025 11:55 — 👍 2 🔁 0 💬 1 📌 0
“The gang goes to city hall” in which the gang compete to fix a clerical error with the city. Mac and Dennis try to resolve the issue amicably at city hall. Dee tries secretly dating an officer of the liquor control board. Charlie and Frank hatch a plan to get Frank elected mayor.
02.12.2025 00:19 — 👍 1 🔁 0 💬 0 📌 0
Folks who teach stats to graduate students in applied fields - do you discuss ordinal methods in depth? The Liddell and Kruschke paper? (Analyzing ordinal data with metric models: What could possibly go wrong?)
What do you recommend to students who often use ordinal outcomes? #statssky
01.12.2025 16:56 — 👍 3 🔁 0 💬 1 📌 0
oh that is slick!
10.11.2025 19:23 — 👍 0 🔁 0 💬 0 📌 0
I know it’s often not identifiable and challenging to fit but I get very nervous about the exclusion of the time|id random slope in these models based on the 2013 Barr paper.
10.11.2025 19:08 — 👍 0 🔁 0 💬 1 📌 0

image of code with BLUPs

output of code
Oh you know I assumed you were plotting the RE estimates like this. If its just the observed data, probably min/max if few estimates/group and Q3/Q1 if many. You could probably even do tiny box plots if you didn't have too many groups.
28.10.2025 21:57 — 👍 1 🔁 0 💬 0 📌 0
I think to some extent the knee jerk reaction against the strong claim in the paper is due to the muddiness that (unfortunately) exists between prediction and causal claims. "Who is most as risk" as you state vs. why.
28.10.2025 13:14 — 👍 2 🔁 0 💬 1 📌 0
If they were bars it would be a caterpillar plot right? What about blupergram. Has a nice ring to it
28.10.2025 11:25 — 👍 2 🔁 0 💬 1 📌 0

A "methods primer" article in the journal "BMJ Medicine", titled "Factors associated with: problems of using exploratory multivariable regression to identify causal risk factors"
We wrote an article explaining why you shouldn't put several variables into a regression model and report which are statistically significant - even as exploratory research. bmjmedicine.bmj.com/content/4/1/.... How did we do?
27.10.2025 17:39 — 👍 276 🔁 110 💬 26 📌 20
Pretty sure this is one of those sexy offers two very smart podcasters told me to run away from. So I’m going to say maybe 😂
24.10.2025 00:05 — 👍 2 🔁 0 💬 0 📌 0
Love it! Will you be sharing data? (You know… for those of us teaching stats to CSD PhD students struggling to find cool and salient datasets)
23.10.2025 21:21 — 👍 2 🔁 0 💬 1 📌 0
Monty Python understood p-hacking
23.10.2025 08:43 — 👍 499 🔁 143 💬 5 📌 10
In all fairness, glmer does spit out a warning about non integers.
22.10.2025 19:32 — 👍 1 🔁 0 💬 0 📌 0
Anything can be an integer with round(x, 0)!
22.10.2025 19:27 — 👍 0 🔁 0 💬 1 📌 0
I’m very curious about what the third one is doing. Modeling a proportion without weighting by the number of trials? Could this could be useful if the proportion is not built out of independent Bernoulli trials?
22.10.2025 16:06 — 👍 0 🔁 0 💬 1 📌 0
Any #rstats folks know the differences in lme4::glmer()'s specification for aggregated binomials? (or reading rec's?) I'd like to confirm my understanding of these:
cbind(successes, failures) ~ ...
successes/trials ~ ..., weights = trials
successes/trials ~ ..., weights = NULL (or unspecified)
22.10.2025 14:42 — 👍 2 🔁 0 💬 1 📌 0

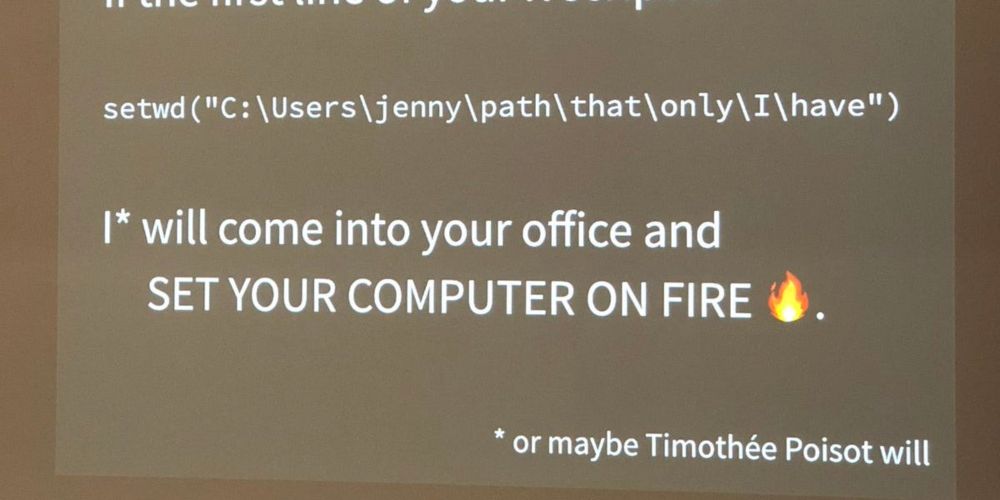
How I, a non-developer, read the tutorial you, a developer, wrote for me, a beginner - annie's blog
“Hello! I am a developer. Here is my relevant experience: I code in Hoobijag and sometimes jabbernocks and of course ABCDE++++ (but never ABCDE+/^+ are you kidding? ha!) and I like working with ...
"How I, a non-developer, read the tutorial you, a developer, wrote for me, a beginner" by Annie Mueller 😅 😂 😭
anniemueller.com/posts/how-i-...
23.09.2025 07:57 — 👍 326 🔁 95 💬 15 📌 31
So I should just ask students to explain each meme for their stats midterm right?
17.09.2025 15:05 — 👍 2 🔁 0 💬 1 📌 0

Join us Monday, September 15th from 4:00 pm to 5:00 pm ET for a talk by Simona Mancini, Ikerbasque Research Associate Professor / Neurolinguistics and Aphasia group leader at the Basque Center on Cognition Brain and Language.
Register now at https://bit.ly/45LjrF1
03.09.2025 15:15 — 👍 9 🔁 3 💬 0 📌 0
fantastic! Straight into the reading list for graduate stats. One thing that might be useful is a conceptual paragraph about how statistical power/sample size estimation changes. I can imagine (enthusiastic) students stuck on how to adjust what they know about study planning.
26.08.2025 14:07 — 👍 2 🔁 0 💬 0 📌 0

Models as Prediction Machines: How to Convert Confusing Coefficients into Clear Quantities
Abstract
Psychological researchers usually make sense of regression models by interpreting coefficient estimates directly. This works well enough for simple linear models, but is more challenging for more complex models with, for example, categorical variables, interactions, non-linearities, and hierarchical structures. Here, we introduce an alternative approach to making sense of statistical models. The central idea is to abstract away from the mechanics of estimation, and to treat models as “counterfactual prediction machines,” which are subsequently queried to estimate quantities and conduct tests that matter substantively. This workflow is model-agnostic; it can be applied in a consistent fashion to draw causal or descriptive inference from a wide range of models. We illustrate how to implement this workflow with the marginaleffects package, which supports over 100 different classes of models in R and Python, and present two worked examples. These examples show how the workflow can be applied across designs (e.g., observational study, randomized experiment) to answer different research questions (e.g., associations, causal effects, effect heterogeneity) while facing various challenges (e.g., controlling for confounders in a flexible manner, modelling ordinal outcomes, and interpreting non-linear models).

Figure illustrating model predictions. On the X-axis the predictor, annual gross income in Euro. On the Y-axis the outcome, predicted life satisfaction. A solid line marks the curve of predictions on which individual data points are marked as model-implied outcomes at incomes of interest. Comparing two such predictions gives us a comparison. We can also fit a tangent to the line of predictions, which illustrates the slope at any given point of the curve.

A figure illustrating various ways to include age as a predictor in a model. On the x-axis age (predictor), on the y-axis the outcome (model-implied importance of friends, including confidence intervals).
Illustrated are
1. age as a categorical predictor, resultings in the predictions bouncing around a lot with wide confidence intervals
2. age as a linear predictor, which forces a straight line through the data points that has a very tight confidence band and
3. age splines, which lies somewhere in between as it smoothly follows the data but has more uncertainty than the straight line.
Ever stared at a table of regression coefficients & wondered what you're doing with your life?
Very excited to share this gentle introduction to another way of making sense of statistical models (w @vincentab.bsky.social)
Preprint: doi.org/10.31234/osf...
Website: j-rohrer.github.io/marginal-psy...
25.08.2025 11:49 — 👍 1009 🔁 288 💬 47 📌 22
Consultant biostatistician @amsterdamumc, with PhD from @CWInl. Proponent of Registered Reports for RCT research. Research on ALL-IN prospective meta-analysis, anytime-valid statistics and https://en.wikipedia.org/wiki/E-values #stats #openscience
Scientist, mentor, activist, explorer.
Social and data science at the London School of Economic
Trying to come up with a good idea
Professor of Psychology | Adolescence and the transition to adulthood | Mental health, alcohol, social media, ADHD | Open science and quantitative psychology | She/her.
Epidemiologist and "causal influencer". Currently George Saden Visiting Faculty at @yalesph.bsky.social.
Check out my Intro to Causal Inference Course: https://www.causal.training/
#Epidemiology, #EpiSky, #CausalInference, #CausalSky, #AcademicSky
I am a psychologist working at the intersection of psychotherapy research and quantitative methods. Currently working on causal learning and attribution methods at @fupsych.bsky.social - views are my own.
More: https://linktr.ee/tkaiser_science
Consultant in Public Health at Bradford Institute for Health Research. Interested in quantitative research methods and mental health
NIH/NIA, Ex-PCORI, Health Policy (UMD), Stats (UW). AMSTAT 2027 HPSS Chair. Human to @parrishpets.bsky.social. My posts, not NIH's. BD Signer. RT Speaker. Reposts &❤️≠endorsements. Signal: tyk314.15.
Director of Training/Community at the Data Science Lab at Fred Hutch. Former OHSU, DNAnexus. Posit Data Science Mentor (when I have the time) #bioinformatics, #datascience, #teaching, and #ambientmusic. https://laderast.github.io
Biostatistician @IDEXX formerly at harvardmed, @BIDMChealth, @nasa. Big data, clinical trials, and medical diagnostics. Mainer. Opinions are my own. he/him
Bayesian Statistician, Software Architect, and Data Scientist in the Gaming/Entertainment Industry | Bayesian Statistics, Experimentation, Decision Theory, Guitar | Former Political Scientist
https://www.ajordannafa.com/
PoliSci PhD student @ Harvard / 🇬🇧🏳️🌈 / Creator of MyLittleCrony.com
Signal: @sehill.11
Assistant Professor at University of Michigan. Auditory scientist. Mother of three fur babies and one tiny human. www.soundbrainscience.com
https://sites.google.com/umich.edu/a2p
Hey nerds. It’s a quantitative methods podcast. With attitude. And merch (http://tinyurl.com/qpodmerch).
assoc prof, uc irvine cogsci & LPS: perception+metacognition+subjective experience, fMRI+models+AI
phil sci, education for all
2026: UCI-->UCL!
prez+co-founder, neuromatch.io
fellow, CIFAR brain mind consciousness
meganakpeters.org
she/her💖💜💙views mine
Meta-scientist and psychologist. Senior lecturer @unibe.ch. Chief recommender @error.reviews. "Jumped up punk who hasn't earned his stripes." All views a product of my learning history. If behaviorism did not exist, it would be necessary to invent it.
biostatistician @ University of Melbourne Statistical Consulting Centre. enjoyer of multiple imputation, RCTs, and DAGs. always graph your data. also runs, bikes, hikes, etc. he/him #BiInSci 🏳️🌈
https://cameronpatrick.com/
PhD & lic. psychologist. Research specialist at Karolinska Institutet @ki.se . R package for Rasch psychometrics: pgmj.github.io/easyRasch/
#openscience, #prevention, #psychometrics, #rstats, #photo
Quant Psyc professor at Arizona State. Into clustered data, latent variables, psychometrics, intensive longitudinal data, and growth modeling.
https://sites.google.com/site/danielmmcneish
I make Dad jokes on NPR and also write books and other things.