Many workers have missed shifts without jobs being destroyed making it challenging to measure labor impacts with conventional sources.
We use real-time daily data from Homebase to measure impacts. Thanks to UChicago and Homebase for making the data available.
#EconSky #NumbersDay
25.02.2026 15:38 — 👍 371 🔁 142 💬 4 📌 8

an unrellable number.
Finally, these maps also show an aspect of data analysis that introductions like this might be tempted to airily gloss over. Why is all the data for Connecticut missing? In the first edition of this book, we had to construct our maps in a slightly laborious fashion because the sf package was not yet fully up and running. Now we use an sf object whose geometries are from U.S. Census Bureau resources current at the time of writing (early 2026). But the data shown in Figure 7.14 is still from 2014. In between, Connecticut reorganized its administrative boundaries and replaced its older counties with new planning areas. These have new PIPS codes.
This means that earlier county-level data for Connecticut can't be directly joined to current U.S. county geometries. I could have silently corrected this by updating the gun-suicide data, or included a separate st object with 2014-era county geometry in the socviz package. But I have chosen to leave it as-is, because this sort of thing happens all the time. Units of observation (like states and counties) can change their meaning and extent over time, or be observed at inconsistent or incompatible scales and resolutions.
Identifying and harmonizing the right data for the units of interest can be a frustrating experience.
Revising the dataviz book is an opportunity to remind enthusiastic beginners of the bitter realities that lie ahead of them.
07.02.2026 15:29 — 👍 75 🔁 15 💬 1 📌 1

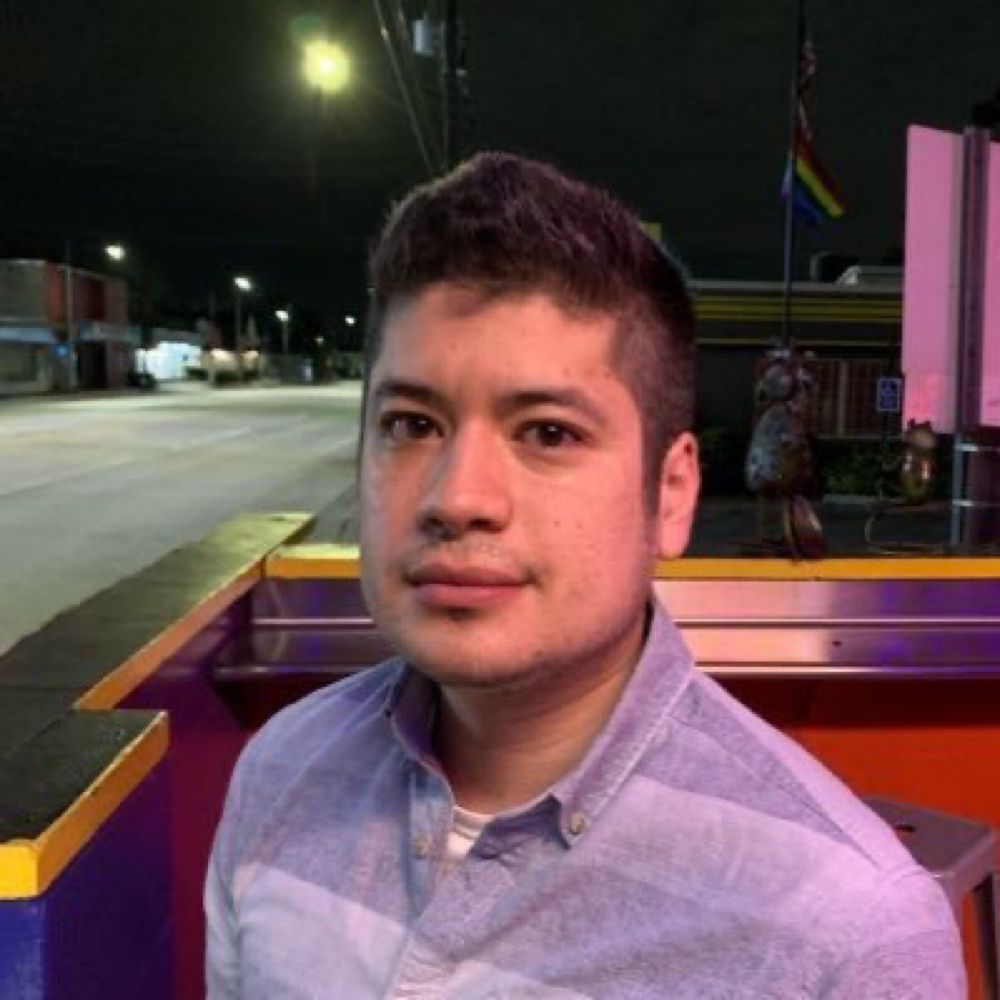
We're mourning yet again in Minnesota — and struggling to square the gut-churning video of Alex Pretti's final moments with official accounts.
I'm teaching techniques of neutralization this term, so I made this quick slide on the DHS statement. Share if it's useful. www.nytimes.com/live/2026/us...
25.01.2026 00:05 — 👍 185 🔁 87 💬 2 📌 2

Man, Du Bois had some bangers, but for me, it doesn't get much better than his scathing indictment of the "Christianity" of the United States.
Certainly this was all true of the nation in his lifetime. But in my lifetime, his criticisms have never felt so true of the nation right now.
17.01.2026 15:27 — 👍 194 🔁 87 💬 7 📌 10
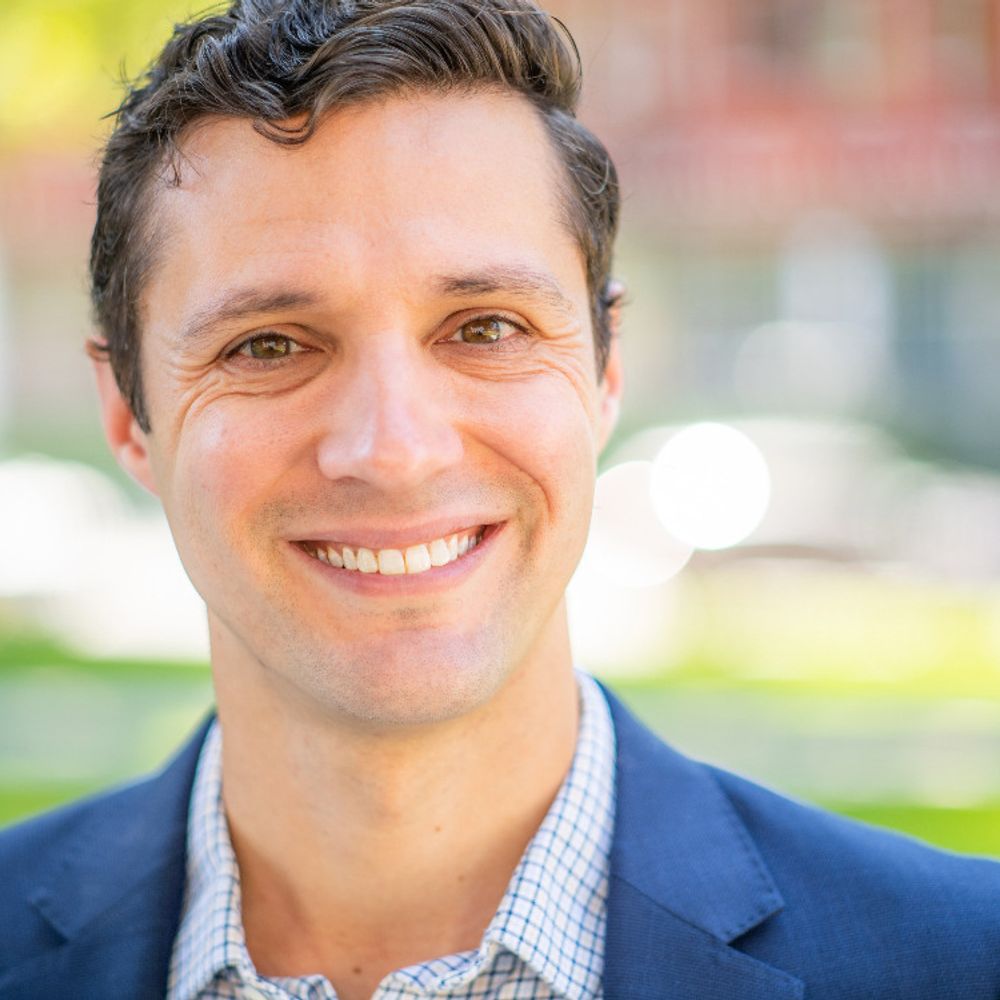
The need is no doubt greater than the increase in call volume, since the federal crackdown likely increased legal cynicism and system avoidance, both of which reduce the likelihood of calling authorities for help.
16.01.2026 23:01 — 👍 4 🔁 1 💬 0 📌 0

There are many signs of the fear and distress people are feeling in my home town of Minneapolis. One signal of elevated strain is the rise in 911 calls for help — up about 9% daily in the new year relative to previous daily averages across 2020-2024.
16.01.2026 23:01 — 👍 35 🔁 14 💬 4 📌 2
Unfortunately, all Census TIGER/Line and cartographic boundary shapefiles are down as of this evening.
This means that the tigris #rstats and pygris #Python packages will not work, and geometry support in tidycensus will also fail.
The Census API, for now, is still up.
04.02.2025 02:59 — 👍 80 🔁 46 💬 3 📌 23
Independent journalist.
Send tips via Signal: 202-510-1268.
Join my newsletter 👇👇👇
kenklippenstein.substack.com
Sociology professor, runner, husband, dad. Research on religion, morality, political culture, and social change. Teaching on sociological theory and more. Making Moral Citizens, my book on faith-based community organizing, available from UNC Press.
I watch stuff. I sometimes yammer about it. I also read stuff. And teach some things. I like women’s sports. And also all the hockey. Oh, and food. And Wynonna Earp.
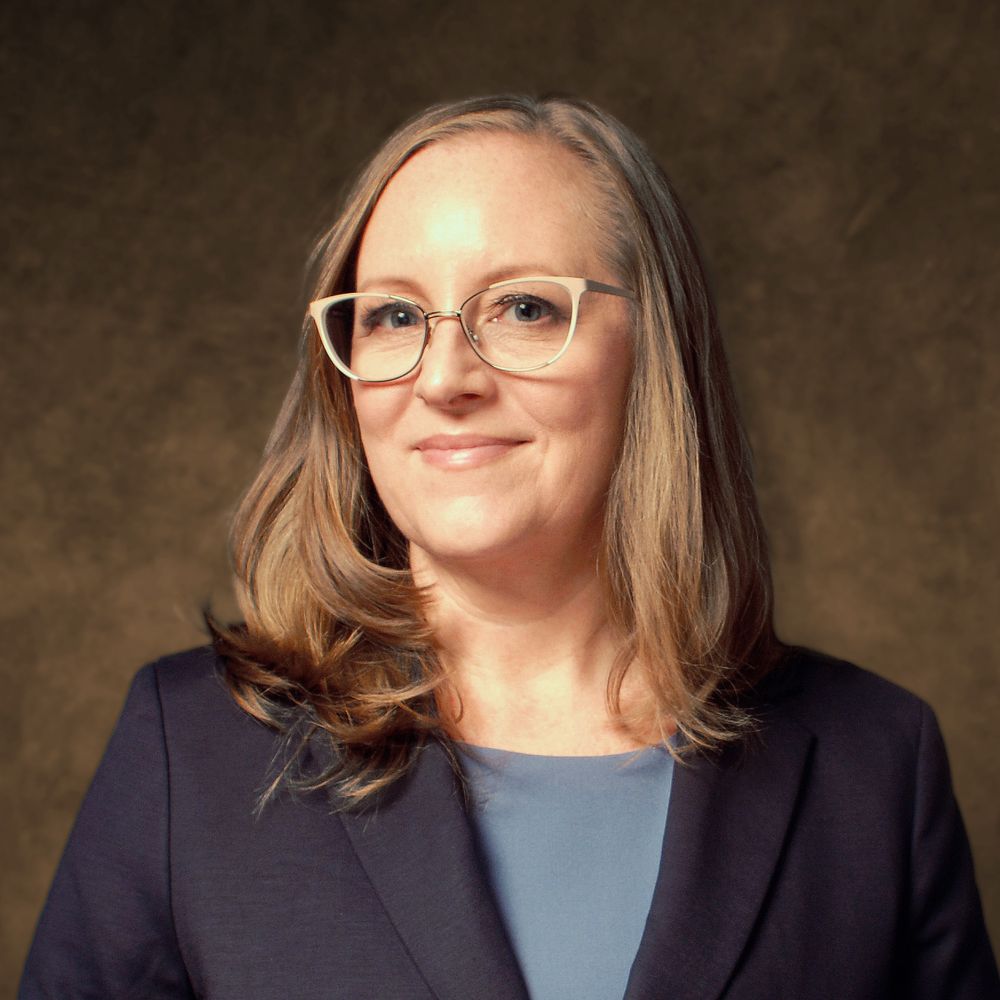
#firstgen #professor and #writer in #nola ❤️. Relentless advocate for #sociology. Author of non-fiction and textbooks with a new book -- Exposed: A College in Crisis Puts Science to the Test -- out in 2026. I adore what I do. And #cats!
lisa-wade.com
Dean of Social Science, NYU Abu Dhabi. Sociologist, researcher on gender, demography, sexualities, inequalities. Mindfulness meditator. Citizen of the US and the world.
Sociologist @Cornell. Currently interested in the history of inequality statistics, and the role of economic expertise in climate policy. “Venceréis, pero no convenceréis.”
Winship Distinguished Research Prof & Associate Prof of Sociology at Emory. Critical Racism Studies & Intersectionality. Black Feminist. Gender Expansive. Lefty. #Blackademic. ✊🏾🌈
linktr.ee/aasewell
Professor @Harvard
Monk Skin Tone Scale @Google
AOL Keyword: Carolina Sociology
[Coding Snippets](https://nealcaren.github.io/notes/)
[Website](http://nealcaren.org)
Sociologist studying how our social structures make sexual violence more likely to occur. Author of ON THE WRONG SIDE. Co-founder of Beyond Compliance Consulting. PhD UMich.
Assistant Professor, UCLA Sociology and California Center for Population Research
https://www.ianlundberg.org/
Crm at Maynooth University 🇮🇪 and Soc/Crm at Villanova University 🇺🇸. Fond of dogs, parrots, & David Bowie. Philly & Dublin.
Inspiring sociological imaginations everywhere! Member of The Society Pages. Posts & Editing by Evan Stewart (@evanstewart.bsky.social). Founded by Lisa Wade & Gwen Sharp.
https://thesocietypages.org/socimages/
Social science and other distractions. Old posts get deleted pretty quick.
https://kieranhealy.org /
https://theordinalsociety.com
Assistant Professor in Sociology at the University of Minnesota studying housing, climate, racism, and population health.
Fellow at @cplusc.bsky.social
https://ncgraetz.com/
Sociologist. Writing second book on crime victim policy in the U.S.; first book was an ethnography of urban development in Boston. Professor at Michigan.
https://sites.lsa.umich.edu/jeremylevine/
Social scientist at Stanford
Inequality, higher education, gender, work and organizations, open science, Alaska.
All posts are made in my personal, not professional, capacity. I do not speak for my employer.
Sociologist, criminologist, owl target.
Books:
https://www.ucpress.edu/books/intersecting-lives/paper
https://nyupress.org/9781479862726/beyond-recidivism/
https://www.rutgersuniversitypress.org/the-ex-prisoners-dilemma/9780813562278/
Sociologist, UIowa Associate Professor and author of On Critical Race Theory. Vice-President American Sociological Association. Former BIGS Racial Equity Fellow at Harvard Business School.