How over- and underrepresented are different causes of death in the media?
Another way to visualize this data is to measure how over- or underrepresented each cause is.
To do this, we calculate the ratio between a cause’s share of deaths and its share of news articles.
09.10.2025 17:07 — 👍 245 🔁 92 💬 7 📌 16
A fun chart game that primarily sources its data from Our World in Data!
15.09.2025 13:54 — 👍 49 🔁 17 💬 0 📌 2

Chartle - A daily chart game
Guess the country in red by analysing today's chart
Launch day 🚀
We’ve just released @chartlecc.bsky.social - a daily chart game!
Your job is to guess which country is represented by the red line in today's chart. You get 5 tries, no other clues!
Play today, come back tomorrow for a different chart with new data and share with your chart friends 📈
12.09.2025 13:41 — 👍 114 🔁 51 💬 13 📌 24

📚 The new school year is starting in many places. If you’re a teacher, student, or parent, here are a few ways Our World in Data might be useful to you right now 🧵
Our work is used in classrooms around the world — from top universities to local schools.
10.09.2025 13:36 — 👍 53 🔁 21 💬 1 📌 4
The international poverty line has changed, it’s now $3 a day.
Our new article explains what changed in the World Bank's latest update and what the new data tells us about global poverty
⤵️
ourworldindata.org/new-internat...
12.08.2025 08:04 — 👍 3 🔁 0 💬 0 📌 0

A chart comparing income inequality before and after taxes and government benefits for five countries: Japan, Canada, Germany, the US, and South Africa.
Inequality is measured here with the Gini coefficient, one of the most common ways to measure inequality. It summarizes the distribution of incomes within a country into a single number ranging from 0 to 1, where higher values indicate higher inequality.
The chart shows the Gini coefficients before and after taxes and benefits in five countries: Japan, Canada, Germany, the US, and South Africa, using the latest available data point for each.
Income inequality is lower after taxes and benefits. But by how much varies across countries. For example, Germany and the US have the same Gini before taxes and benefits, but after that redistribution, income inequality is lower in Germany than it is in the US.
The data source is the Luxembourg Income Study (2025) and the chart is Creative Commons BY license, published by Our World in Data.
When discussing data on income inequality, it's important to be clear about what’s being shown.
Two measures are often used: income *before* people have paid taxes and received benefits from the government, and income *after* government redistribution via taxes and benefits. 🧵
01.08.2025 16:14 — 👍 64 🔁 19 💬 2 📌 1
Check out these really exciting new features! 🌎
05.06.2025 16:56 — 👍 2 🔁 1 💬 0 📌 0
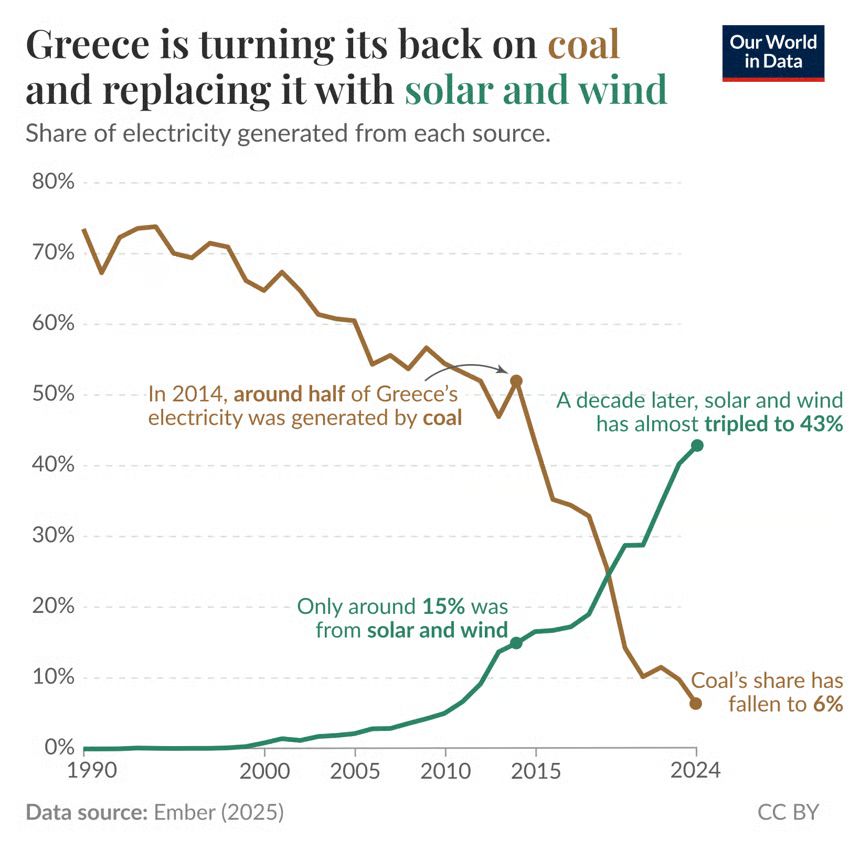
The image presents a line graph illustrating the shift in Greece's electricity generation sources over time, from 1990 to 2024. There are two main lines: one representing coal and another representing solar and wind energy.
Initially, the coal line begins around 60% in 1990, gradually declining to 50% in 2014. A sharp drop occurs after that, leading to a low of about 6% in 2024. In contrast, the solar and wind line starts very low, around 2% in 1990, and rises steeply after 2015, almost tripling to approximately 43% by 2024.
Key notes are emphasized in the graph: one states that in 2014, about half of Greece's electricity was generated by coal, while another indicates that only 15% came from solar and wind sources at that time.
Greece is turning its back on coal and replacing it with solar and wind.
Today's data insight: ourworldindata.org/data-insight...
Data from @ember-energy.org.
02.06.2025 06:01 — 👍 1579 🔁 338 💬 25 📌 21
Lots of discussion today about regional investment. You can use our @theifs.bsky.social public spending tool to explore how much the government currently spends in each region of the UK, what it spends it on, and how that has changed over time: ifs.org.uk/calculators/...
30.05.2025 13:41 — 👍 6 🔁 5 💬 0 📌 0

The image displays a horizontal bar chart comparing GDP per capita among various countries using two different measurements: international dollars and market dollars.
At the top, the United States is shown with a GDP per capita of $74,578 in both measurements (the US is the benchmark country). Below that, Spain follows with a GDP per capita of $32,950 in market dollars and $47,142 in international dollars. Brazil's GDP per capita is indicated as $8,388 in market dollars and $19,018 in international dollars. India's figures are $2,548 in market dollars and $9,160 in international dollars. Burkina Faso is shown with $894 in market dollars and $2,482 in international dollars.
Annotations indicate how many times poorer each country is compared to the US in both measurements.
The data source is the World Bank, and the notes mention that figures are expressed in constant 2021 prices. The chart was created by Our World in Data and is licensed under CC-BY.
How can we compare people’s incomes across countries?
27.05.2025 13:52 — 👍 53 🔁 11 💬 4 📌 3

What are international dollars?
International dollars are used to compare incomes and purchasing power across countries and over time. Here, we explain how they’re calculated and why they’re used.
International dollars show up a lot in global statistics. But they’re not an actual currency.
They are a way to adjust for differences in the cost of living, helping us compare incomes and how far money goes in different countries.
Read our new explainer ⤵️
ourworldindata.org/internationa...
26.05.2025 10:20 — 👍 4 🔁 1 💬 1 📌 0
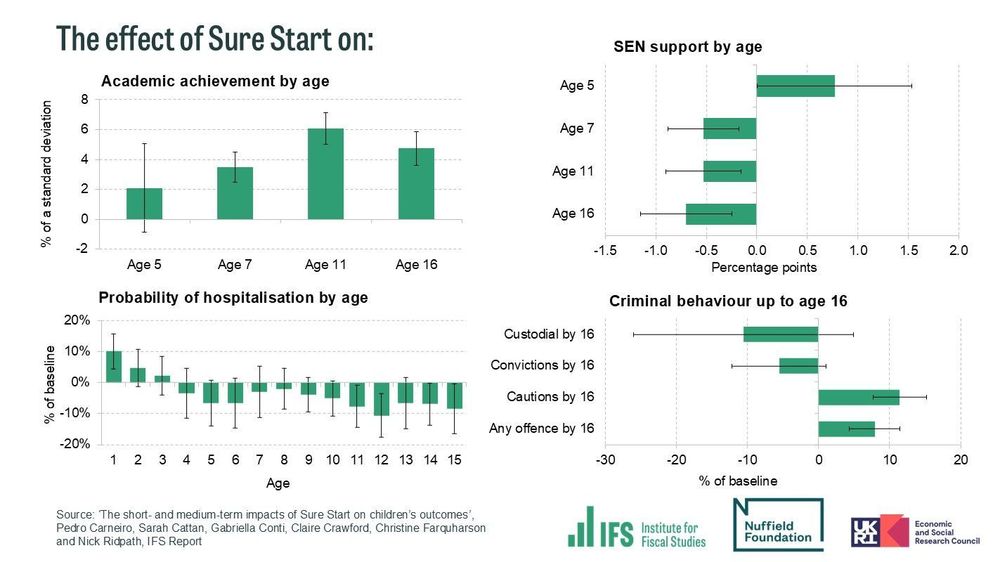
Chart shows the effects of Sure Start on academic achievements by age, SEN support by age, probability of hospitalisation by age and criminal behaviour up to age 16.
NEW: Sure Start generated widespread, long-lasting benefits for children in education, health, absences, and SEND.
Every £1 of up-front spending on Sure Start could generate around £2 in total benefits over the long run.
THREAD on our new @nuffieldfoundation.org-funded report:
[1/11]
22.05.2025 06:30 — 👍 204 🔁 122 💬 4 📌 33

Measles vaccines save millions of lives each year
Measles once killed millions every year. Vaccines changed this, preventing disease, long-term immune damage, and deadly outbreaks.
Measles once killed millions every year. Vaccines changed this, preventing disease, long-term immune damage and deadly outbreaks.
In this article @scientificdiscovery.dev & @spoonerf.bsky.social explain how vaccines were developed and their impact on saving lives. ourworldindata.org/measles-vacc...
19.05.2025 11:00 — 👍 74 🔁 30 💬 0 📌 0
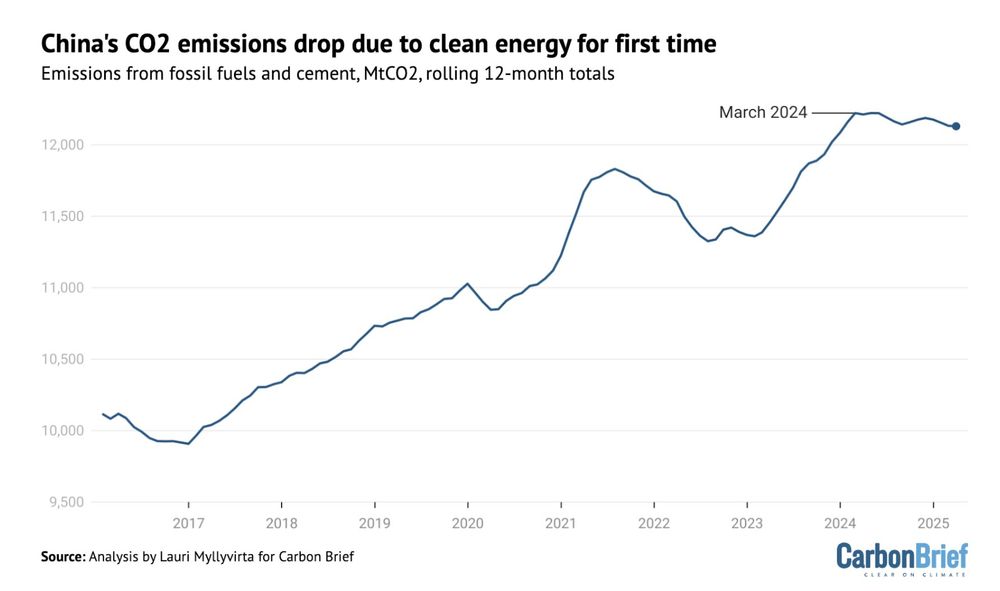
For the first time ever, China's CO₂ emissions are falling due to clean energy growth, rather than reduced power demand.
16.05.2025 07:57 — 👍 213 🔁 51 💬 2 📌 1
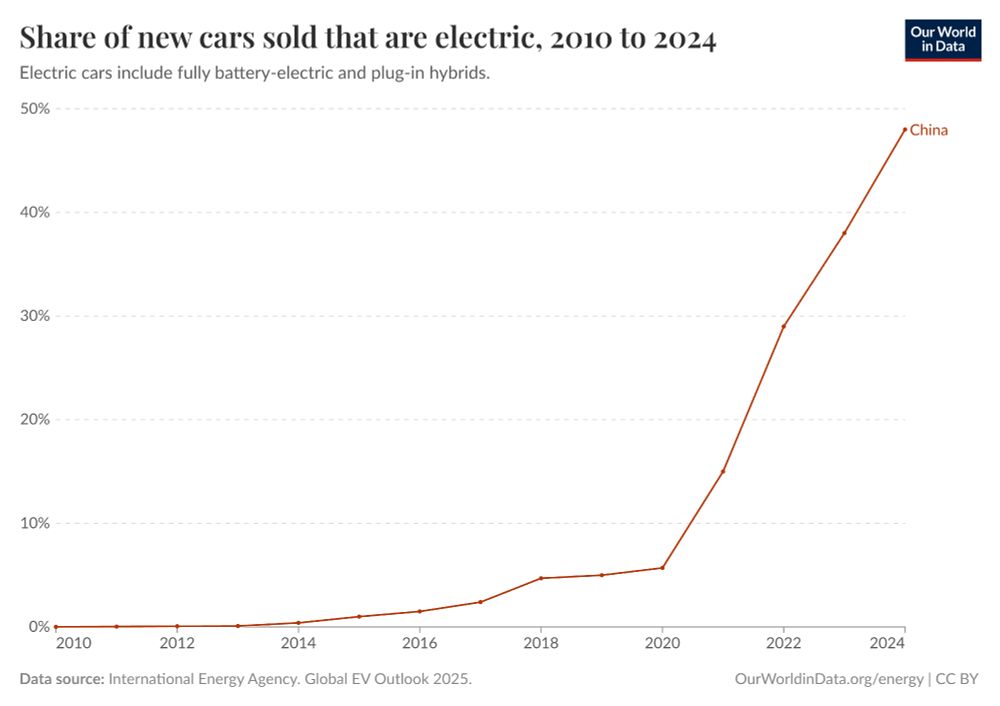
Almost half (48%) of new cars sold in China in 2024 were electric.
From the IEA's latest Global EV Outlook.
You can explore more data here:
ourworldindata.org/electric-car...
16.05.2025 05:07 — 👍 270 🔁 79 💬 9 📌 16
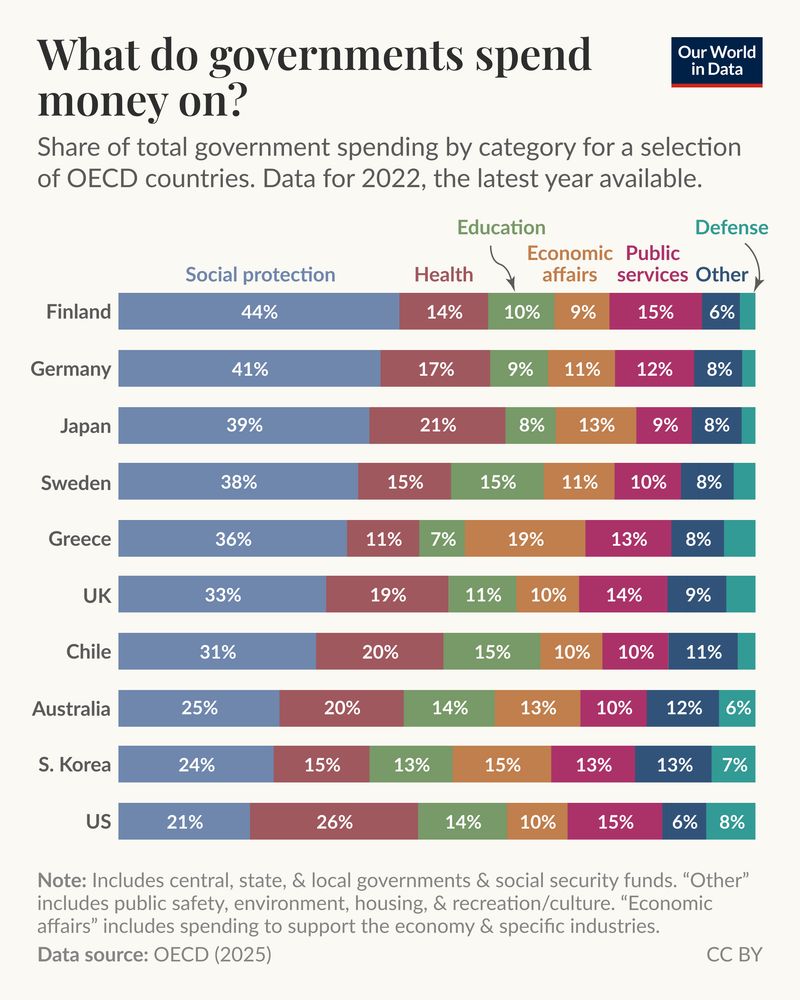
A stacked bar chart showing the share of total government spending by category for a selection of OECD countries. The data is from 2022, the latest year available.
The countries are Finland, Germany, Japan, Sweden, Greece, the UK, Chile, Australia, South Korea, and the US.
The categories are Social protection, Health, Education, Economic affairs, Public services, Other (which includes public safety, environment, housing, and recreation/culture), and Defense.
For some categories, such as public services, the share spent is fairly similar across countries: it ranges from a low of 9% in Japan to a high of 15% in the US and Finland.
In other categories, such as social protection, the difference across countries is much larger: from a low of 21% in the US to a high of 44% in Finland.
What do governments spend money on?
15.05.2025 16:51 — 👍 93 🔁 35 💬 5 📌 7

A chart illustrates the improvement of AI systems in performing longer software tasks over time. The horizontal axis spans from 2019 to mid 2025, marking the development of various AI models, such as GPT-2, GPT-3, GPT-3.5, and several iterations of GPT-4. The vertical axis indicates the length of time in minutes that tasks take human professionals. Key points highlighted include:
- "GPT 3.5 (which came out in Spring 2022) could only do tasks that take humans a few seconds, such as selecting the right file"
- "OpenAI's o3(which came out in April 2025) can do tasks on its own that take humans 20 minutes," such as finding and fixing small bugs in code
- The observed trend shows a rapid progression in AI capability
Accompanying notes indicate that the data is based on 170 tasks across fields like software engineering and machine learning. The source for this data is the Model Evaluation & Threat Research (METR) from 2025, presented under a Creative Commons attribution license.
The length of software tasks AI systems can do on their own has been increasing quickly
14.05.2025 16:05 — 👍 37 🔁 13 💬 1 📌 2
Check out the updated econ data from the IMF on @ourworldindata.org ⬇️
07.05.2025 17:27 — 👍 5 🔁 0 💬 1 📌 0

Bar chart comparing estimated death tolls for a range of flu pandemics.
How many people died in the Spanish flu pandemic of 1918–1920?
29.04.2025 14:52 — 👍 53 🔁 16 💬 1 📌 0

How a data journalist at The Economist, Sondre Solstad, uses Our World in Data
A story of how our work helps journalists who use data.
Did you know that many journalists around the world rely on our work for their stories?
Giving journalists and others what they need to do good work is a key part of our impact.
In a new article, we share how a data journalist at The Economist, @sondreus.bsky.social, uses Our World in Data:
28.04.2025 11:08 — 👍 85 🔁 11 💬 2 📌 0

Government Spending
What do governments spend their financial resources on?
We've updated our data on government spending 📊
You can explore how much countries spend relative to the size of their economies, how this has changed over time, and how spending is split across governments' priorities like health, education, and more:
➡️ ourworldindata.org/government-s...
24.04.2025 17:06 — 👍 4 🔁 2 💬 0 📌 0

A bar chart titled "Global deaths from famines, 1870-2023" that displays total deaths per decade from famines estimated to have killed 100,000 people or more.
Notable points include the "Great Leap Forward" in China, marked to show an estimated 36 million deaths from 1958 to 1962, and famines during World War II claiming approximately 25 million lives across the USSR, Europe, and Asia.
The late 19th and early 20th centuries show significant famines occurring in Russia, India, China, and other regions.
The text notes that the largest famines from the 1970s and 80s took place in Bangladesh, Cambodia, and Ethiopia.
The chart indicates that since 1990, major famines have occurred in the Central African Republic, the Democratic Republic of the Congo, Ethiopia, North Korea, Nigeria, Somalia, and Sudan.
The chart is from Our World in Data. The data source is the World Peace Foundation's Historic Famines Dataset.
How many people died in large famines over the past 150 years?
📊 We've updated the data in many of our charts on famine, including a big update from the World Peace Foundation (@worldpeacefdtn.bsky.social).
This update was led on our team by @bastianherre.bsky.social and Veronika Samborska.
17.04.2025 11:12 — 👍 60 🔁 21 💬 1 📌 4

What does global poverty look like if we rely on the notions of poverty in rich countries like Denmark, the US, or Germany?
And how should this perspective inform our aspirations for the future of global poverty?
17.04.2025 17:41 — 👍 44 🔁 13 💬 1 📌 2

A bar chart illustrating the number of people living in poverty in Latin America in 2023. The chart highlights that Brazil, Venezuela, and Mexico account for 59% of the population living on less than $3.65 per day, totaling 52.2 million individuals. Brazil is represented by the longest bar, showing 23.5 million people, followed by Venezuela with 15.5 million and Mexico with 13.2 million. Other countries displayed include Colombia (10.2 million), Guatemala (5.8 million), Peru (4.3 million), and several others, with the smallest bars indicating very few affected, such as Uruguay (0.1 million) and Costa Rica (0.3 million). The chart provides a clear visual representation of poverty levels across the region.
Data source: Chang, Evans and Rivas Herrera (2024), Inter-American Development Bank. Note: Data in international dollars at 2017 prices, adjusted for inflation and differences in living costs between countries. The graph is licensed under CC BY.
Brazil, Venezuela, and Mexico account for 59% of people living in poverty in Latin America
18.04.2025 11:01 — 👍 42 🔁 6 💬 6 📌 2

One of my favourite OWID charts has been updated! 🌸
Japan’s cherry trees have been blossoming earlier due to warmer temperatures
by @spoonerf.bsky.social
10.04.2025 15:56 — 👍 4 🔁 0 💬 2 📌 0
Educators at many levels, from middle school to postgraduate, find our work helpful for their teaching.
Check out our recently updated "Teaching with OWID" page for materials, FAQs, tips, and more: ourworldindata.org/teaching
And if you have any feedback or suggestions, we love to hear it!
28.03.2025 13:47 — 👍 37 🔁 10 💬 3 📌 0
😀 Take a break from doomscrolling!
We share tech, science, health, environment, and social progress
What Could Go Right? newsletter and podcast 👇
linktr.ee/progressntwrk
I write words good (journalist, author, radio person, etc) marie.s.leconte@gmail.com
Research economist at the Rockwool Foundation (@rockwoolfonden.dk).
Education, labor and applied econ.
CESifo, IZA.
Website: https://sites.google.com/view/mikkelgandil
Coach/Developmental Editor for academics in the social sciences, including dissertators. Sometimes methods prof; author of _Empirical Research & Writing: A Pol Sci Student's Practical Guide_. Accepting manuscripts for fall & coaching clients year round.
economics and computer science professor at Northwestern
bengolub.net
social and economic networks
originally from Ukraine
▪︎ Reading, writing & thinking about the moral foundation of scholarship
▪︎ Author of Doing Good Social Science: http://bit.ly/3EgFA2z
▪︎ More about my work: immersiveresearch.co.uk
▪︎ DM for speaking/workshop requests
PhD in Economics | Development Economist | she, her
www.cristinaclerici.com
From August, Provost, The Queen’s College, Oxford. Previously director, Institute for Fiscal Studies. Author “Follow the Money”
Chief Executive, Resolution Foundation
Professor of Economics and Public Policy, King's College London; Senior Fellow, UK in a Changing Europe. Immigration, economics, public policy. Personal views only; usual disclaimers apply.
Books: Immigration (Sage), Capitalism (Quercus)
Host of the Political Philosophy Podcast & occasional writer. US & UK politics, philosophy, religion, & the odd food pics.
Prof of Science & Tech Policy @uniofmanchester.bsky.social @mioir.bsky.social. Views own, RTs not. 🐝🇬🇧🇮🇪🇪🇺
International Relations and History 📚 • Founder of The World in Maps • Here, I post maps and graphs about how the world works and how it once was 🌍📊
President CGD. Development economist. Passionate about impact, evidence and innovation.🔸10% pledge. Posts=personal views.
cgdev.org
The Centre for British Progress is a non-partisan think tank on a mission to accelerate and shape an era of British growth and progress; evolved from @ukdayone.bsky.social.
Website: https://britishprogress.org/
Assistant Prof in Economics (Copenhagen Business School ECON)
Working on migrants' integration (citizenship) & racial inequality
French, Mauritian
Fellow WIL & ICM
Research: Inequality & Migration |
PhD: PSE & INED
Associate Professor, Sciences Po & Co-Director, World Inequality Lab, Paris School of Economics || Global inequality · Climate Change · Politics of Taxation and Redistribution || www.lucaschancel.com


