(Kangaroos on campus is normal but not quite like this)
31.10.2025 06:20 — 👍 0 🔁 0 💬 0 📌 0

A path with bushes on either side. A kangaroo is barely visible amongst the bushes.
🦘 certainly well camouflaged
31.10.2025 03:51 — 👍 1 🔁 0 💬 1 📌 0
Yeah I think if you had an institutional account and ran your whole class through it that'd be quite effective. I think I'd have some trouble getting IT approval, and most students manage to install Rstudio on their own computers so it'd be a lot of logistics just for the edge cases.
30.09.2025 02:42 — 👍 1 🔁 0 💬 0 📌 0
We send the cursed ones to use posit.cloud free accounts but I wish there was a nicer solution
30.09.2025 02:14 — 👍 3 🔁 0 💬 1 📌 0

Kanji Explorer available at https://jcarroll.shinyapps.io/kanjiexplorer/
I Vibe Coded an R Package
and it ... actually works?!?
https://jcarroll.com.au/2025/09/13/i-vibe-coded-an-r-package/
I wanted an #rstats package to exist so I spent $20 and got Claude Code to build it for me.
Plus a shiny app using it: https://jcarroll.shinyapps.io/kanjiexplorer/
13.09.2025 01:41 — 👍 27 🔁 11 💬 1 📌 0
my lil reproducibility talk from today / I really wanted to instill the PhD students some simple first practices and ways to step up your game from there github.com/tjmahr/2025-...
20.08.2025 23:52 — 👍 50 🔁 12 💬 3 📌 3
Happy to discover that R.A. Fisher already relied on what one may refer to as "resolution by cope"
24.06.2025 09:59 — 👍 62 🔁 7 💬 3 📌 2
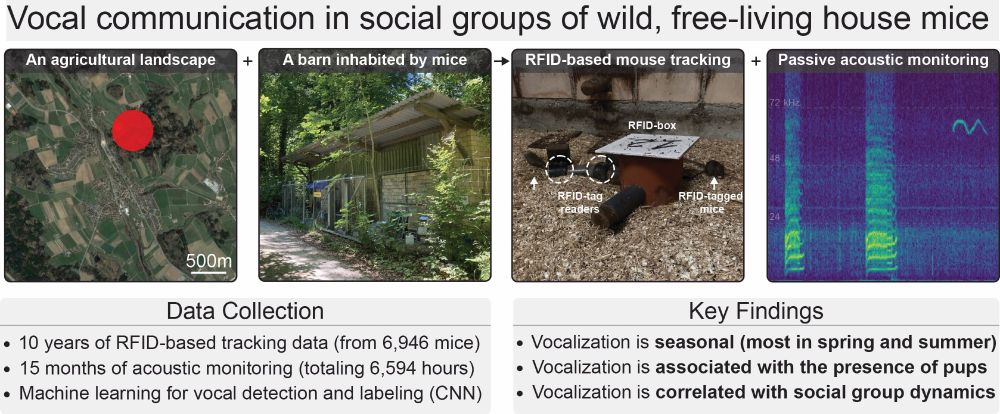
Graphical abstract for "Vocal communication is seasonal in social groups of wild, free-living house mice."
The abstract has, from top to bottom, a title, four middle image panels, and two bottom text panels.
Image title: "Vocal communication in social groups of wild-free living house mice"
Middle image panels from left to right: (1) An aerial snap shot of the region where the study site is located, an agricultural landscape in rural Switzerland. (2) An image of the study site, a small barn in the forest inhabited by mice. (3) An image of a radio frequency identification (RFID) box used to track mouse social interactions. A mouse is entering the box from the left while another sits outside. (4) A spectrogram showing example vocalizations - one low frequency squeak and one ultrasonic call - recorded from an RFID box.
Bottom panels:
Left: Data Collection
- 10 years of RFID-based tracking data (from 6,946 mice)
- 15 months of acoustic monitoring (totaling 6,594 hours)
- Machine learning for vocal detection and labeling (CNN)
Right: Key Findings
- Vocalization is seasonal (most in spring and summer)
- Vocalization is associated with the presence of pups
- Vocalization is correlated with social group dynamics
Very happy to share the latest from my postdoc!
10 yrs of mouse social networks + 1.25 yrs of acoustic data ➡️ insight into vocalization & sociality in a wild population of your favorite lab model 🐁
paper: bit.ly/4n93yyD
data: bit.ly/4lfFBEk
code: bit.ly/4kNnMwx
#bioacoustics #neuroskyence
1/8
18.06.2025 18:25 — 👍 135 🔁 47 💬 4 📌 8
Little Ume, our endangered tapir calf, has loved meeting so many of you over the past two weekends! 🩷 This growing baby needs lots of rest, so she’s been catching plenty of zzz’s behind the scenes and in her habitat. 😴
28.05.2025 03:45 — 👍 5874 🔁 772 💬 90 📌 89

Please share. 2 tenure-track T&R math/stat jobs at the University of Queensland, Australia. Amazing weather, gorgeous campus & lifestyle. 17% employer retirement contribution, lots of leave. Strong global reputation. Supports diversity @stevenstrogatz.com uq.wd3.myworkdayjobs.com/en-US/uqcare...
16.05.2025 01:26 — 👍 37 🔁 33 💬 1 📌 0
Sorry, Modsim!
16.05.2025 01:19 — 👍 1 🔁 0 💬 0 📌 0
Should I go to the Australian Statistical Conference or Modism?!? They both look cool but are in direct competition...
16.05.2025 01:03 — 👍 1 🔁 0 💬 1 📌 0
YouTube video by JuliaHub
Converting R data-wrangling code to julia
🔥🔥🔥
Check out this Tidier.jl (and general #julialang data) tutorial from @kevinbonham.com @juliahub.bsky.social!
#rstats #tidyverse
youtu.be/bw-N1lrDeHI?...
07.05.2025 20:13 — 👍 14 🔁 5 💬 1 📌 1
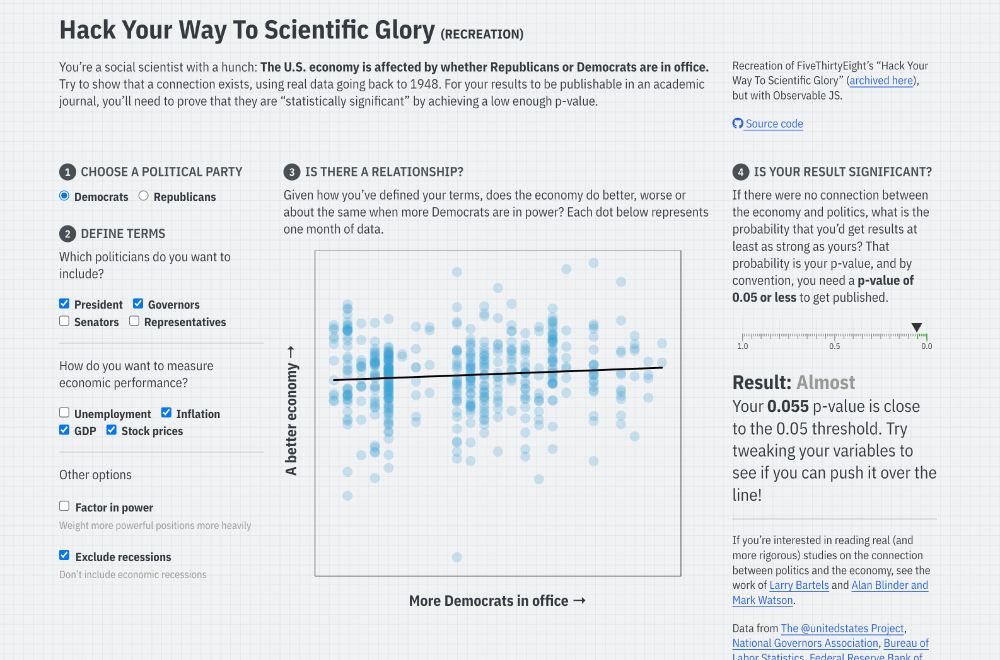
Screenshot of the linked Quarto website, with input checkboxes to change different conditions for a regression model that predicts economic performance based on US political party, with a reported p-value
I’ve long used FiveThirtyEight’s interactive “Hack Your Way To Scientific Glory” to illustrate the idea of p-hacking when I teach statistics. But ABC/Disney killed the site earlier this month :(
So I made my own with #rstats and Observable and #QuartoPub ! stats.andrewheiss.com/hack-your-way/
20.03.2025 18:30 — 👍 1468 🔁 439 💬 58 📌 30

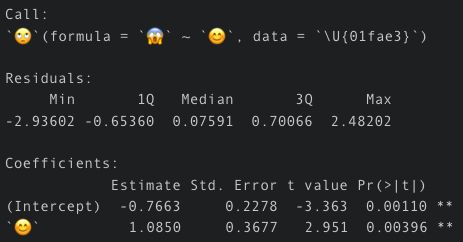
I'm just saying this is syntatically correct #rstats code
16.01.2025 16:38 — 👍 119 🔁 21 💬 16 📌 10
The latest version of the {mapgl} #rstats package is now released, supporting scrollytelling-style story maps!
Build richly interactive map stories from your R data pipelines using @Mapbox or @maplibre as your backend.
Learn how in the new vignette: walker-data.com/mapg...
14.01.2025 14:46 — 👍 39 🔁 7 💬 3 📌 2

ANU-AAGI team featuring investigators: Eric Stone, Emi Tanaka, Alan Welsh and Francis Hui
Want to use your #statistics, ML/AI or #bioinformatics skills to solve problems in #agriculture?
We are seeking 3 postdocs (up to 3 years) to join at ANU Biological Data Science Institute as part of Analytics for 🇦🇺 Grains industry by 📅 19 Jan
We now also have a (WIP) website!
🌐 anu-aagi.github.io
02.01.2025 03:37 — 👍 17 🔁 18 💬 1 📌 0
YouTube video by TheCoatlessProfessor
Run R Calculations on Remote Clusters with {future}
Scale R analyses across cluster systems without leaving RStudio! {future} makes it simple to login, schedule & parallelize your code.
🎥 Watch: www.youtube.com/watch?v=G8MC...
💻 Code: github.com/coatless-vid...
#rstats #HPC #datascience
06.12.2024 23:30 — 👍 21 🔁 7 💬 1 📌 1

Image shows sample palettes for UChicago, Star Trek and Tron Legacy
The {ggsci} #RStats 📦 “offers a collection of ggplot2 color palettes inspired by scientific journals, data visualization libraries, science fiction movies, and TV shows.” By Nan Xiao.
Use with:
scale_color_palname()
scale_fill_palname()
nanx.me/ggsci/
#RStats #ggplot2 #ggplot
29.11.2024 13:50 — 👍 29 🔁 8 💬 2 📌 0
Getting started with elmer
If you're interested in trying out LLMs in #rstats but don't know where to begin, I've added a few two vignettes to elmer: elmer.tidyverse.org/articles/elm... and elmer.tidyverse.org/articles/pro...
29.11.2024 15:45 — 👍 265 🔁 64 💬 10 📌 1
The {qpdf} #RStats 📦can transform PDF files with functions like pdf_split(), pdf_combine(), and pdf_rotate_pages().
cran.r-project.org/web/packages...
The {pdftools} #R 📦can read content & metadata in PDFs. docs.ropensci.org/pdftools/
Both by @jeroenooms.bsky.social
29.11.2024 19:50 — 👍 41 🔁 14 💬 2 📌 0
![You can actually change R’s localization settings to get output in different languages!
If you want to see what your computer is currently set to use, run Sys.getLocale():
> Sys.getlocale()
## [1] "en_US.UTF-8/en_US.UTF-8/en_US.UTF-8/C/en_US.UTF-8/en_US.UTF-8"
There’s a bunch of output there—the first part (en_US.UTF-8) is the most important and tells you the language code. The code here follows a pattern and has three parts:
- A language: en. This is the langauge, and typically uses a two-character abbreviation following the ISO 639 standard
- A territory: US. This is the country or region for that language, used mainly to specify the currency. If it’s set to en_US, it’ll use US conventions (like “$” and “color”); if it’s set to en_GB it’ll use British conventions (like “£” and “colour”). It uses a two-character abbreviation following the ISO 3166 standard.
- An encoding: UTF-8. This is how the text is actually represented and stored on the computer. This defaults to Unicode (UTF-8) here. You don’t generally need to worry about this.](https://cdn.bsky.app/img/feed_thumbnail/plain/did:plc:2zcfjzyocp6kapg6jc4eacok/bafkreihm4fjqhut2lpx7hpk6u7xdyei7ht3jrcwmkv6llu62tvm3pdqicm@jpeg)
You can actually change R’s localization settings to get output in different languages!
If you want to see what your computer is currently set to use, run Sys.getLocale():
> Sys.getlocale()
## [1] "en_US.UTF-8/en_US.UTF-8/en_US.UTF-8/C/en_US.UTF-8/en_US.UTF-8"
There’s a bunch of output there—the first part (en_US.UTF-8) is the most important and tells you the language code. The code here follows a pattern and has three parts:
- A language: en. This is the langauge, and typically uses a two-character abbreviation following the ISO 639 standard
- A territory: US. This is the country or region for that language, used mainly to specify the currency. If it’s set to en_US, it’ll use US conventions (like “$” and “color”); if it’s set to en_GB it’ll use British conventions (like “£” and “colour”). It uses a two-character abbreviation following the ISO 3166 standard.
- An encoding: UTF-8. This is how the text is actually represented and stored on the computer. This defaults to Unicode (UTF-8) here. You don’t generally need to worry about this.
![For macOS and Linux (i.e. Posit Cloud), setting locale details is pretty straightforward and predictable because they both follow this pattern consistently:
- en_GB: British English
- fr_FR: French in France
- fr_CH: French in Switzerland
- de_CH: German in Switzerland
- de_DE: German in Germany
If you run locale -a in your terminal (not in your R console) on macOS or in Posit Cloud, you’ll get a list of all the different locales your computer can use. Here’s what I have on my computer:
[1] "af_ZA" "am_ET" "be_BY" "bg_BG" "C" "ca_ES" "cs_CZ" "da_DK" "de_AT" "de_CH" "de_DE" "el_GR" "en_AU" "en_CA"
[15] "en_GB" "en_IE" "en_NZ" "en_US" "es_ES" "et_EE" "eu_ES" "fi_FI" "fr_BE" "fr_CA" "fr_CH" "fr_FR" "he_IL" "hi_IN"
[29] "hr_HR" "hu_HU" "hy_AM" "is_IS" "it_CH" "it_IT" "ja_JP" "kk_KZ" "ko_KR" "lt_LT" "nl_BE" "nl_NL" "no_NO" "pl_PL"
[43] "POSIX" "pt_BR" "pt_PT" "ro_RO" "ru_RU" "sk_SK" "sl_SI" "sr_YU" "sv_SE" "tr_TR" "uk_UA" "zh_CN" "zh_HK" "zh_TW"
For whatever reason, Windows doesn’t use this naming convention. It uses dashes or full words instead, like en-US or american or en-CA or canadian. You can see a list here, or google Windows language country strings (that’s actually RStudio’s official recommendation for finding Windows language codes)](https://cdn.bsky.app/img/feed_thumbnail/plain/did:plc:2zcfjzyocp6kapg6jc4eacok/bafkreifix7jpdvgndwegw2wffcortpw6yjsw5k6v6xkli7ufz7e3lfzxta@jpeg)
For macOS and Linux (i.e. Posit Cloud), setting locale details is pretty straightforward and predictable because they both follow this pattern consistently:
- en_GB: British English
- fr_FR: French in France
- fr_CH: French in Switzerland
- de_CH: German in Switzerland
- de_DE: German in Germany
If you run locale -a in your terminal (not in your R console) on macOS or in Posit Cloud, you’ll get a list of all the different locales your computer can use. Here’s what I have on my computer:
[1] "af_ZA" "am_ET" "be_BY" "bg_BG" "C" "ca_ES" "cs_CZ" "da_DK" "de_AT" "de_CH" "de_DE" "el_GR" "en_AU" "en_CA"
[15] "en_GB" "en_IE" "en_NZ" "en_US" "es_ES" "et_EE" "eu_ES" "fi_FI" "fr_BE" "fr_CA" "fr_CH" "fr_FR" "he_IL" "hi_IN"
[29] "hr_HR" "hu_HU" "hy_AM" "is_IS" "it_CH" "it_IT" "ja_JP" "kk_KZ" "ko_KR" "lt_LT" "nl_BE" "nl_NL" "no_NO" "pl_PL"
[43] "POSIX" "pt_BR" "pt_PT" "ro_RO" "ru_RU" "sk_SK" "sl_SI" "sr_YU" "sv_SE" "tr_TR" "uk_UA" "zh_CN" "zh_HK" "zh_TW"
For whatever reason, Windows doesn’t use this naming convention. It uses dashes or full words instead, like en-US or american or en-CA or canadian. You can see a list here, or google Windows language country strings (that’s actually RStudio’s official recommendation for finding Windows language codes)
![Those functions have a locale argument, though, so it’s really easy to switch between languages:
> wday(x, label = TRUE, abbr = FALSE, locale = "en_US")
## [1] Friday
## Levels: Sunday < Monday < Tuesday < Wednesday < Thursday < Friday < Saturday
> wday(x, label = TRUE, abbr = FALSE, locale = "fr_FR")
## [1] Vendredi
## Levels: Dimanche < Lundi < Mardi < Mercredi < Jeudi < Vendredi < Samedi
> wday(x, label = TRUE, abbr = FALSE, locale = "fr_BE")
## [1] Vendredi
## Levels: Dimanche < Lundi < Mardi < Mercredi < Jeudi < Vendredi < Samedi
> wday(x, label = TRUE, abbr = FALSE, locale = "it_IT")
## [1] Venerdì
## Levels: Domenica < Lunedì < Martedì < Mercoledì < Giovedì < Venerdì < Sabato
> wday(x, label = TRUE, abbr = FALSE, locale = "zh_CN")
## [1] 星期五
## Levels: 星期日 < 星期一 < 星期二 < 星期三 < 星期四 < 星期五 < 星期六](https://cdn.bsky.app/img/feed_thumbnail/plain/did:plc:2zcfjzyocp6kapg6jc4eacok/bafkreigwhd7lx2vcb2neeuasd54vtaiiqehmw4ooddb3a25y4wyjcx23ru@jpeg)
Those functions have a locale argument, though, so it’s really easy to switch between languages:
> wday(x, label = TRUE, abbr = FALSE, locale = "en_US")
## [1] Friday
## Levels: Sunday < Monday < Tuesday < Wednesday < Thursday < Friday < Saturday
> wday(x, label = TRUE, abbr = FALSE, locale = "fr_FR")
## [1] Vendredi
## Levels: Dimanche < Lundi < Mardi < Mercredi < Jeudi < Vendredi < Samedi
> wday(x, label = TRUE, abbr = FALSE, locale = "fr_BE")
## [1] Vendredi
## Levels: Dimanche < Lundi < Mardi < Mercredi < Jeudi < Vendredi < Samedi
> wday(x, label = TRUE, abbr = FALSE, locale = "it_IT")
## [1] Venerdì
## Levels: Domenica < Lunedì < Martedì < Mercoledì < Giovedì < Venerdì < Sabato
> wday(x, label = TRUE, abbr = FALSE, locale = "zh_CN")
## [1] 星期五
## Levels: 星期日 < 星期一 < 星期二 < 星期三 < 星期四 < 星期五 < 星期六
![You can also set the locale for your entire R session like this:
> Sys.setlocale(locale = "de_DE")
## [1] "de_DE/de_DE/de_DE/C/de_DE/en_US.UTF-8"
Now month() and wday() will use German by default without needing to set the locale argument:
> month(x, label = TRUE, abbr = FALSE)
## [1] Juli
## 12 Levels: Januar < Februar < März < April < Mai < Juni < Juli < August < September < Oktober < ... < Dezember
> wday(x, label = TRUE, abbr = FALSE)
## [1] Freitag
## Levels: Sonntag < Montag < Dienstag < Mittwoch < Donnerstag < Freitag < Samstag](https://cdn.bsky.app/img/feed_thumbnail/plain/did:plc:2zcfjzyocp6kapg6jc4eacok/bafkreiafavwrb3btz77zlw6ok3qnkft5giukstdwxor2zk4mi3yncy6z6i@jpeg)
You can also set the locale for your entire R session like this:
> Sys.setlocale(locale = "de_DE")
## [1] "de_DE/de_DE/de_DE/C/de_DE/en_US.UTF-8"
Now month() and wday() will use German by default without needing to set the locale argument:
> month(x, label = TRUE, abbr = FALSE)
## [1] Juli
## 12 Levels: Januar < Februar < März < April < Mai < Juni < Juli < August < September < Oktober < ... < Dezember
> wday(x, label = TRUE, abbr = FALSE)
## [1] Freitag
## Levels: Sonntag < Montag < Dienstag < Mittwoch < Donnerstag < Freitag < Samstag
Lots of the students in my dataviz class speak other languages, so I wrote up a little guide about how to change the locale in #rstats to get localized month/day names with {lubridate} and other R functions
datavizf24.classes.andrewheiss.com/news/2024-11...
26.11.2024 14:42 — 👍 89 🔁 18 💬 4 📌 1
I teach people to use R @rfortherestofus.com
Assistant Professor, Department of Pediatrics NCH/OSU | #episky #statsky | @OSUpublichealth and @nationwidekids: Ohio Perinatal Research Network, Center for Perinatal Research | 3 kids | she/her
Social science and other distractions. Old posts get deleted pretty quick.
https://kieranhealy.org /
https://theordinalsociety.com
Professor at the Australian National University. Biosecurity, fungal and plant genomics, evolution, and biochemistry. Dad. Swimming, reading, nature.
❤️📊 | 🗣️DE|EN|FR | #rstats | #econsky
Demographics | Geospatial | Data Science | Open Source
ASA Fellow; #rstats developer of graphical methods for categorical and multivariate data; #datavis history of data visualization; #historicaldatavis; Milestones project
Web: www.datavis.ca
GitHub: github.com/friendly
Hiding on social media from unpleasant people. Prof of statistics at NTNU in Norway
ORCID: 0000-0001-9737-3724
Data science, statistics, gardening, the wnba, & dogs
📖 Co-author of Bayes Rules! bayesrulesbook.com with Alicia Johnson and Mine Dogucu
📝 https://medium.com/@miles_ott
💼 https://www.linkedin.com/in/miles-ott
🐘 https://aus.social/@Miles_Ott
Statistics lecturer | Freelance statistical consultant & research analyst | #rstats dev @easystats.github.io
home.msbstats.info
(He/Him)
Assoc Prof Computer Science and Communication Studies at Northwestern. Infovis, HCI. Author of tidybayes & ggdist R pkgs. he/him. 🏳️🌈 https://mjskay.com/
Co-director https://mucollective.northwestern.edu
Co-founder https://journalovi.org
Australian ecologist into wildfire, wildlife, and the wonders of nature
Just an ole t-test in a GLMM world. #statistics #healthcare #rstats
Research Specialist at Princeton University's Eviction Lab
R programmer & housing analyst
#rstats user and developer. umairdurrani.com
she/her
professor at duke university + developer educator at posit
cat videos = instant smiles
https://mine-cr.com
https://fosstodon.org/@minecr
Data Scientist and Educator with a PhD in Statistics. I like exploring messy data and explaining things.
Blog | www.rebeccabarter.com
Co-author of Veridical Data Science | www.vdsbook.com
Author of The R Workshop | www.r-workshop.org
Rotating Curator for the @rladies.org community💜
🔗 https://guide.rladies.org/rocur/
This week's curator: TBA
#rstats primarily but learning #haskell, #julia, #rust, #python, #APL, #lisp, and many others
:rstats: :haskell: :julia: :rust: :apl: :python: :bash:
Also […]
🌉 bridged from ⁂ https://fosstodon.org/@jonocarroll, follow @ap.brid.gy to interact