Our published version only deals with single colour data, but we are developing multi-colour analysis. Tests so far indicate an advantage to using one colour to obtain the pose and then limiting to finer alignments. Would be very happy to discuss your data! Always looking for new test cases.
20.08.2025 17:08 — 👍 1 🔁 0 💬 1 📌 0

A picture of a three legged chicken with the number of legs returned by different vision language models (2 or 4)
Some fowl play here: vision language models are biased against 3-legged chickens, say they have 2 or 4 legs
vlmsarebiased.github.io
19.08.2025 07:26 — 👍 3 🔁 1 💬 1 📌 0
Many thanks to my fantastic collaborators including @deathandthepenguin.bsky.social,
@mmlab.bsky.social, @christlet.bsky.social, @georgelittlejohn.bsky.social, @katherine-baxter.bsky.social, @gailmcconnell.bsky.social, @superresolusian.bsky.social (5/5)
12.08.2025 16:18 — 👍 4 🔁 0 💬 0 📌 0
GitHub - edrosten/SQUASSH
Contribute to edrosten/SQUASSH development by creating an account on GitHub.
If you’d like to try SQUASSH our code is on github and includes a colab notebook.
github.com/edrosten/SQU...
colab.research.google.com/github/edros...
If your analysis requires a custom heterogeneity and you’d like some help, get in touch! (4/5)
12.08.2025 16:18 — 👍 4 🔁 1 💬 2 📌 0

Top row shows spectrin rings in axons, middle row shows cell division, and bottom row shows plant trichomes.
…and visualise structures and heterogeneity from the 8 nm alpha-tubulin repeat up to the mm scale.(3/5)
12.08.2025 16:18 — 👍 3 🔁 0 💬 1 📌 0

Top row of image show nuclear pore structures derived from RESI data on the left and from 4Pi STORM and the right. Bottom graph shows that the RESI results show a correlation between the two rings of the nuclear pore structure and the z position, while the 4pi results show no such correlation
By creating a structural model taking all the data into account and fitting the position, rotation, and heterogeneity in each observation of a structure, we can spot systematic biases in localisation microscopy data… (2/5)
12.08.2025 16:18 — 👍 3 🔁 0 💬 1 📌 0
Group leader of the Computational Microscopy for Cell Biology (CMCB) lab @ SciLifeLab, Stockholm.
Physicist studying cells with ML and fancy microscopes!
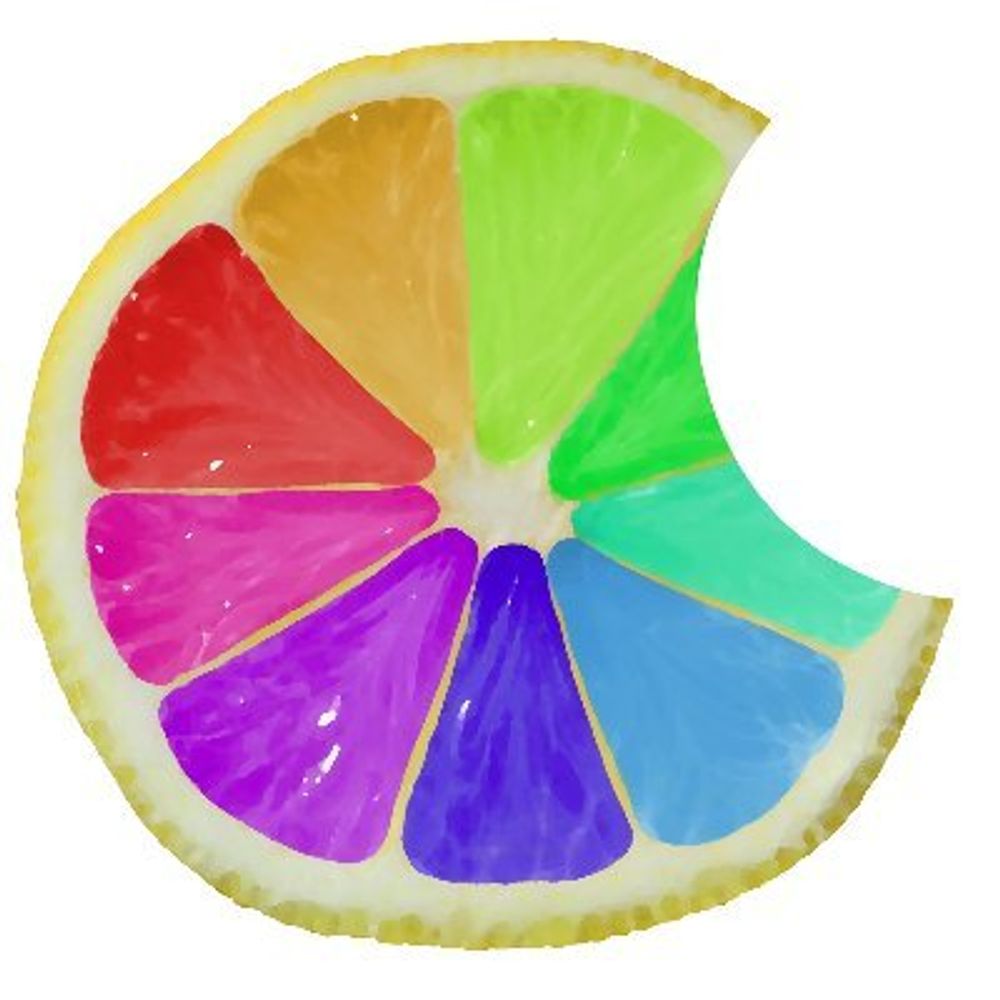
Biophysics, cytoskeleton and self-disorganization
Biomedical Computer Vision & Language Models, scads.ai / Leipzig University, also NFDI4BIOIMAGE, NEUBIAS/GloBIAS, GPUs, AI, ML 🔬🖥️🚀 views:mine
Professor of Biophysical Chemistry - Cambridge University | Co-founder - ZOMP | Podcaster - TheScienceShed
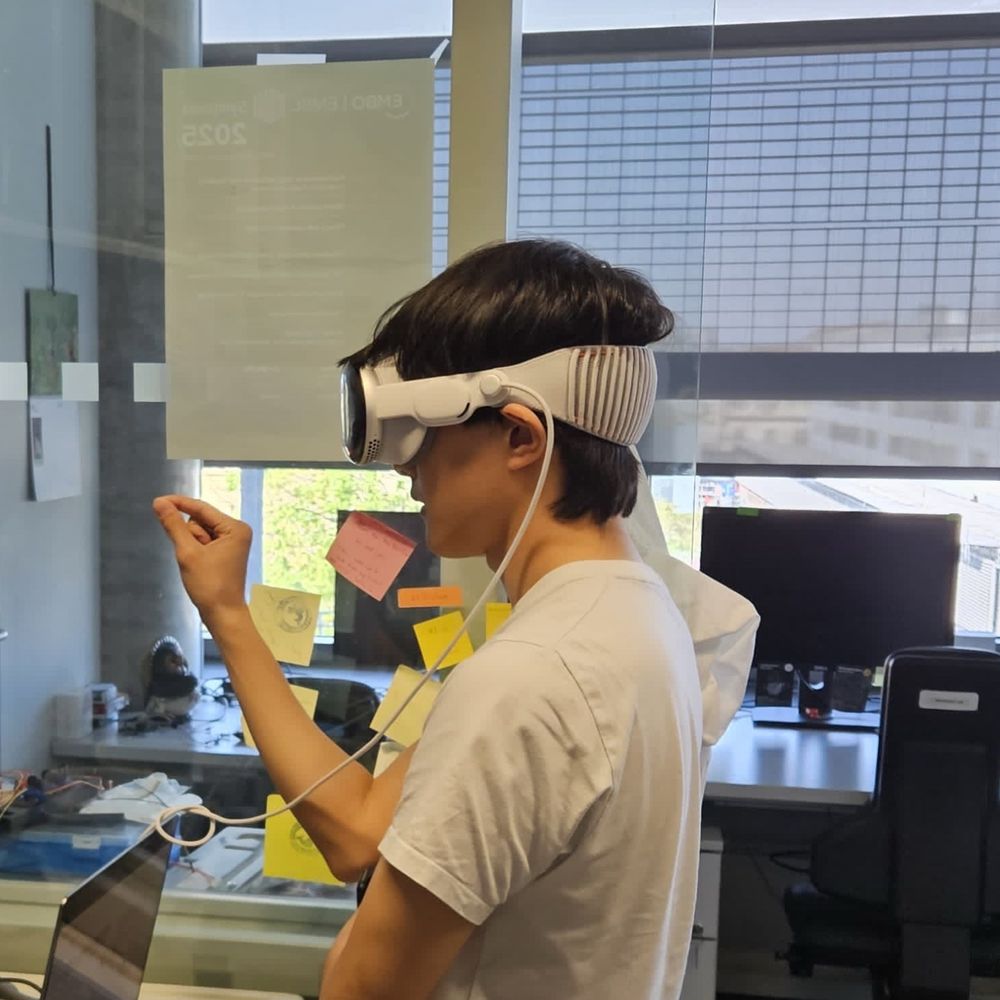
phd student @brugueslab.bsky.social - biophysics & cross-disciplinary spirit
shuzokato.github.io
Research engineer and core facility manager at the Institut Pasteur
https://research.pasteur.fr/en/team/image-analysis-hub/
Everything #TrackMate #Mastodon-sc (the tool to track lineages in microscopy videos, not the social networks etc).
Views are my own
Advanced microscope development Group Leader King’s College London. FLIM/FRET since 2001
Membrane cytoskeleton, specifically septins. Nanobodies, superresolution. Developing microscopy assays for cell biology. We love complicated experiments! Opinions my own as scientist, parent, citizen.
Group Leader at Max Planck Institute for Molecular Genetics
Studying genome organization with quantitative super-resolution microscopy
https://www.molgen.mpg.de/stein-lab
Evolutionary cell biology @EMBL
evonuclab.org
Spectroscopist, microscopist, pessimist. SRA in the Cambridge Chemistry Department. Science and/or nonsense. Occasionally a post about personal matters, instantly regretted. he/him | 🏳️🌈
Fascinated by fungal growth & asymmetries. Institute of Biology Valrose, CNRS-Inserm-Université Côté d’Azur, Nice. Microscopy addict, all things cell biological
Single-molecule biophysics group at Goethe University Frankfurt/Germany. Super-resolution microscopy. Optical structural cell biology. Computational microscopy. Posts by MH.
http://www.smb.uni-frankfurt.de
#superresolution, #livecellimaging, #imageanalysis
CNRS Research director, Nanobio ISMO #superresolution #SMLM #FLIM #SAF #ModLoc #Microscopy @gdrimabio codirector. Scientific advisor for @abbelight. #Foodlover
Investigating origins and vulnerabilities of cancer chromosomal instability at the Barts Cancer Institute, London UK. Www.Mcclellandlab.com
Fellow in Bacteriology, University of Glasgow. 🏴
Microscopist, microbiologist, coffee drinker.
He/Him. All views own.
🧫✨🔬