Censor and sensibility, the weather, and Transylmania
Updates from February 2025 from Aman, on film censors, Dracula and extreme weather.
Published the first issue of my newsletter! I'll be using this space to share progress on ongoing side projects, readings and other web things that I found interesting that month.
This time, it's on film censorship, weather and Dracula.
Consider subscribing too :)
buttondown.com/amanbh/archi...
02.03.2025 11:00 — 👍 4 🔁 1 💬 0 📌 1

LAND OWNED BY NEGROES IN GEORGIA, U.S.A 1870-1900.
Challenge 03 (late entry, better late than never 😅)
Made using observable plot
urmilaj.github.io/duboischalle...
#duboischallenge2025 #dataviz #d3js
22.02.2025 18:50 — 👍 1 🔁 1 💬 0 📌 0
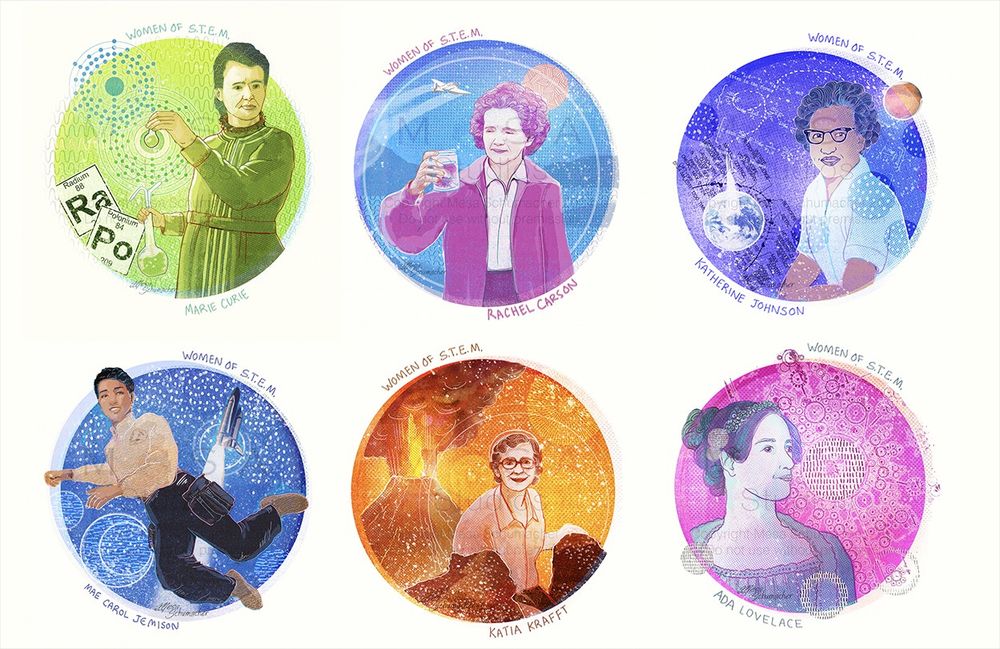
Happy International Day of Women and Girls in Science!
Important in these times, as institutions are defunded, censored, and dismantled. Say thanks you to your fav lady of science today!
#medart #scientificillustration #infoviz #illustration #womeninscience #STEAM #science #STEM #scicomm #sciart
11.02.2025 16:41 — 👍 50 🔁 15 💬 0 📌 1

ACRES OF LAND OWNED BY NEGROES IN GEORGIA.
1874,338769.0
1875,395669.9
1876,460699.4
1877,468828.1
1878,509471.6
1879,550115.1
1880,598887.3
1882,696431.7
1883,672045.6
1884,769589.9
1885,785847.3
1886,810233.4
1887,818362.1
1888,875263.0
1889,891520.4
1890,964678.6
1891,1013450.8
1892,1070351.7
1893,1045965.6
1894,1070351.7
1895,1037836.9
1896,1037836.9
1897,1062223.0
1898,1102866.5
1899,1062223.0
Challenge 02
urmilaj.github.io/duboischalle...
#duboischallenge2025 #dataviz #d3js
10.02.2025 19:13 — 👍 2 🔁 1 💬 0 📌 0
Hello dataviz and design people!
We're looking for a freelancer to help us with data visualization and/or diagrams at Works in Progress.
We cover topics like housing, technology, health, energy, and much more, and experience in these areas is a plus!
If this is you, get in touch! (details below)
10.02.2025 09:14 — 👍 61 🔁 33 💬 4 📌 1

VALUE OF LAND OWNED BY GEORGIA NEGROES.
$1263902 in 1875,
$1522173 in 1880,
$2362889 in 1885,
$3485176 in 1890,
$4158960 in 1895,
$4220120 in 1899.
Challenge 01
#duboischallenge2025 #dataviz #d3js
urmilaj.github.io/duboischalle...
03.02.2025 19:35 — 👍 2 🔁 1 💬 0 📌 0

Topic for day one, part-to-whole of #30DayChartChallenge. So here's a percentage chart showing the values of vegetarian or non-vegetarian dishes for each state or union territory. Thali or Bhojanam is a round platter used to serve food in South Asia. Thali is also used to refer to an Indian-style meal made up of a selection of various dishes which are served on a platter.
Thalis of India - Day 1, part-to-whole. Thali is a round platter used to serve food in South Asia. Thali is also used to refer to an Indian-style meal with a selection of various dishes which are served on a platter.
urmilaj.github.io/30daycharts2...
#dataviz #30DayChartChallenge
02.04.2024 03:13 — 👍 9 🔁 1 💬 0 📌 0
We're back!
17.03.2024 09:26 — 👍 14 🔁 3 💬 0 📌 0
Crafting visual stories with data @ http://amitkaps.com | Helping build an Indian Data Visualization Community @vizchitra.bsky.social
data/dev/design/map enthusiast
I run diagramchasing.fun.
Bangalore, India
#dataviz #rstats #svelte #maps
🔗 https://aman.bh
GIS and Cartography at Eurostat.
Exploring new ways of making maps.
observablehq.com/@joewdavies
Threlte is a 3D framework for Svelte
https://threlte.xyz
Information Designer / Creative Developer / Freelancer / 3D & Geo enjoyer / stefanreifenberg.com / kaldera.dev
Freelance data visualization designer and #D3js developer based in Mensk, Belarus. Open for hire worldwide #datavis @ yanouski.com
A space to connect and create with data | Organised India’s first data viz conference
🗓️ VizChitra 2026: 3-4 July, Bengaluru
📢 Inviting applications for talks, dialogues, workshops, and exhibition
More here: vizchitra.com/2026
❤️📊 | 🗣️DE|EN|FR | #rstats | #econsky
Art+Code, Developer/Designer, tool maker. Visualization, Go Programming Language.
Co-founder & editor, Works in Progress. Writer, Scientific Discovery. Podcaster, Hard Drugs. Advisor, Coefficient Giving. // Previously at Our World in Data.
Newsletter: https://scientificdiscovery.dev
Podcast: https://harddrugs.worksinprogress.co
🏳️🌈
Maps, charts, illustrations, animations, 3d models, data analysis and fun little easter eggs from your favorite graphics team. https://www.reuters.com/graphics/
Computers and decentralization.
We are dedicated to fostering community for data visualization professionals.
Tableau Evangelist/Data Visualization Consultant at Moxy Analytics | Hall of Fame Tableau Visionary | 6X Tableau Public Ambassador | One Half of the Flerlage Twins
📊 Data visualisation specialist.
💻 #RStats | #Python | #D3.
🎨 Generative artist.
🏃♀️ Runner.
Website: https://nrennie.rbind.io/
She/her. Views my own.
Freelance Data Designer
Programs Director @ Data Viz Society
She/they/whatever
programs@datavisualizationsociety-dot-org
BSs in Biology and Applied Physics, PhD in Organismic and Evolutionary Biology
Media & Communication 🌐 | Information Design 🧮 | Data Visualization 📊 | Digital Media 🖥️ | Passionate about effective communication through design. 🌟
Freelance Data Visualization Specialist and Data Analyst. 📊 Book nerd📚. Always seeking new insights and knowledge💡Available for Projects.
https://deepalikank.in/
Website: https://stevenponce.netlify.app/
GitHub: http://github.com/poncest/
LinkedIn: http://linkedin.com/in/stevenponce/
Building theschoolofcode.com - an interactive online course platform