A big thank also to you, all the Reef Life Survey
volunteers, without whom this work would not have been possible!
A big thank also to you, all the Reef Life Survey
volunteers, without whom this work would not have been possible!
I would like to warmly thank all the co-authors for their invaluable help with this @aurelien-boye.bsky.social, Rick Stuart-Smith, Graham J. Edgar, Elizabeth Oh, Stanislas Dubois and Martin Marzloff.
13.02.2025 10:00 — 👍 1 🔁 0 💬 1 📌 0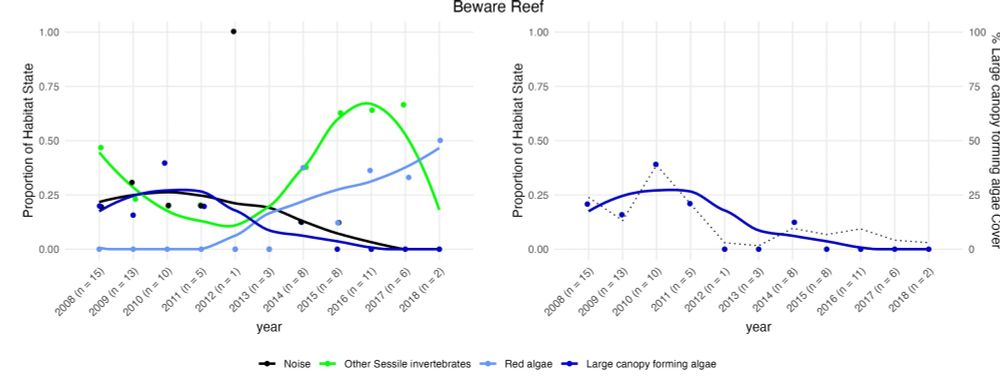
Change in the cluster composition of the Beware Reef. This site shiffted into an urchin barren in 2013 as show by the disaperence of large canopy algae (dark blue line).
🌍 Understanding habitat states & transitions is key for conservation!
🏝️ Helps track ecosystem shifts from climate change
🛑 Detects early warning signs of degradation (e.g., kelp loss → urchin barrens).
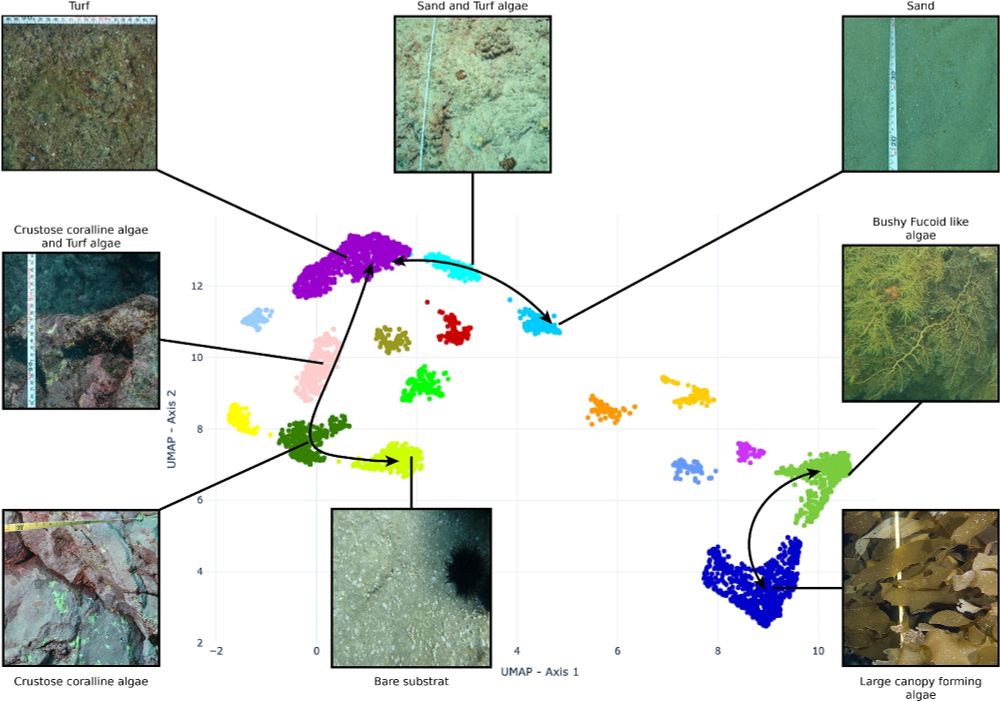
Description of the identified clusters along with photoquadrats examples. Arrows indicate transitions between clusters.
🌍 With our data-driven standardized way to classify & monitor marine habitats, what did we find?
🏝️ 17 distinct habitat states, including kelp forests, coral reefs & transitional zones
📉 Our pipeline captures fine-scale ecological changes over time
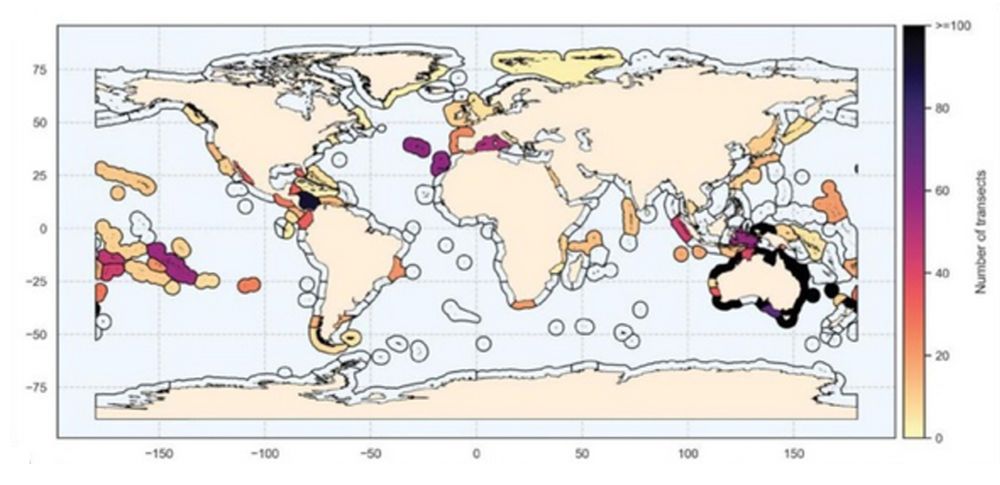
Map of the number of RLS transect sampled per ecoregion.
This study wouldn’t be possible without citizen scientists! 🌍🌊
👩🔬 Reef Life Survey divers collected 6554 transects worldwide
📸 Standardized photoquadrat sampling ensured consistency
📊 It enabled us to track habitat transitions over time
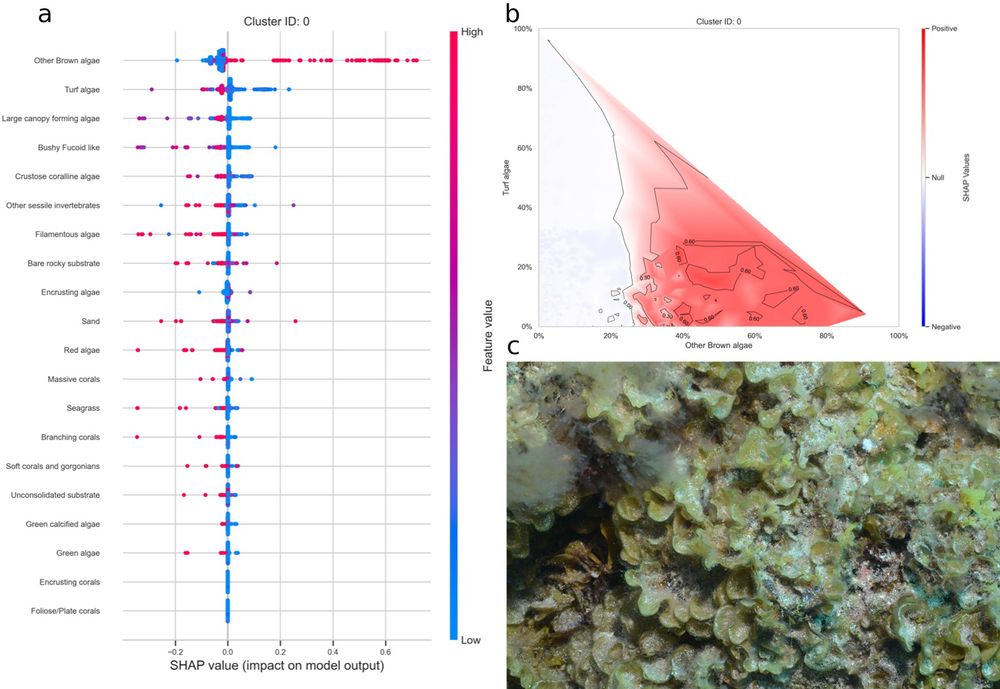
Using SHAP to Interpreting this cluster as a Foliose brown algae cluster.
Machine learning models like UMAP & HDBSCAN are powerful, but they’re often hard to interpret.
So, we used SHAP to:
📌 Identify which features drive cluster formation
📌 Uncover non-linear interactions in benthic ecosystems
📌 Improve ecological interpretability of results
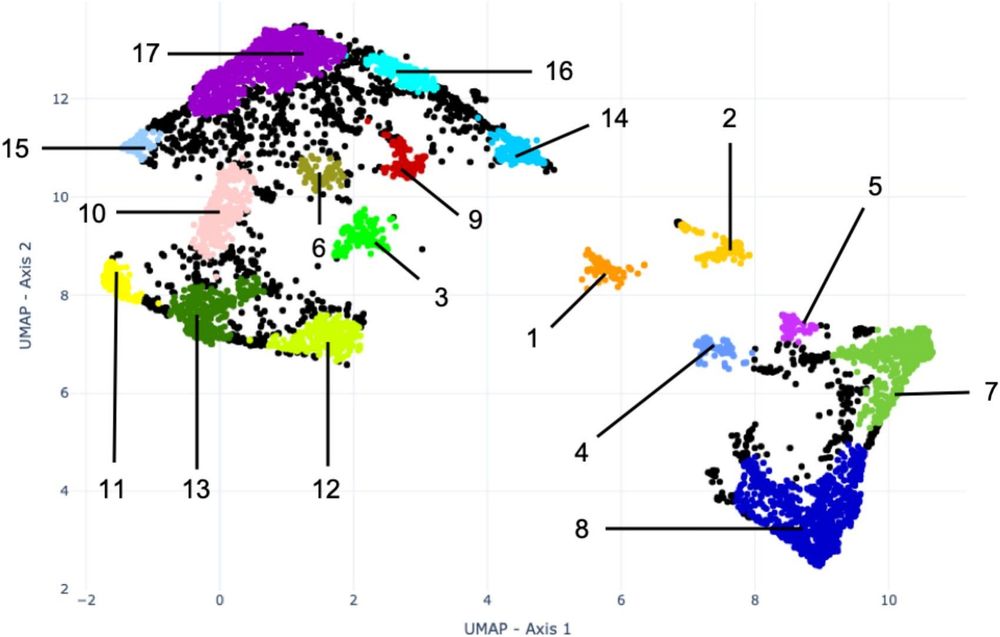
UMAP ordination of the benthic cover data. Each point is coloured accordingly to its cluster. Black points represent unclustered data.
We used better methods: UMAP (for dimension reduction) & HDBSCAN (for clustering).
✅ Captures complex ecological structures
✅ Finds clusters of varying shapes & sizes
✅ Filters noise instead of forcing data into clusters
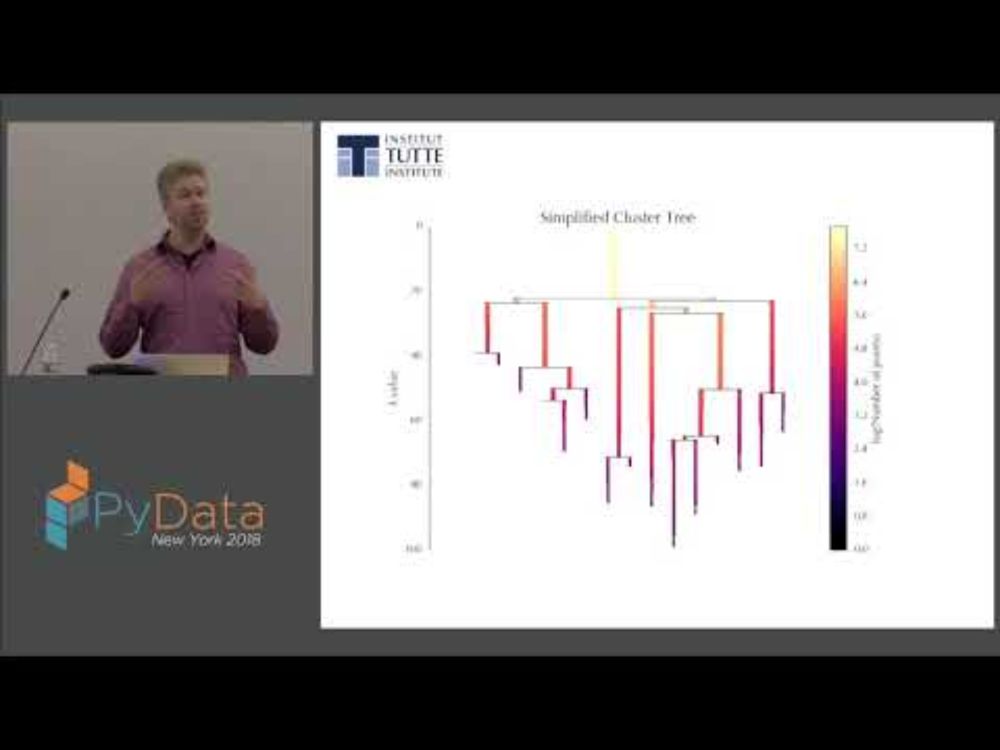
Clustering is widely used in ecology to define community types, habitat states & biodiversity patterns. But common methods used in ecology have major drawbacks. (See this excellent video of @JohnDataHealy
youtu.be/dGsxd67IFiU?...)
🚀 New paper alert! We used a UMAP-HDBSCAN pipeline to classify & track benthic habitat states at a global scale using citizen science data from Reef Life Survey ! 🌍🏝️
🔗 Read it here: doi.org/10.1016/j.ec...
#MarineScience #Ecology #CitizenScience #MachineLearning

Great talk @clementviolet.bsky.social given during the #BIOcean5D general assembly @ICM-CSIC! So much work went into looking up all those marine NIS native origins and building the ✨ Shiny app.Can’t wait to see the future #Rpackage #marineecology #ultraviolet 🧪🦀🐚🌱🪸 @ifremer.bsky.social
11.02.2025 15:32 — 👍 5 🔁 1 💬 0 📌 0