10 minutes
https://r.iresmi.net/posts/2025/10_minutes/
#rstats #datascience

@pacoramon.bsky.social
10 minutes
https://r.iresmi.net/posts/2025/10_minutes/
#rstats #datascience

From the DSLC.io aRchives:
🔵 usethis docs: Package setup youtu.be/edjAvUWg6qw
🔵 DSLC Project Club: {oregonfrogs} youtu.be/KDngQp3h8DU
Visit dslc.video for hours of new #DataScience videos every week!
#dataBS #RStats

Recent DSLC.io club meetings:
🔵 Data Visualization: Don't go 3D & 27 Understanding the most commonly used image file formats youtu.be/CoGn5oqgxT4
Visit dslc.video for hours of new #DataScience videos every week!
#dataBS #RStats #PyData #DataViz
Estimate Multinomial Logit Models with Observed and Unobserved Individual Heterogeneity Use gmnl With (In) R Software
dik.si/ggmnl
Instrumental variables estimation using heteroskedasticity-based instruments Use ivreg2h With STATA 19
ln.run/ivreg2h
#rstudio #rstats #rsoftware #rstatistics
TIL you can create and customize ggplot2 visualizations using your voice alone. #Rstats
27.09.2025 14:23 — 👍 29 🔁 6 💬 1 📌 1Announcing a new feature in the Posit Publisher extension!
Now you can use push-button publishing to deploy to Connect Cloud directly from #Positron and VS Code to streamline deployment for #Python and #RStats users.
Learn more: posit.co/blog/connect...

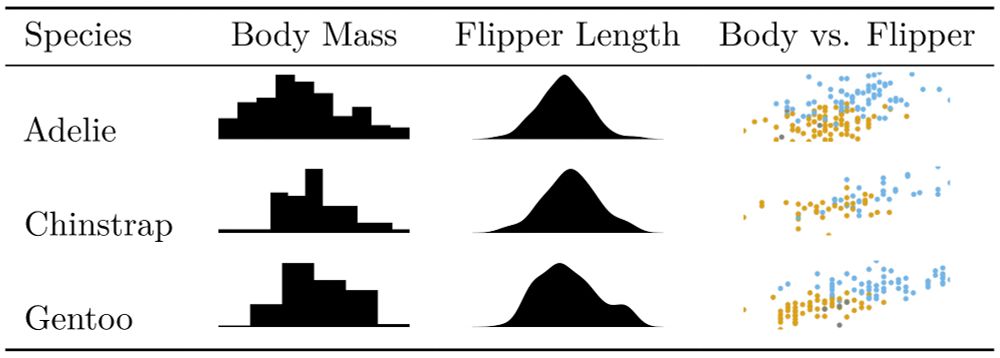
The Art of Data Visualization with ggplot2: A free online book by @nrennie.bsky.social that guides us through the entire process of creating plots, including why certain decisions were made, using real datasets that have been part of #TidyTuesday. Very excited to get stuck into this one. #rstats
11.09.2025 20:41 — 👍 61 🔁 30 💬 2 📌 3
Screenshot of the positron IDE with a tab showing a list of issues and an open issue.
Oh, boy, I has missed this positron feature. You can link your github account and access PR and issues directly from the IDE.
#RStats
#rstats 📦 {latentnet} 2.12.0 is now on #CRAN. It implements a long-requested feature for fitting count networks (interactions, co-occurrences, etc.) using a binomial model. Different pairs of actors can now have different binomial "trials". Full news at cran.r-project.org/package=late... .
12.09.2025 06:10 — 👍 7 🔁 2 💬 0 📌 0
v0.16.1 of the #rstats #eq5d package is now on #CRAN. The release includes the recent EQ-5D-5L value set for Singapore and the EQ-5D-Y-3L value set for Australia.
More info and examples of how to use it at github.com/fragla/eq5d and cran.r-project.org/package=eq5d.
@euroqol.bsky.social
#heor #hta

An APA-formatted table of demographic characteristics of a sample
Recreating each of the tables in Chapter 7 of the Publication Manual of the American Psychological Association (7th Edition) tables in R with apa7 (Part 2 of 24)
Featuring hanging indents, column spanners, and decimal alignment
wjschne.github.io/posts/apatab...
#rstats #apastyle
CRAN (un-officially) endorses the {bracket} notation of referencing packages! #RStats
12.09.2025 13:28 — 👍 18 🔁 4 💬 2 📌 0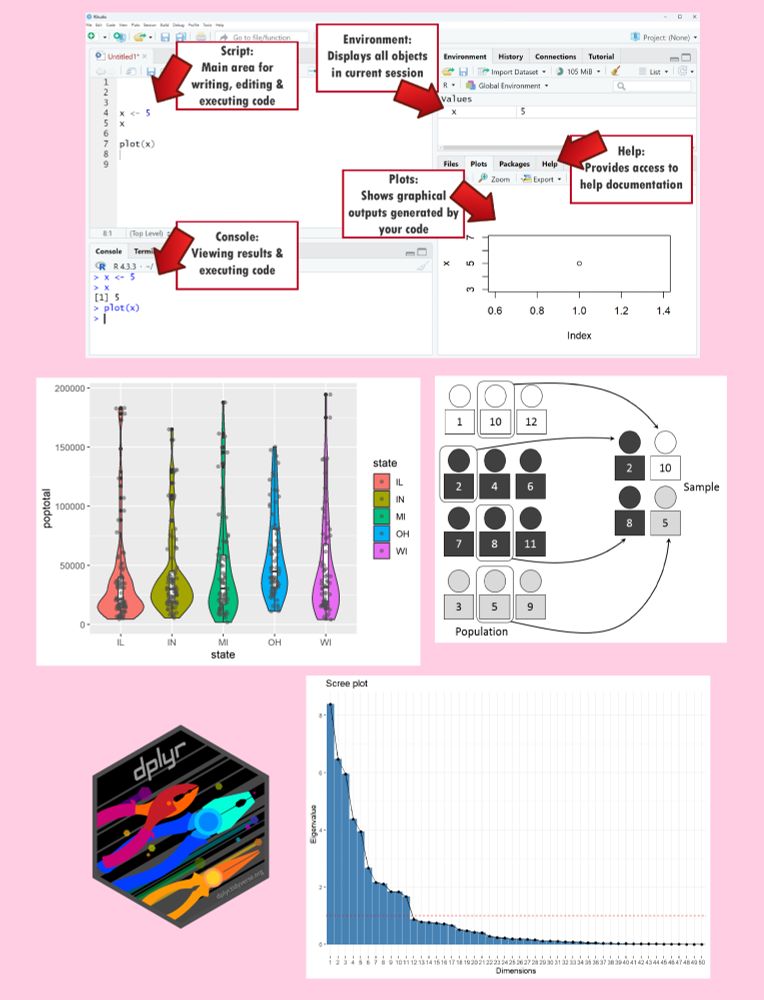
Free course previews:
- Working with Rows: statisticsglobe.com/online-cours...
- Violin Plots: statisticsglobe.com/online-cours...
- Sampling Methods: statisticsglobe.com/online-cours...
- PCA in R: statisticsglobe.com/online-cours...
#rstats #statistics #datascience #rstudio #dataviz
New blog post: Easily download files from the Open Science Framework with Papercheck daniellakens.blogspot.com/2025/07/easi...
Downloading all files in an OSF project can be a hassle. Not anymore, with Papercheck! Just run:
osf_file_download("6nt4v")
This is such a cool addition to the powerful #rstats functionality enabling smooth #OpenScience workflows 🤩
22.07.2025 11:36 — 👍 13 🔁 5 💬 0 📌 0
Looking to strengthen your #causalinference skills? Join @noahgreifer.bsky.social on Aug. 12-15 for "Causal Inference in R Using MatchIt and WeightIt" to gain the skills to apply these #Rstats packages to estimate and interpret treatment effects.
22.07.2025 13:14 — 👍 4 🔁 3 💬 0 📌 1
🚀 Webinar 8/28 10 AM PT | Git, GitHub CI/CD & LLMs for clinical trials.
15+ pharma programmers reveal: ⚙️ Branching/PRs, 🤖 Actions‑driven QC, ✨ LLM edge‑case checks.
Speakers: Ning Leng, Eli Miller, Ben Straub
Register ➡️ r-consortium.org/webinars/unl...
#rstats #opensource
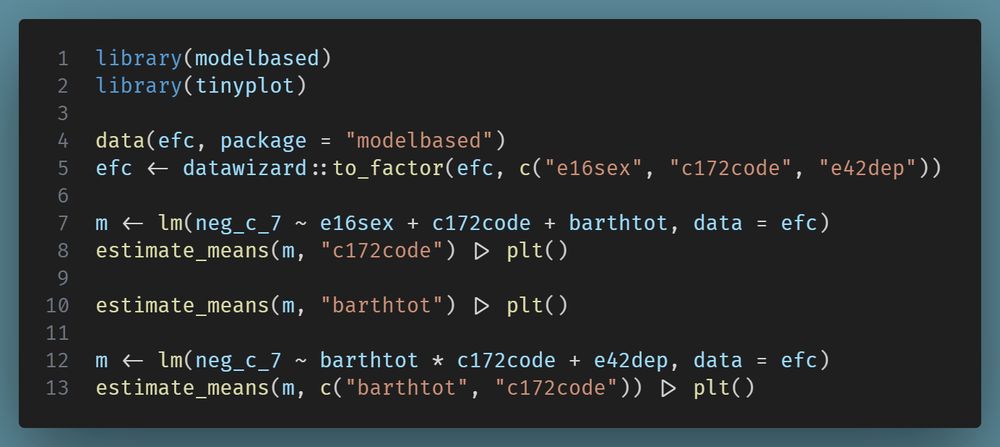
🎉 Great news, R users! 🎉 We're thrilled to announce that {tinyplot} support is coming to the #rstats #easystats project! Get ready for even more amazing stuff to make your data analysis a breeze! 📊✨
@gmcd.bsky.social @vincentab.bsky.social @zeileis.org
Looking forward to seeing you there!
#RStats #RLadies #RLadiesMelb #DataScience
CRAN release of reproducibleRchunks v1.1.0 - now with full support of all standard knitr code chunk options.
There are also some example vignettes to get you started: brandmaier.github.io/reproducible...
or just read our Open Access article in Collabra: Psychology: doi.org/10.1525/coll... #rstats
At R/Medicine 2025, TCB's @tcash21.bsky.social shared how we streamlined patient support tracking for a rare disease pharma using #RStats, #Shiny, and Smartsheet. Check out a recap and watch the talk here: tcbanalytics.com/2025/07/02/r...
02.07.2025 19:58 — 👍 1 🔁 2 💬 0 📌 0
Not all R packages are clearly “good” or “risky”, most fall somewhere in between. This post introduces our scoring framework around package documentation. We investigate the different measures, then look at a few well known packages.
#rstats #packagevalidation #softwaredevelopment
🗓️ NHS-R Community Events 🗓️
Don’t forget to check out the NHS-R Community website (nhsrcommunity.com/events.html) to register for the latest workshops, webinars and Coffee and Coding sessions!
We look forward to seeing you there! 😊
#rstats
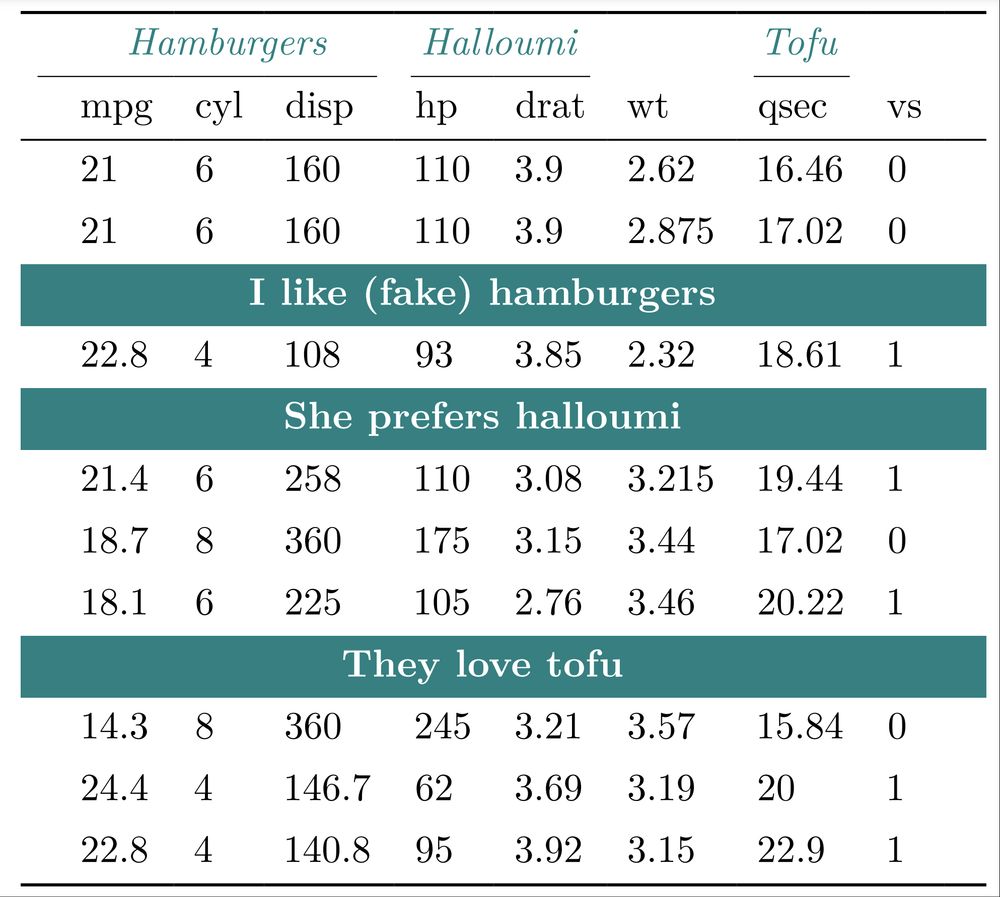
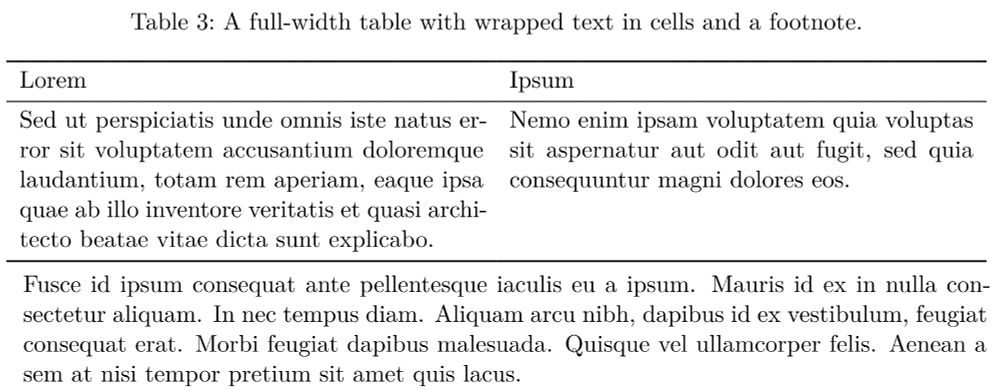
{tinytable} is a dead simple, ultra-flexible, and dependency-free #Rstats 📦 to turn data frames into beautiful tables: html, word, pdf, latex, typst, markdown, etc.
v0.10.0 has cool new features and important bug fixes. Check out the detailed tutorials at:
vincentarelbundock.github.io/tinytable/

📢 Don’t forget!
Join us today at 6PM CEST for our R-Ladies Rome workshop with @@ramikrispin:
“Forecasting Time Series with Linear Regression: A Feature-Driven Approach” 📈
🔗 www.meetup.com/rladies-rome...
#rstats #timeseries #DataScience #RLadiesRome #Rusers #MachineLearning #OpenSource
📝 "Revealing research"
👤 Alison Hill
📖 Research reveals reveal.js slide-making challenges. Improving user experience is the goal.
🔗 https://www.apreshill.com/blog/2021-07-revealing-research/
#rladies #rstats #oldiebutgoodie
📝 "Parameterising a multi-part plot"
👤 Cara Thompson (@cararthompson.bsky.social)
📖 Avoid repetitive coding! Learn to parameterize plots in R. #rstats
🔗 https://www.cararthompson.com/posts/2024-03-14-parameterising-a-multi-part-plot/
#rladies #rstats #datavisualisation #parameterisedplots

🎉 We’ve just kicked off our Data Visualization in R course: From Data Wrangling to Interactive Plots!
Let´s turn raw data into powerful, beautiful stories with #ggplot2, #plotly & more! 📊✨
#RStats #DataViz #DataScience #InteractivePlots #