A new way to explore UK Poverty data ⬇️
Poverty is deepening. Developing solutions to tackle this problem starts with clear, accessible evidence.
To make our data more accessible we’ve published all charts, maps and tables from our UK Poverty 2026 in a new, interactive dashboard.
29.01.2026 13:42 — 👍 5 🔁 3 💬 1 📌 4
⛓️ ‘Where jobs went, so did the things that held communities together'
Poverty affects the whole of the UK, but it’s not distributed evenly.
Our analyst @scothunter.bsky.social sets out where poverty is most acute, and the action needed for all communities to thrive, no matter where they are.
29.01.2026 12:59 — 👍 12 🔁 11 💬 2 📌 0
Poverty is deepening.
🔎 Our #UKPoverty2026 report was launched this morning.
People in very deep poverty now make up the biggest group of people in poverty, at 6.8 million people.
This is unacceptable for the fifth richest country in the world, and it has consequences.
27.01.2026 07:53 — 👍 188 🔁 170 💬 6 📌 31
The persistence of relative deprivation shows that something needs to give. Where you are born or live should never determine your chances in life.
28.11.2025 09:24 — 👍 2 🔁 0 💬 0 📌 0
Weak labour markets and low employment rates are likely contributing to poverty in these areas. While some areas may have lower housing costs, other local factors (such as access to services, rural vs. urban settings, housing quality, and local economic conditions) can intensify these challenges.
28.11.2025 09:24 — 👍 1 🔁 0 💬 1 📌 0
Monmouthshire was the only local authority to have none if it’s areas in the most deprived decile; Powys and Ceredigion each had one.
28.11.2025 09:24 — 👍 0 🔁 0 💬 1 📌 0
This amounts to approx. 13400 Blaenau Gwent residents and approx. 28700 Newport residents living in the most deprived local areas where work is insecure and pay does not go far enough, where economic and educational opportunities are limited, and where people are more likely to live in poor health.
28.11.2025 09:24 — 👍 1 🔁 1 💬 1 📌 0
Blaenau Gwent continues to have the highest rates of deprivation, with 9 of its 46 areas (20%) falling into the most deprived decile, followed by Newport, where 18 of 100 local areas (18%) fall into the same category.
28.11.2025 09:24 — 👍 1 🔁 0 💬 1 📌 0


The new Welsh IMD shows persistent disadvantage across Wales. While there has been some minor adjustments to the methodology, the overall picture is similar to that of the 2019 release.
28.11.2025 09:24 — 👍 5 🔁 2 💬 1 📌 0

I bought my home for £4000 in 1970, I worry about the mansion tax
> Home purchased for £4k in 1970, now worth £4m
> That's £3.945m more than if it had just increased with inflation
> Her house has effectively gained £72k in value every year in today's prices
> Her house earned around double what the average UK earner did each year
28.11.2025 08:29 — 👍 12 🔁 3 💬 0 📌 1

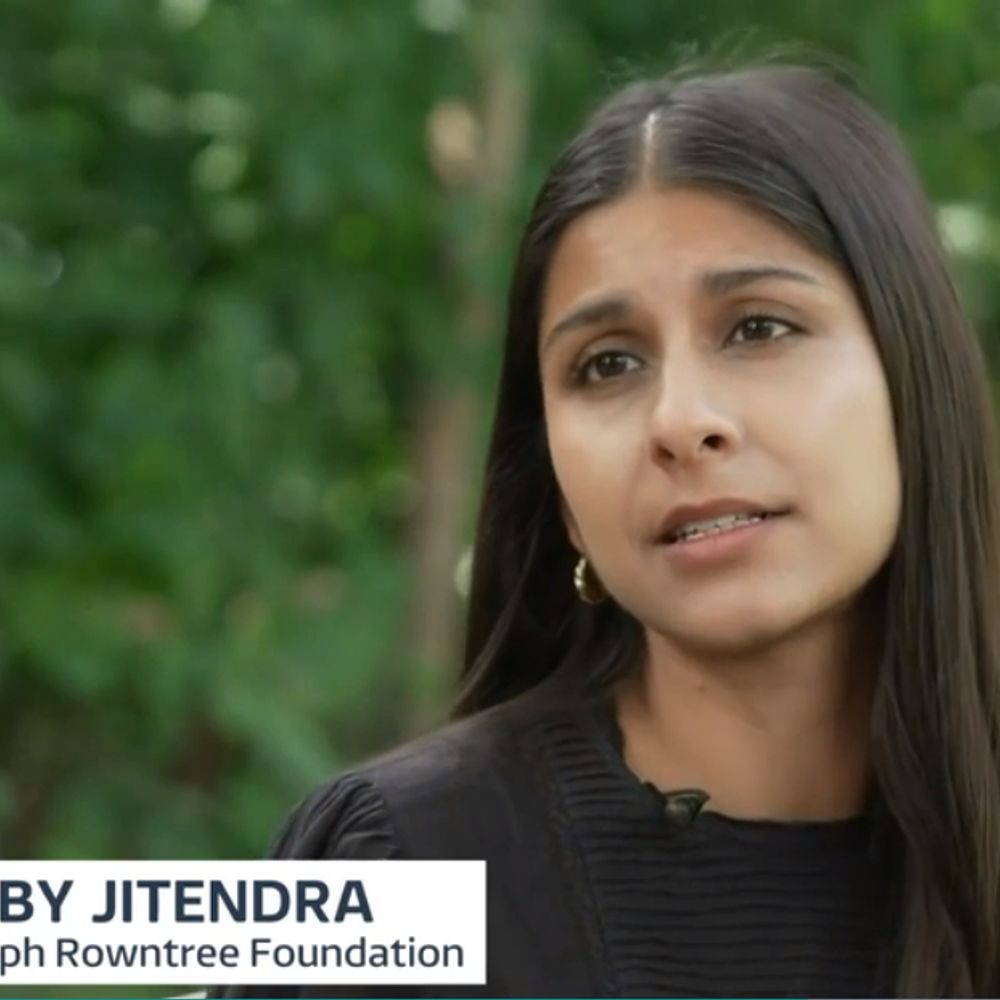
Every child, no matter their background, deserves to have a good start in life. Ethnic minority children were disproportionately impacted by the two child limit which widens ethnic disparities in child poverty rates.
Scrapping this cruel policy to lift 450000 children out of poverty is a huge win!
26.11.2025 14:02 — 👍 32 🔁 8 💬 0 📌 0
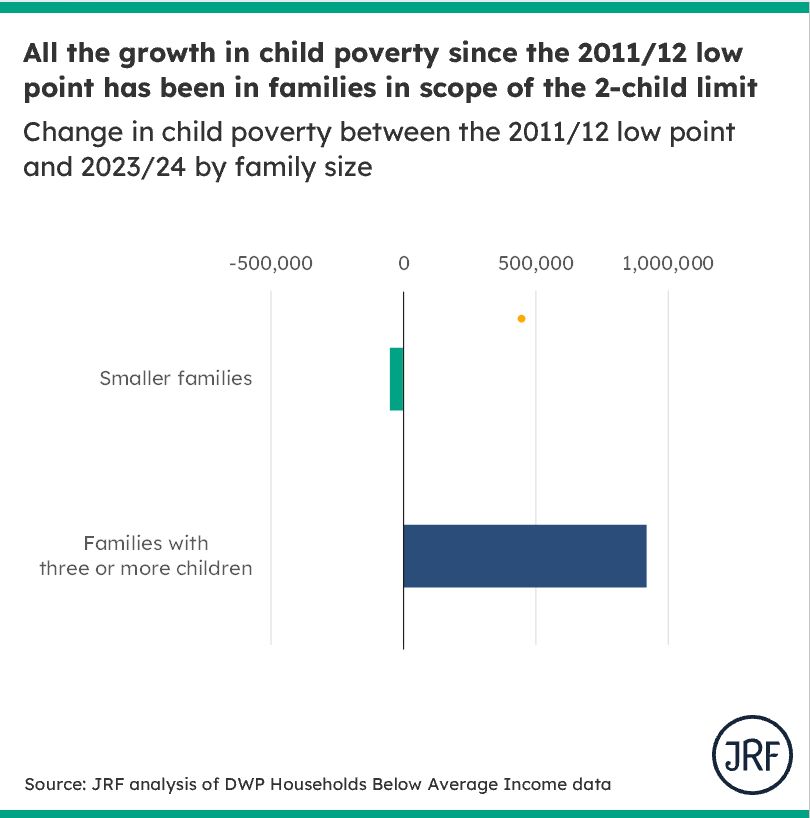
Between 2011/12 and 2023/24, child poverty rose by 900,000 in total. This is entirely due to increases in poverty in families with three or more children, with a small fall in poverty for smaller families over the period.
A child poverty strategy with the 2-child limit in place would *not* be a credible child poverty strategy. *All* of the growth in child poverty since the 2011/12 low point is for children in scope of this policy.
24.11.2025 15:45 — 👍 56 🔁 31 💬 0 📌 3

Image showing front cover of Government's statement on asylum and returns policy (titled 'Restoring Order and Control').
No one in the UK should experience destitution - wherever they were born – and destitution should never be an acceptable outcome of policy. But some policies announced in the Home Secretary’s asylum statement risk increasing destitution. 🧵1/7 www.gov.uk/government/p...
18.11.2025 08:30 — 👍 19 🔁 15 💬 1 📌 0

🚨New deprivation data reveals continual deep regional divides across many areas in England.
High levels of deprivation are concentrated in many ex-industrial northern and midlands towns and coastal areas, where manufacturing and tourism industries have been lost.
31.10.2025 13:38 — 👍 17 🔁 12 💬 2 📌 0

What is life really like in one of England's most deprived towns?
Hastings in East Sussex is one of the most deprived local authorities in England, data shows.
Spoke to the BBC about the drivers of deprivation and the impact on families. There's a clear link between living in hardship & feeling socially/politically disconnected.
To make meaningful progress, communities must be involved in decisions affecting their lives.
www.bbc.co.uk/news/article...
03.11.2025 09:40 — 👍 17 🔁 8 💬 0 📌 0

Figure 1: Private rents have been consistently above 30% in England, below 30% in Northern Ireland, and usually below 30% in Wales
ONS have published new private rented affordability analysis for 2024.
Ratios of rents to incomes dipped in 2022/23 as incomes climbed faster than rents.
Rents have been catching up so affordability has worsened again and seems likely it will continue to worsen through 2025...
18.08.2025 09:58 — 👍 6 🔁 5 💬 1 📌 1

👉OUT NOW!👈
"A Handbook of Integration with Refugees: Global Learnings from Scotland"
Edited with @alisonphipps.bsky.social and @esaldegheri.bsky.social
The book is FREE to download from www.multilingual-matters.com
13.08.2025 18:02 — 👍 7 🔁 6 💬 1 📌 0
This isn't just a statistic, it's people's family members dying before they should, and all the pain that comes with that. It's also a reflection of deep-seated structural issues.
09.07.2025 06:43 — 👍 0 🔁 0 💬 1 📌 0
In the most deprived parts of England, there were an expected 569 early deaths for every 100,00 people. The (unweighted) average in England was 446.
09.07.2025 06:43 — 👍 0 🔁 0 💬 1 📌 0
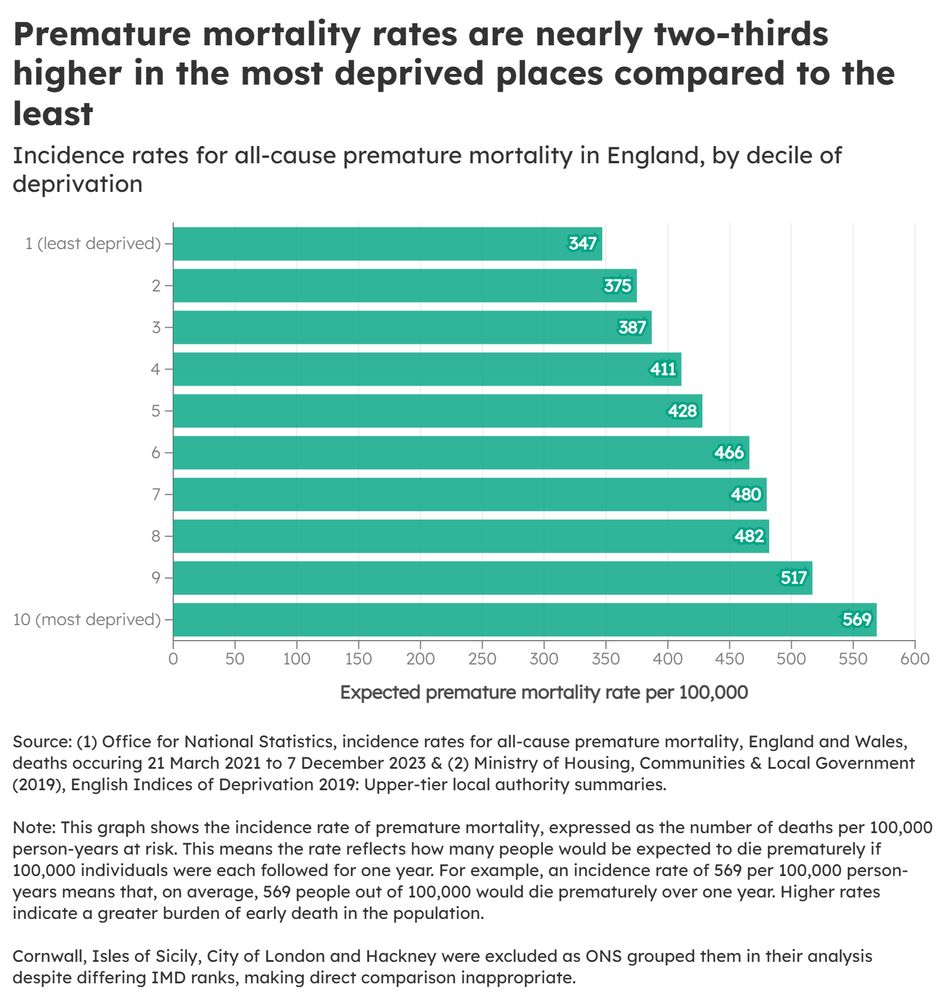
The latest figures released yesterday on premature mortality in England and Wales reveal another stark and persistent inequality: From March 2021 to December 2023, people living in the most deprived areas were 64% more likely to die prematurely than those in the least deprived places.
09.07.2025 06:43 — 👍 3 🔁 1 💬 1 📌 0
The data shows a clear and growing trend: inequality is deepening, and it’s costing people not just years of life, but years of quality life. This growing disparity highlights the urgency of addressing the social and economic factors that continue to shape unequal health outcomes across the country
04.07.2025 11:06 — 👍 0 🔁 1 💬 0 📌 1
‼️ That's a nearly 20-year gap, not in lifespan, but in the number of years lived in good health‼️
With the state pension age now at 66 (and rising), many people in the most deprived areas are spending their final working years in poor health, or not living long enough to enjoy retirement at all.
04.07.2025 11:06 — 👍 0 🔁 0 💬 1 📌 0
Between 2020 and 2022, men and women born in the most deprived areas could expect to live just 51.1 and 50.5 years in good health, respectively.
In contrast, those in the least deprived areas could expect over 70 years of healthy life.
04.07.2025 11:06 — 👍 0 🔁 0 💬 1 📌 0
🚨 New data from the Office of National Statistics (ONS) reveals a stark and persistent truth: in England, the place you're born still plays a major role in determining how well (and how long) you live.
04.07.2025 11:06 — 👍 3 🔁 6 💬 1 📌 0
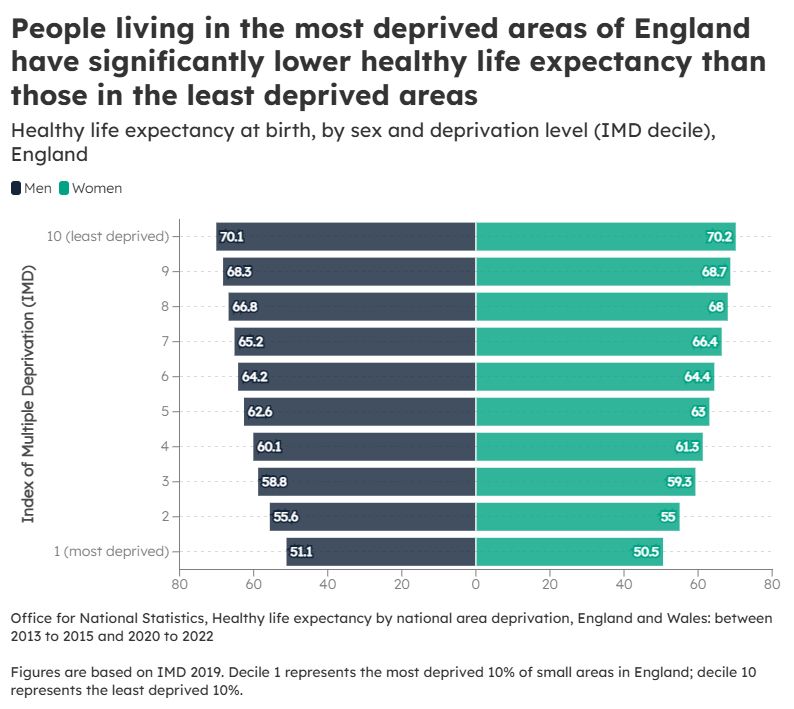
Bar chart titled "Healthy life expectancy at birth, by sex and deprivation level (IMD decile), England". The chart compares healthy life expectancy for men (dark blue bars) and women (light green bars) across ten deprivation deciles, from most deprived (Decile 1) to least deprived (Decile 10), based on the Index of Multiple Deprivation (IMD).
In Decile 1 (most deprived), healthy life expectancy is approximately 51.1 years for men and 50.5 years for women.
In Decile 10 (least deprived), it rises to about 70.1 years for men and 70.2 years for women.
The chart shows a clear upward trend in healthy life expectancy as deprivation decreases, with a nearly 20-year gap between the most and least deprived groups.
Source: Office for National Statistics (ONS), 2020–2022 data.
04.07.2025 11:06 — 👍 11 🔁 10 💬 2 📌 2

Photo of criminologists Dr Ashley Rogers, Dr Hannah Graham, and Dr Diana Miranda in graduation gowns and smiling.

Photo of Prof Peter Matthews and Dr Niall Hamilton-Smith, with Dr Ben Matthews in the background, all wearing graduation gowns at a University of Stirling graduation.
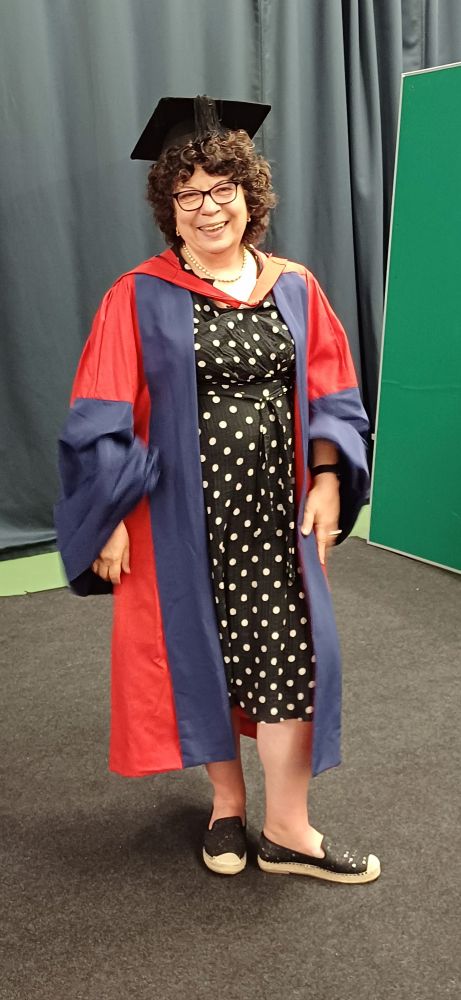
Photo of Dr Marina Shapira wearing her graduation gowns and cap, smiling.
Congratulations to our students who graduated @stir.ac.uk 👏💐🎓🎉
Hooray for Dr Beth Cairns, Dr @scothunter.bsky.social, & Dr Jade Hooper getting PhDs!
📸 Academics:
@niallhsmith.bsky.social @urbaneprofessor.bsky.social @dianamiranda.bsky.social @drashleyrogers.bsky.social @drhannahgraham.bsky.social
26.06.2025 16:40 — 👍 15 🔁 5 💬 0 📌 0
1 in 6 children in Wales has been in poverty in 3 out of the last 4 years.
🚨 Urgent, radical action from the Welsh and UK governments is needed to avoid lasting consequences.
Our report out today with the Bevan Foundation lays bare the state of poverty in Wales in 2025.
1/6
10.06.2025 06:57 — 👍 23 🔁 27 💬 1 📌 5
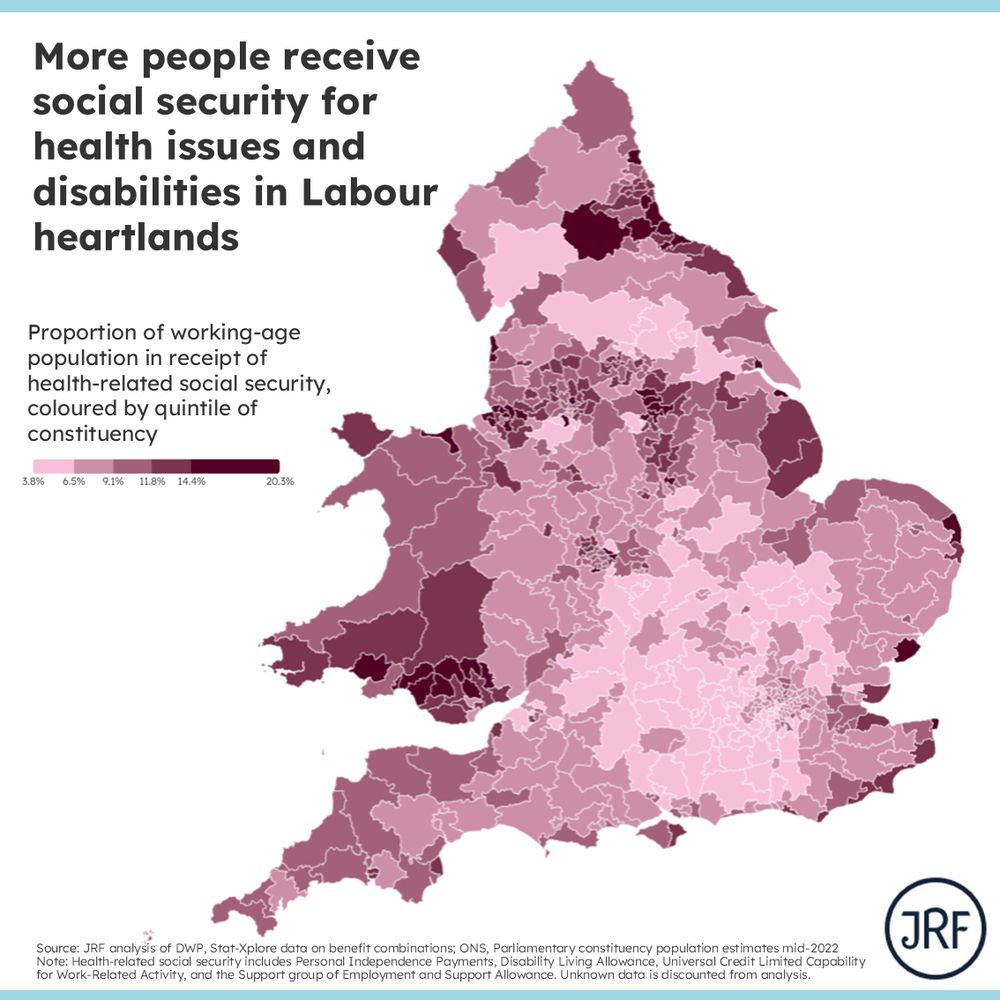
Map showing proportion of working age population in receipt of health related social security, coloured by quintile of constituency. In some coastal areas, south Wales, the North West and Yorkshire and North East, rates are between 15-20%
Where will the cuts to sickness & disability benefits hit hardest?
New @jrf-uk.bsky.social constituency analysis shows the % of working age people receiving these benefits in England & Wales.
Some MP inboxes are likely to be brimming, as concern about these plans is widespread
02.04.2025 13:06 — 👍 29 🔁 33 💬 1 📌 7
You would kind of hope that the Jobcentre might know where to find workers to fill its own vacancies really wouldn't you?
31.03.2025 09:54 — 👍 43 🔁 5 💬 2 📌 0
PhD@EUI/ Citizenship & migration, political theory/ Cooking & coffee
Research Fellow @University of Glasgow, Co-I & Leadership Group member @the Scottish Centre for Admin Data Research (SCADR), part of ADR UK. Formerly @Nuffield College, Oxford University. Social & health inequalities, labour market & welfare benefits.
mum to four young adults, mathematician, foodbank worker, university after children: MSc: Inequality and Social Science at LSE. Interest: perceptions of hunger
Slowly losing my mind, patience & filter! Centre Left. Politically homeless! Sweary AF, loves a rum & Dr Pepper 😋 🍹
Thyroid Cancer Survivor, Long Term Sick, Perimenopausal, Aphantasia
🚫 Crypto / Trading / Cam Girls / Anyone begging for money 🚫
Football, wine, jazz, rugby, coffee, numbers, food, plaques, pubs, beer, buildings. York, England
Sociologist at Stirling Uni. Interests in social network analysis, social stratification, disadvantage, health egonets, quantitative methods and some other stuff.
🏳️🌈 🇪🇺 ✅ Socialism and sequins. HIV+ he/him.
✊ 🇵🇸 🇺🇦 🏳️⚧️
OT & MOHO geek/writer - MOHOST, MOHO-ExpLOR, Recovery through Activity, A guide to the formulation of plans & goals in OT - she/her
Expert on local services esp housing, migration, migrant communities, community safety, human rights. First UK councillor migrant champion. she/her pronouns. Post in Spanish and English 💜💙🤍💜💙🤍
Welcome to the Newsmast Poverty & Inequality Channel. A curated feed of posts from the Fediverse, handmade by @newsmast@newmast.social, and […]
[bridged from https://newsmast.community/@povertyandinequality on the fediverse by https://fed.brid.gy/ ]
Retired Jack of no trades. UK/Scottish politics, other politics, Football, Cricket (UK), almost any sport, Science, History and other random stuff.
Views my own. Inc the above view from my upstairs window.
Work on campaigns and public affairs at JRF. Current home Bethnal Green, from Wycombe. West Ham ST holder. Views mine.
Things Could Take Time To Get To Happen. Never Give Up. Keep Going Forward. No Let Nothing Stop You From Moving Towards Your Goals.
Companion blog to the Journal of Social Policy, Social Policy & Society, and the Journal of International & Comparative Social Policy, published by Cambridge University Press for the Social Policy Association.
I lead care, work & family policy at the Joseph Rowntree Foundation and think a lot about politics. Prev Citizens Advice, Trussell Trust.
Professor of Economics and Public Policy, King's College London; Senior Fellow, UK in a Changing Europe. Immigration, economics, public policy. Personal views only; usual disclaimers apply.
Books: Immigration (Sage), Capitalism (Quercus)