It seems like all, except the planets, were over time.
31.07.2025 11:30 — 👍 0 🔁 0 💬 0 📌 0
So, how would you measure today?
31.12.2024 18:32 — 👍 0 🔁 0 💬 0 📌 0
What would you do today if you wanted to maximize laughter?
What would you do today if you wanted to maximize time outside?
What would you do today if you wanted to maximize peace of mind?
31.12.2024 18:32 — 👍 0 🔁 0 💬 1 📌 0
It’s easy to measure your days in dollars earned or tasks completed, but there are other units of measurement to consider:
31.12.2024 18:32 — 👍 0 🔁 0 💬 1 📌 0
@jamesclear.bsky.social has a treasure trove of quotes in his newsletter. Here's one that particularly resonated with me recently: How should you measure your days? 1/4
31.12.2024 18:32 — 👍 1 🔁 0 💬 1 📌 0
I've been a bit scent-obsessed for most of my life so this is close to a dream project for me. Luckily there's a digital exhibition!
20.11.2024 12:38 — 👍 4 🔁 0 💬 1 📌 0
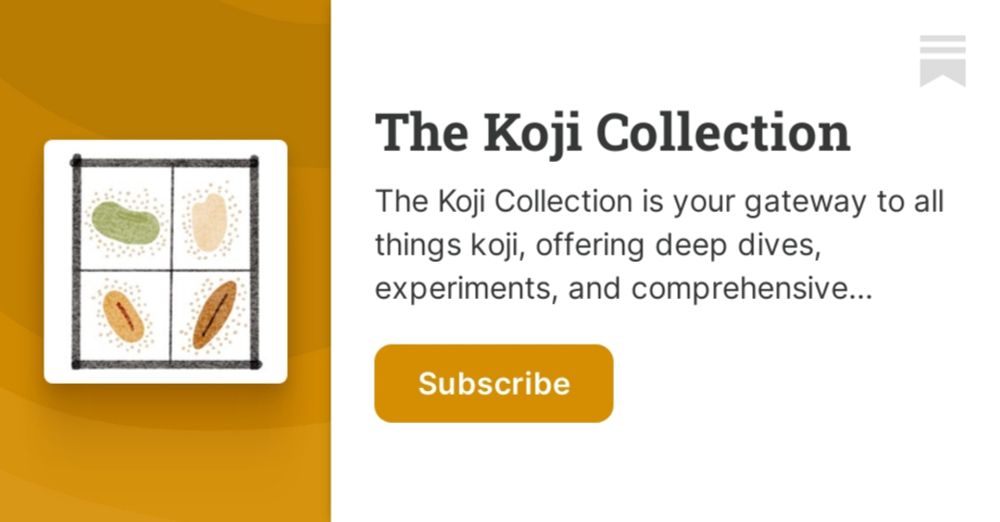
The Koji Collection | Substack
The Koji Collection is your gateway to all things koji, offering deep dives, experiments, and comprehensive practical guides to bring the magic of koji into your kitchen. Click to read The Koji Collec...
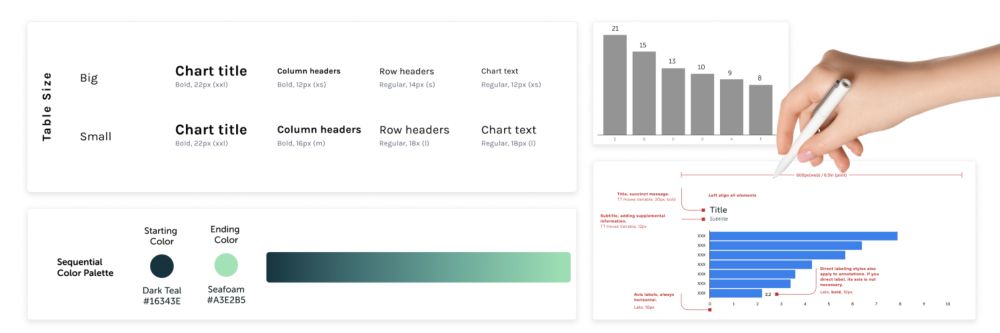
A friend and I have embarked on a project writing The Koji Collection, a series of niche books with detailed koji knowledge you won’t find in any one fermentation handbook. We are sharing it as we go along in Substack, where you will find dataviz, and later, sounds 👉
thekojicollection.substack.com
06.11.2024 15:21 — 👍 1 🔁 0 💬 0 📌 0
YouTube video by Loud Numbers
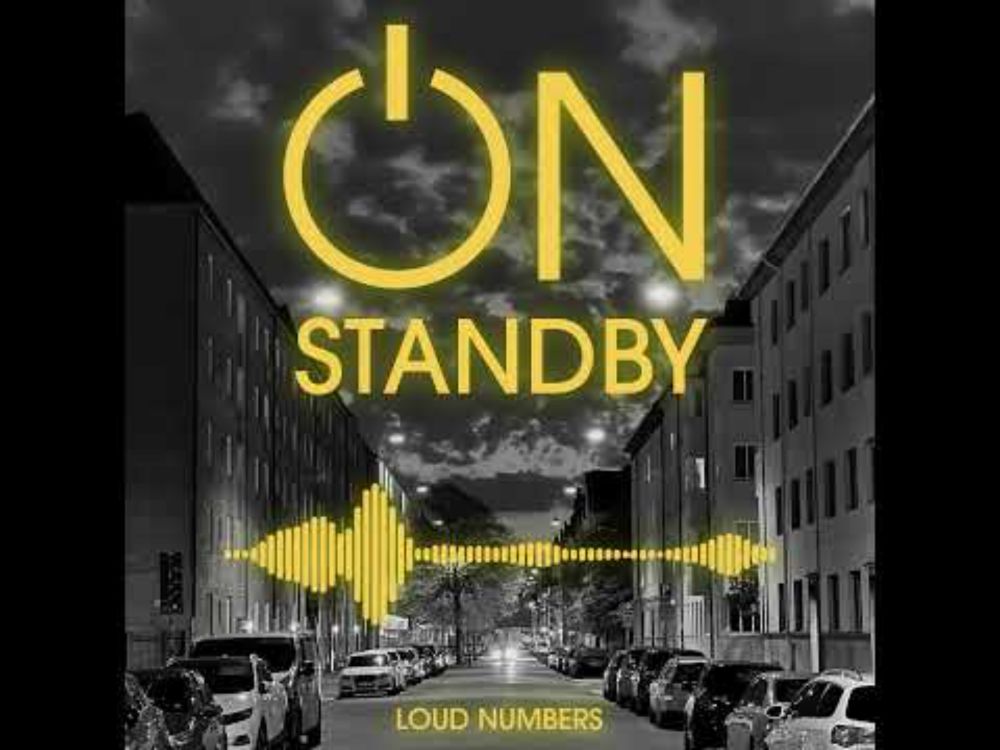
Trailer: On Standby
Loud Numbers came out with a trailer to their latest sonificaiton: www.youtube.com/watch?v=zzg2...
I got a sneak peak when I visited Duncan last month, and it's easily in my top 3 favorite sonifications. No spoilers - just start listening yourself.
06.11.2024 14:46 — 👍 1 🔁 0 💬 0 📌 0
Building @revisual.co - one of India's first information design studios / Chart maker, information designer and developer, data journo, trainer #dataviz
Information design and data visualization studio focused on the environment, social development, and governance.
Montreal (since 2013).
English and French
Interactives, dashboards, reports, presentations, training
Posts by Francis Gagnon, founder
Columnist and chief data reporter the Financial Times | Stories, stats & scatterplots | john.burn-murdoch@ft.com
— On 👨👶 leave until July —
📝 ft.com/jbm
Creator of 📰 News feeds, @xblock.aendra.dev, @moji.blue, founder of @shoots.green, co-organiser @atproto.london.
Opinions my own and usually terrible.
she/her/ze/hir 🏳️⚧️
🌐 aendra.com
💻 github.com/aendra-rininsland
🗞️ ft.com/æ
The FT’s team of reporters, statisticians, illustrators, cartographers, designers, and developers work with colleagues across our newsrooms, using graphics and data to find, investigate and explain stories.
https://www.ft.com/visual-and-data-journalism
Digital humanities, data science, AI, eating, professor of Quantitative Theory & Methods and English at Emory. Coauthor #DataFeminism w/ @kanarinka, PI #AIAInetwork.
Math, hockey, viz, apocrypha
Assoc Prof Computer Science and Communication Studies at Northwestern. Infovis, HCI. Author of tidybayes & ggdist R pkgs. he/him. 🏳️🌈 https://mjskay.com/
Co-director https://mucollective.northwestern.edu
Co-founder https://journalovi.org
Writing about tech, power, data visualization, social media, disability. Assistant prof of computational media @ MIT. 🇹🇼
crystaljjlee.com
Designer, journalist, and professor.
Author of 'The Art of Insight' (2023) 'How Charts Lie' (2019), 'The Truthful Art' (2016), and 'The Functional Art' (2012). NEW PROJECT: https://openvisualizationacademy.org/
Visual perception and cognition scientist
(he/him)
My site: http://steveharoz.com
R guide: https://r-guide.steveharoz.com
StatCheck Simple: http://statcheck.steveharoz.com
Into creative ML/AI, NLP, data science and digital humanities, narrative, infovis, games, sf & f. Consultant, ds in Residence at Google Arts & Culture. (Lyon, FR) Newsletter arnicas.substack.com.
— Founder of Our World in Data
— Professor at the University of Oxford
Data to understand global problems and research to make progress against them.
Climate scientist, geologist, and catastrophe modeler, Liberty Mutual. Posts on all things hurricane, wildfire, flood, earthquake, tornado. Sassy takes are mine not employer's.
📍Oakland, CA
Website: hereidk.strikingly.com
Media relations manager, RPI. Formerly: Minnesota Reformer, Washington Post, Brookings, Pew. Orange cat evangelist.
Graphics editor at Scientific American • Author of Building Science Graphics https://www.buildingsciencegraphics.com/ • Formerly at National Geographic
Axios managing editor for data viz, previously at Pew Research
My favorite things are quilts, birds, books and maps
Solopreneur @ IndieVisual
Data geek who loves problem solving
Rambles about fitness & random stuff too
https://indievisual.tech
🧙♂️✨📊
Independent Data Visualization Designer, Consultant & Instructor | available for projects and workshops
All things data & design with #rstats, #ggplot2, #Figma, #DataWrapper, #Flourish, and more
Co-Founder of the #30DayChartChallenge