Hey #stats and #methods people!
I will be teaching #psych MA students statistical modelling this year.
I'm looking for podcast *episode* recommendations 🎧
Give me your best!
(See list of topics I will be introducing below:)
06.08.2025 06:44 — 👍 5 🔁 4 💬 2 📌 0
I was going to write a blog post about this, but I don't think there is enough material to justify this.
I've used the term "Science Support Staff" pejoratively to refer to applied statistics and data science. Obviously, we need science support staff, but the role can grind one down easily.
05.08.2025 03:07 — 👍 24 🔁 1 💬 4 📌 0
the viz *suggested by OWID ‒ sorry for the typo
04.08.2025 13:14 — 👍 0 🔁 0 💬 0 📌 0
I find that a before-after slopegraph would probably have been a better visualization for these data (see Tufte www.edwardtufte.com/notebook/slo...). With the viz suggest by OWID, I have to go back and forth to understand how the ranking changes, while this is quicker to see with a slopegraph.
04.08.2025 13:12 — 👍 1 🔁 1 💬 2 📌 0
On notera par contre qu'il n'y aucun démenti sur le fait de frapper les murs gratuitement. Plus sérieusement, bon rétablissement, c'est dans ces moments-là qu'on se rend compte de l'utilité des pouces dans la vie quotidienne !
04.08.2025 10:17 — 👍 1 🔁 0 💬 0 📌 0
Anyone switched from #RStudio to #Positron for teaching? I'm moving to #Positron in my own usage and wondering if I should switch for my Data Analysis class. We only code in #RStats, but maybe #Positron is a long-term better tool for students to learn? Appreciate any thoughts/pointers to materials.
01.08.2025 12:22 — 👍 2 🔁 2 💬 3 📌 0
In any case, I think it's important to make them aware that there are alternatives to the specific tool you are using in your teaching. Let's not make people too dependent on one organization or company, this is not good for anyone long term.
01.08.2025 13:27 — 👍 0 🔁 0 💬 0 📌 0
Any tool can become obsolete or undesirable at some point, for a variety of reasons. I think tools should be taught as much as possible in an agnostic manner, i.e. here making students able to switch without too much complications to an IDE different from the one they were taught initially.
01.08.2025 13:23 — 👍 0 🔁 0 💬 1 📌 0
Small multiple - Wikipedia
Using a small multiple of choropleth maps showing percentages may be useful to avoid resorting to pie charts, which may be hard to read and interpret (e.g. on this specific map, small proportions may be hard to spot in areas with small circles) en.wikipedia.org/wiki/Small_multiple
30.07.2025 08:09 — 👍 1 🔁 0 💬 0 📌 0

How flawed data is leaving the UK in the dark
Trouble at the Office for National Statistics means policymakers cannot rely on key economic numbers, including on employment
Big piece on how the UK is not getting the data it needs and how this is affecting policymaking. A key issue seems to be that the shift from surveys to admin data has not worked well as govt departments have not allowed the ONS access to the data it needs
on.ft.com/3WSCN6h
07.02.2025 07:12 — 👍 227 🔁 95 💬 15 📌 15
Ah, I see the problem, hard to solve.
28.07.2025 14:07 — 👍 2 🔁 0 💬 0 📌 0
My first impulse was to interpret colors as showing the degree of agreement, when it actually informs about geographic categories. Not intuitive at all.
28.07.2025 14:03 — 👍 0 🔁 0 💬 0 📌 0
Quite an odd choice of not using a map for this visualization.
28.07.2025 14:00 — 👍 0 🔁 0 💬 2 📌 0
No, I don't mean that! Really, they organize events targeted at everyone interested in the role of statistics in public issues.
25.07.2025 14:39 — 👍 1 🔁 0 💬 1 📌 0
One of the two authors gives regular paid masterclasses called "Take Control of Your Health with Science-Backed Insights"...
25.07.2025 14:02 — 👍 0 🔁 0 💬 0 📌 0
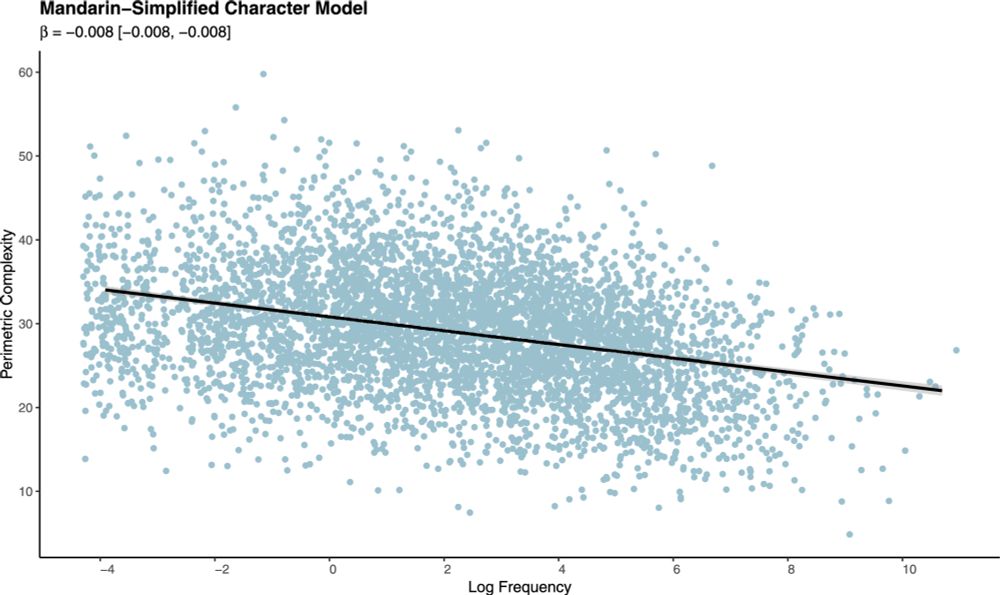
(well, this is passed the first impression that there's no data at all on this graph)
25.07.2025 13:23 — 👍 0 🔁 0 💬 1 📌 0
And are we supposed to compare the four graphs? I don't see how, as on the last graph, the scale of the vertical axis is multiplied by 10 compared to the others -e.g. it may hide some important variations compared to the three other graphs.
25.07.2025 13:07 — 👍 1 🔁 0 💬 1 📌 0
De rien. Je me souviens que j'avais été tout aussi perplexe face à leurs données ouvertes sur le nombre d'inscriptions (où ils utilisent le même système où une ligne = plusieurs personnes). Ça m'avait pris un petit moment d'exploration de leur documentation pour comprendre d'où venait le problème.
25.07.2025 12:59 — 👍 1 🔁 0 💬 1 📌 0
Ce qui est affiché sur la page web du ministère sous la colonne "filtres" n'est pas le nombre de diplômes, mais le nombre de lignes dans le fichier xlsx ou csv. Or, chaque ligne du fichier représente plusieurs délivrances de diplômes (et non une seule), donc le chiffre est bien plus grand que 90000.
25.07.2025 12:50 — 👍 1 🔁 0 💬 1 📌 0
The French Statistical Society regularly organizes events targeted at laypeople, to make stats more accessible. I guess there are similar things in other countries.
25.07.2025 09:29 — 👍 0 🔁 0 💬 1 📌 0
This is vital in democracies, it's impossible to take informed political decisions otherwise.
25.07.2025 09:26 — 👍 1 🔁 0 💬 1 📌 0
Another drawback is its slowness with heavy computation. I stumbled upon the issue when trying to solve a triple integral numerically for computing Bayesian assurance. I didn't try with R yet, but I suspect the problem will be the same and that I'll have to turn to a lower-level language eventually.
25.07.2025 08:51 — 👍 1 🔁 0 💬 0 📌 0
Attention d'ailleurs, il y a une autre colonne intitulée "Nombre de diplômes délivrés", qui donne un nombre moins important (592.332 pour 2021-2022). La différence entre ces deux chiffres vient des "diplômes intermédiaires" délivrés (225.601).
25.07.2025 08:34 — 👍 1 🔁 0 💬 1 📌 0
C'était pour quelle(s) année(s) ? De mon côté, avec un calcul rapide dans Excel, je trouve 817.933 diplômes délivrés au total pour l'année universitaire 2021-2022 (somme faite sur la colonne "Nombre total de diplômes délivrés").
25.07.2025 08:25 — 👍 1 🔁 0 💬 1 📌 0
Souvent dans les données ouvertes du ministère, chaque ligne ne représente pas une observation ou un individu, mais plusieurs. Je ne sais pas si c'est l'origine du problème ici, mais si c'est le cas, il faut faire le calcul sur une colonne qui devrait s'appeler "total" ou "Nombre de diplômes".
25.07.2025 08:18 — 👍 1 🔁 0 💬 0 📌 0
je n'avais pas vu la discussion que ça avait généré ici bsky.app/profile/pecq... , ça répond à ma question.
24.07.2025 12:29 — 👍 2 🔁 0 💬 0 📌 0
Economist and Data Scientist | https://restateinsight.com/blog
Research and data to make progress against the world’s largest problems. Based out of Oxford University (@ox.ac.uk), founded by @maxroser.bsky.social.
With more than 300 employees at two locations - Mannheim and Cologne - GESIS provides essential and internationally relevant research-based services for the social sciences.
https://www.gesis.org
🧙♂️✨📊
Independent Data Visualization Designer, Consultant & Instructor | available for projects and workshops
All things data & design with #rstats, #ggplot2, #Figma, #DataWrapper, #Flourish, and more
Co-Founder of the #30DayChartChallenge
❤️📊 🗣️DE|EN|FR #RStats | #EconSky | #NAFO ❌crypto|nft|ai|antivaxx|bots
Socio-anthropologie, & le reste...
Pragmatisme / Poésie / Orchidées: de quoi remplir tout un mondeS
Centre Max Weber - Équipe "Politiques de la Connaissance"
SUD - Recherche @solidaires.org
@revue-traces.bsky.social
Doctoral Researcher @isnlab.bsky.social | part of Max Planck School of Cognition | previously @MPI_CBS, @MPI_NL & @univienna
https://cognition.maxplanckschools.org/en/doctoral-candidates/ole-goltermann
Trialist; Methodologist; Statistician; Professor of Health Services Research; University of Aberdeen. Views my own. Hebridean.
https://www.abdn.ac.uk/people/m.k.campbell
Research lab at @ucddublin School of Psychology partnering with @qubelfastofficial School of Psychology & Developing Belief Network || Children. Empathy. Prosocial. Peacebuilding || PI @lauraktaylorphd.bsky.social
https://helpingkidslab.com/
International Relations Theory & History. Junior Research Fellow at Brasenose College, University of Oxford. Oxford Martin Fellow, Changing Global Orders.
www.janeijking.com
Ex-historian. IT guy. Mostly at @Raveline@piaille. Also on https://radiopaper.com/Raveline.
Veille et recherche sur les politiques publiques de l'éducation, de l'enseignement supérieur et de la recherche
#ESR #DataESR #VeilleESR
Maître de conférences à l'Université de Strasbourg, laboratoire SAGE.
Membre de la CPESR.
I am a psycholinguist who studies literacy at KIMEP University. I also share R and methods tips. I offer a free course on R programming at Quantfish here:
https://www.goquantfish.com/courses/gentle-intro-to-R
Founded in 1949, International Sociological Association represents sociologists everywhere, regardless of their school of thought, scientific approaches or ideological opinion. Get to know us better at www.isa-sociology.org
INGENIO (CSIC-UPV) and UNESCO Chair on Diversity and Inclusion in Global Science @CWTS Leiden Univ, working on evaluation, research priorities and funding inequalities. https://www.cwts.nl/people/Ismael-rafols
RoRI’s mission is to accelerate transformational research on research systems, cultures & decision-making.
Professor at Uni Bern
Meta Science ⸾ Research Methods ⸾ IT Security & Privacy ⸾ Problem Solving ⸾ Media Effects.
https://the100.ci & @error.reviews
Whoa, everything's computer!
Open science, estimation statistics, and random thoughts from Bob Calin-Jageman and Geoff Cumming. https://thenewstatistics.com/itns/
www.anirudhtagat.com
Research Author, Dept of Economics, Monk Prayogshala. Research in behavioural and development economics in India. Teach econ at NMIMS and Meghnad Desai Academy of Economics, Mumbai, India. PhD Econ IITB/Monash | MSc Econ Warwick