This looks fascinating, congratulations!
14.07.2025 08:13 — 👍 0 🔁 0 💬 0 📌 0
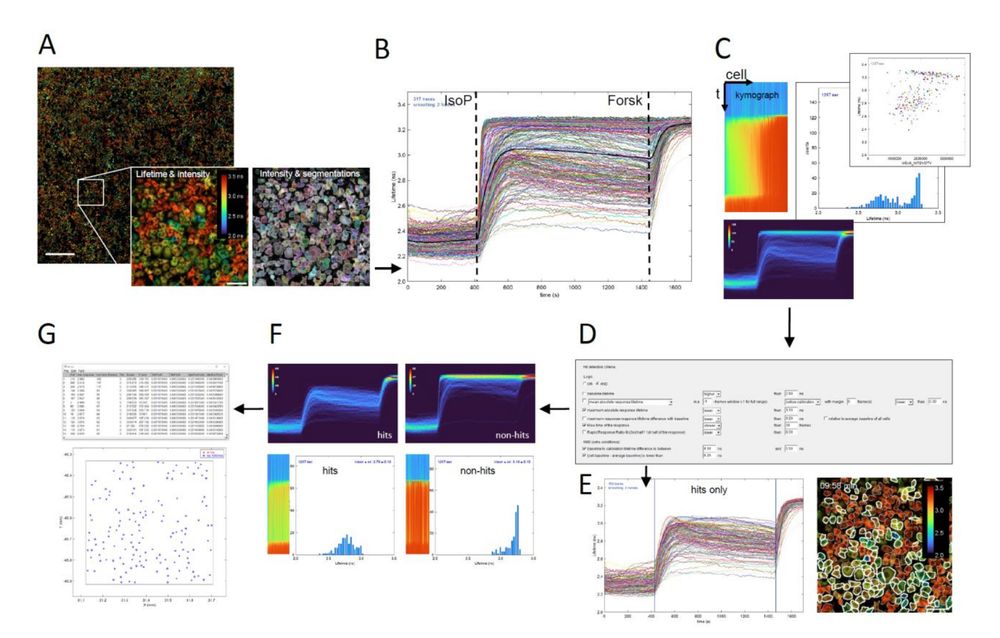
Fig. 4. Time-lapse FLIM analysis and hit detection Fiji macro. (A) Stitched multi-tile intensity image
overlay with the fluorescence lifetime image. The lifetime image can be either average photon arrival times
(‘Fast FLIM’) or calculated average lifetimes from two lifetime components. Ratiometric images can also
be used. Scale bar: 1000 μm. Inset: Left – Zoom-in of lifetime image of cells after stimulation with
isoproterenol; Right – Zoom-in showing cell segmentation as outlines. Scale bar: 100 μm. (B) Lifetime time
traces of all 298 segmented cells in a single tile of Cos7 cells (a mix of ADRB2 KO and WT cells). Cells are
stimulated with 40 nM isoproterenol (IsoP), followed by a calibration with forskolin (Forsk). Stimulation
and calibration time points may be automatically calculated from the average of all traces (thick black
line) or entered manually. (C) The script generates several informative visualizations. Shown are a
‘kymograph’ representation of fluorescence lifetime vs time in all cells, sorted on response magnitude (top-
left); a normalized data density graph (2D histogram of lifetime vs time, with cell counts in false color),
convenient when analysing thousands of cells (bottom); and (optionally animated) histograms of the
fluorescence lifetimes over time (middle) and scatterplots of lifetime vs secondary parameters like cell
intensity, cell area or intensity of an additional fluorescence channel of choice (top-right). (D) Hit selection
dialog showing various optional criteria. These can be used separately or combined, allowing to screen for
a large variety of dynamic phenotypes. (E) Based on the criteria, hit cells are determined and visualized
through a ‘hits only’ lifetime traces plot (left). Blue vertical lines indicate the chosen hit detection time
window. The hit cells are outlined with white lines on the lifetime-intensity overlay image (right). (F)
Additional visualizations of hit cells (left) and non-hit cells (right), in density graphs, resp…
Beyond Static Screens: A High-Throughput Pooled Imaging CRISPR Platform for Dynamic Phenotype Discovery by Kees Jalink and team: www.biorxiv.org/content/10.1...
14.07.2025 07:35 — 👍 15 🔁 3 💬 2 📌 0
Hi everyone! I’m new to Bluesky. At the beginning of the year, I moved to Zurich @UZH_en to start a postdoc with #CyrilZipfel and @pedrobeltrao.bsky.social, investigating protein phosphorylation in plants 🌱
If you’re nearby or working on something similar, let’s connect 😀
01.06.2025 21:24 — 👍 117 🔁 26 💬 6 📌 0
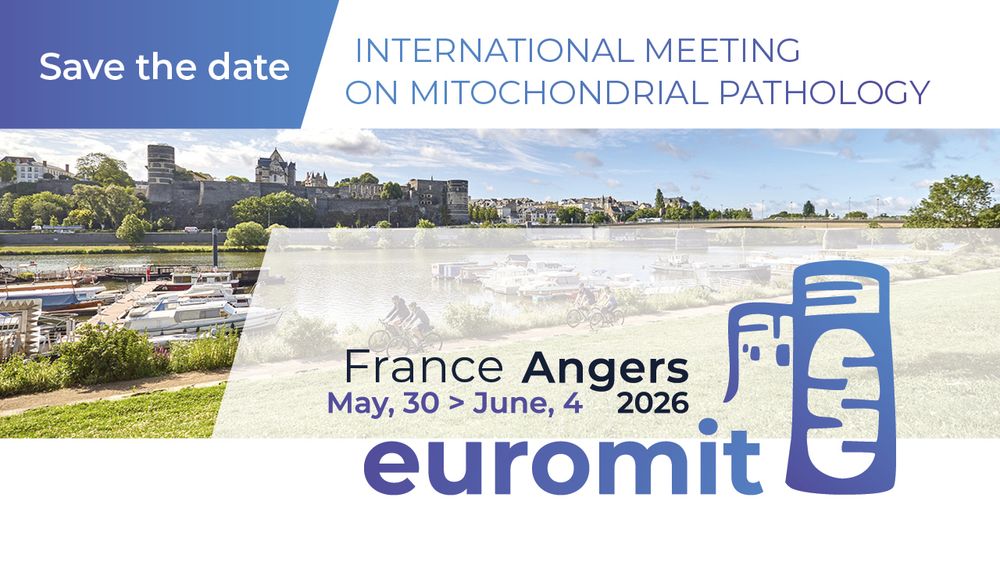
🌍Euromit 2026 is coming to Angers!🌍
✨The international congress dedicated to mitochondrial research, will take place in France, at the Centre des Congrès of Angers. from May 31 to June 4, 2026! ✨
📢 Stay informed by following this page and get ready for an exceptional scientific experience! 🚀🔬
03.02.2025 08:46 — 👍 16 🔁 7 💬 0 📌 0
Very cool work from the @katajistolab.bsky.social ! Congratulations to the team!
29.04.2025 06:50 — 👍 6 🔁 1 💬 1 📌 0
X’s dominance ‘over’ as Bluesky becomes new hub for research
Data indicates more scholars turning to alternative social media site to post about their work after Elon Musk’s Twitter takeover
Bluesky has overtaken its flailing rival X in hosting posts related to new academic research, indicating the platform is fast becoming the go-to place for scholars to share their work
#AcademicSky #EduSky
09.04.2025 09:29 — 👍 947 🔁 308 💬 7 📌 29
Join us at the ICSB in Dublin this October - I will chair the session on aging systems biology
icsb2025.com
24.02.2025 09:36 — 👍 6 🔁 3 💬 0 📌 0
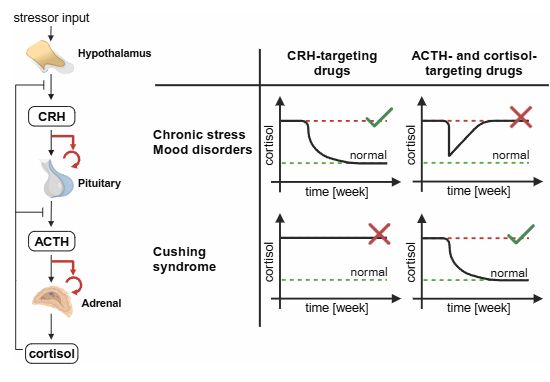
Why do cortisol-lowering drugs work for Cushing’s but fail in mood disorders & chronic stress?
We propose that the ability of the pituitary and adrenal glands to adjust their functional masses—normally beneficial—counteracts the drug’s effect. Using a math. model, we screened HPA interventions (1/2)
04.02.2025 15:53 — 👍 7 🔁 2 💬 1 📌 1
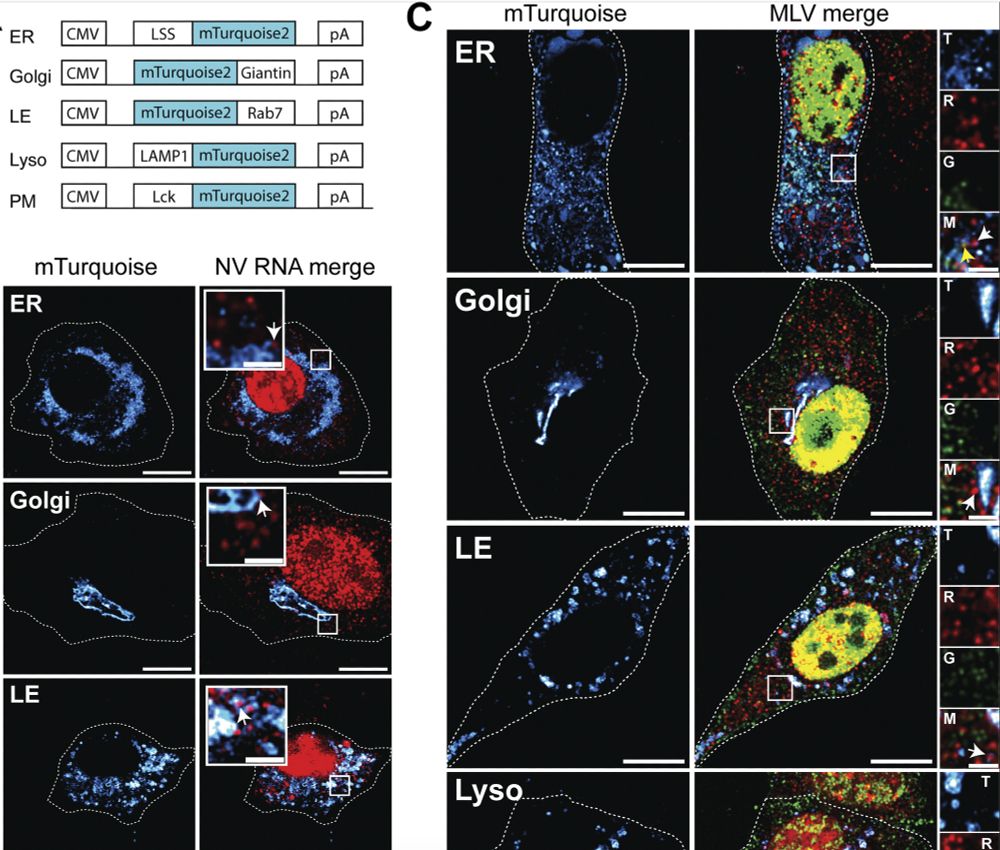
Subcellular localization of non-translating (free) RNAs and translation sites. (A) Schematic maps of the mTurquoise markers used to label different subcellular sites. (B) Representative images of the NIH3T3 GFP/RFP cells co-transfected with NV-MS2 and one of each mTurquoise plasmid labeling ER, Golgi, LE, Lyso, and PM. Images were acquired on an LSM980 confocal microscope. RNA is in red and subcellular locations in hot cyan. Single z-planes are presented, and scale bars are 10 and 2 µm for zoom insets. White arrows indicate NV RNA associated with the turquoise surfaces. (C) Representative images of cells co-expressing ΔNC and one of each mTurquoise plasmid. Translating and non-translating FL RNAs associated with the subcellular surfaces (hot cyan) are indicated by yellow and white arrows, respectively. Single z-planes are presented, and scale bars are 10 and 2 µm for zoom insets. In zoom insets, the letters T, R, G, and M denote turquoise, red, green, and merge, respectively.
Great to see the mTurquoise2 plasmids that we've generated used as markers of subcellular structures
rupress.org/jcb/article/...
30.01.2025 09:41 — 👍 47 🔁 8 💬 1 📌 0
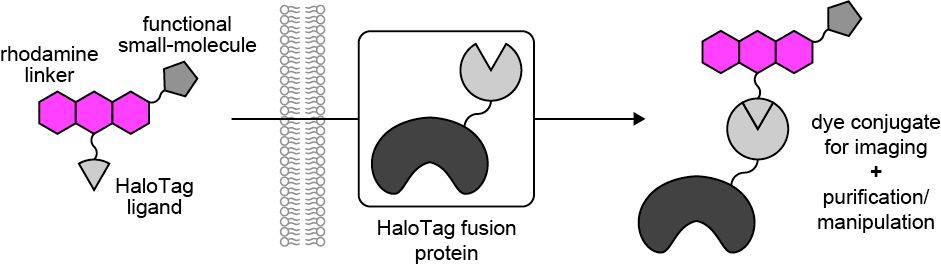
🧵Prepint alert! Optimizing Multifunctional Fluorescent Ligands for Intracellular Labeling | tinyurl.com/3n55hvsc. With Jason Vevea, Ed Chapman, and @so-lets-kilab70.bsky.social, we combined dye chemistry, HaloTag, microscopy and cell biology to make protein purification and manipulation tools.
28.01.2025 05:17 — 👍 65 🔁 25 💬 2 📌 2
Mito-friends:
What conferences are we attending this year?
I ask because there are no mito/cyto symposia at my usual conferences, and it would be great to catch up!
🔬🧪
28.01.2025 10:25 — 👍 3 🔁 1 💬 0 📌 0
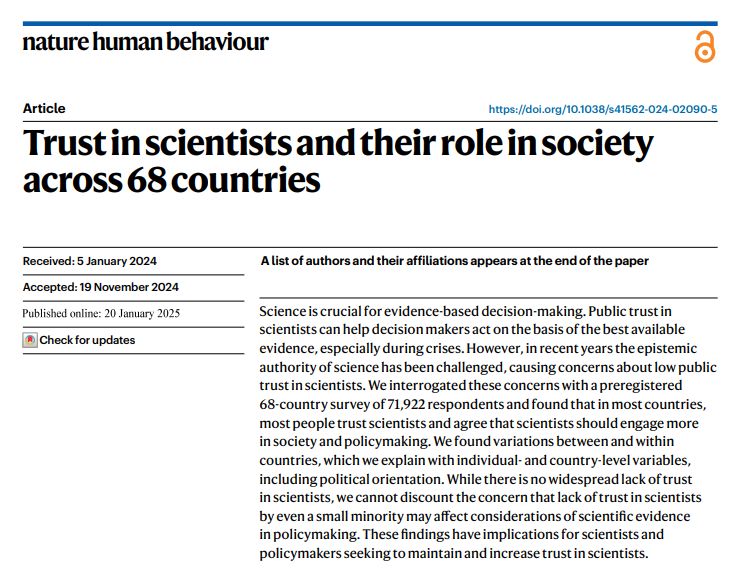
Our global study on the state of trust in scientists is now out in Nature Human Behaviour! 🥳
With a team of 241 researchers, we surveyed 71,922 people in 68 countries, providing the largest dataset on trust in scientists post-pandemic 👇🧵https://www.nature.com/articles/s41562-024-02090-5
20.01.2025 10:16 — 👍 911 🔁 386 💬 25 📌 52
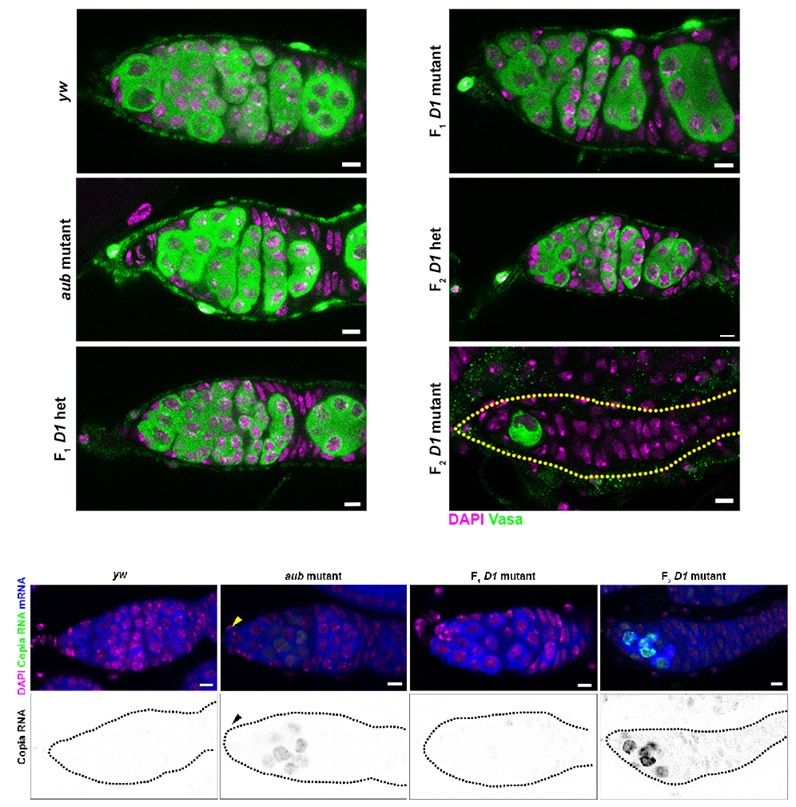
Loss of D1 during embryogenesis triggers transposon expression in adult ovaries. Top: Ovaries from the indicated genotypes (D1 and aubergine mutants and heterozygotes, F1 and F2) were stained with Vasa (green) and DAPI (magenta). Bottom: RNA in situ hybridization against Copia (green) and total polyadenylated mRNA (blue) was performed in ovaries of the indicated genotypes that were also stained for DAPI (magenta). Yellow and black arrowheads indicate undifferentiated germ cells in the aubergine mutant germarium.
Pericentromeric #heterochromatin clusters into chromocenters. @skrutlnize.bsky.social &co use quantitative mass spec to characterize the chromocenter proteome in multiple tissues, identifying a link between satellite DNA-binding proteins & #transposon repression🧪 @plosbiology.org plos.io/4akuNAi
16.01.2025 13:13 — 👍 14 🔁 10 💬 1 📌 0
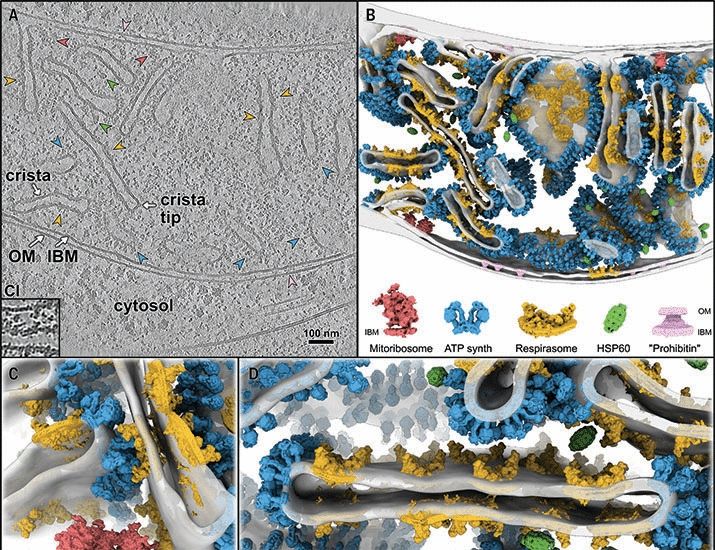
FLIM imaging reveals IMM lipid heterogeneity in live cells.
Find out more about this exciting tool: onlinelibrary.wiley.com/doi/10.1002/...
09.01.2025 16:19 — 👍 3 🔁 0 💬 0 📌 0
Congratulations on that cool story! I like the short descriptive titles in your figures.
07.01.2025 16:58 — 👍 1 🔁 0 💬 1 📌 0
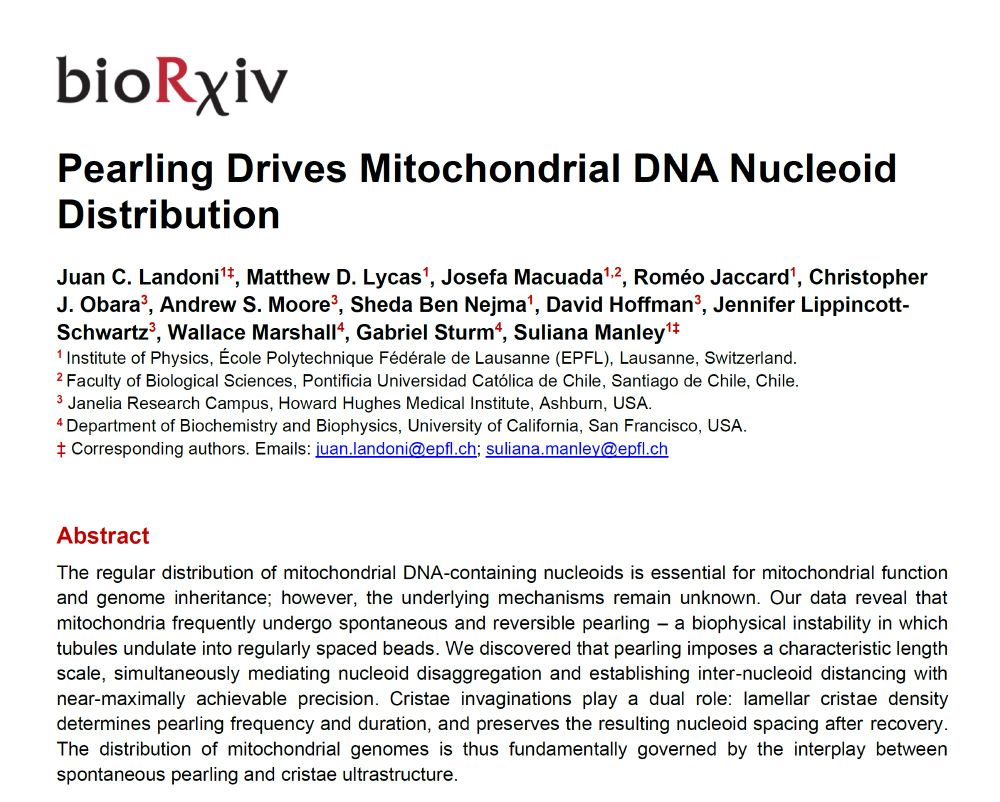
Stoked to share TWO preprints on mitochondrial pearling! 🎉
We uncover how spontaneous #mitochondria pearling drives #mtDNA nucleoid distribution (doi.org/10.1101/2024...), and
@gavsturm.bsky.social
et al. dissect the biophysics behind it (doi.org/10.1101/2024...). Details below! 🔬🧵🧪
23.12.2024 16:37 — 👍 110 🔁 42 💬 6 📌 5
This is fascinating, congratulations!
07.01.2025 16:24 — 👍 0 🔁 0 💬 0 📌 0
2x Preprint drop!!! Mitochondrial pearling has arrived!
“The Biophysical Mechanism of Mitochondrial Pearling”.
“Pearling Drives Mitochondrial DNA Nucleoid Distribution” 1/10
www.biorxiv.org/content/10.1...
www.biorxiv.org/content/10.1...
23.12.2024 16:58 — 👍 81 🔁 35 💬 3 📌 4
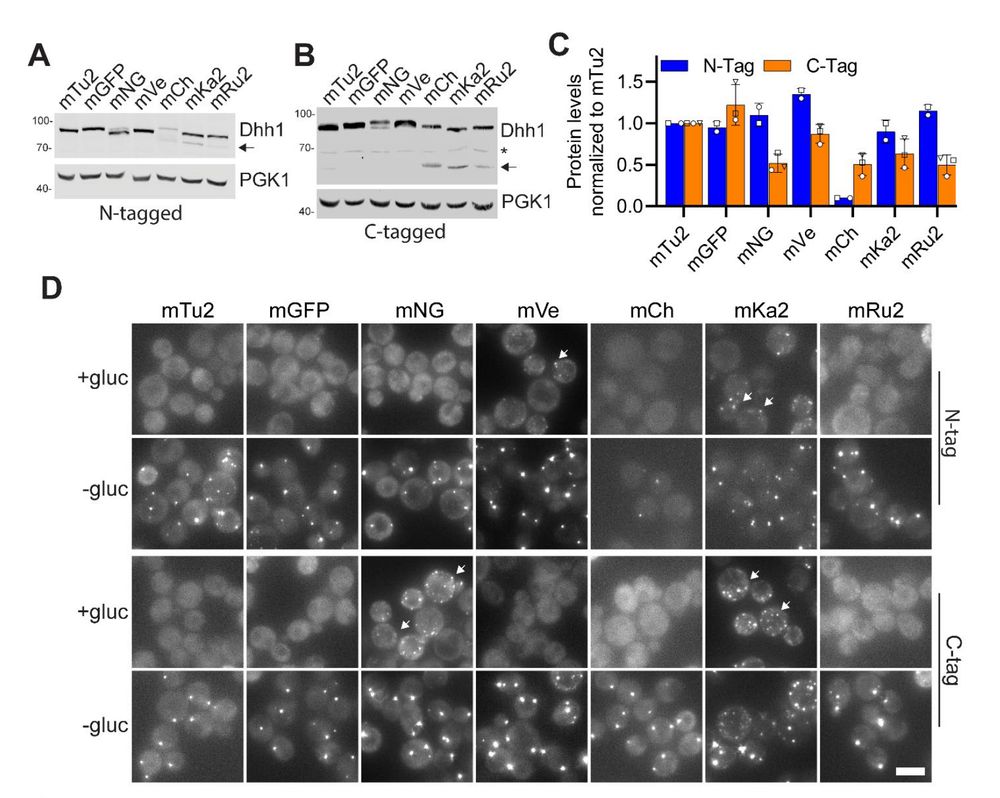
Figure 4. Position and type of fluorescent tag affect protein expression and P-body numbers in vivo.
The dark side of fluorescent protein tagging: the impact of protein tags on biomolecular condensation
www.biorxiv.org/content/10.1...
25.11.2024 12:19 — 👍 306 🔁 119 💬 10 📌 7
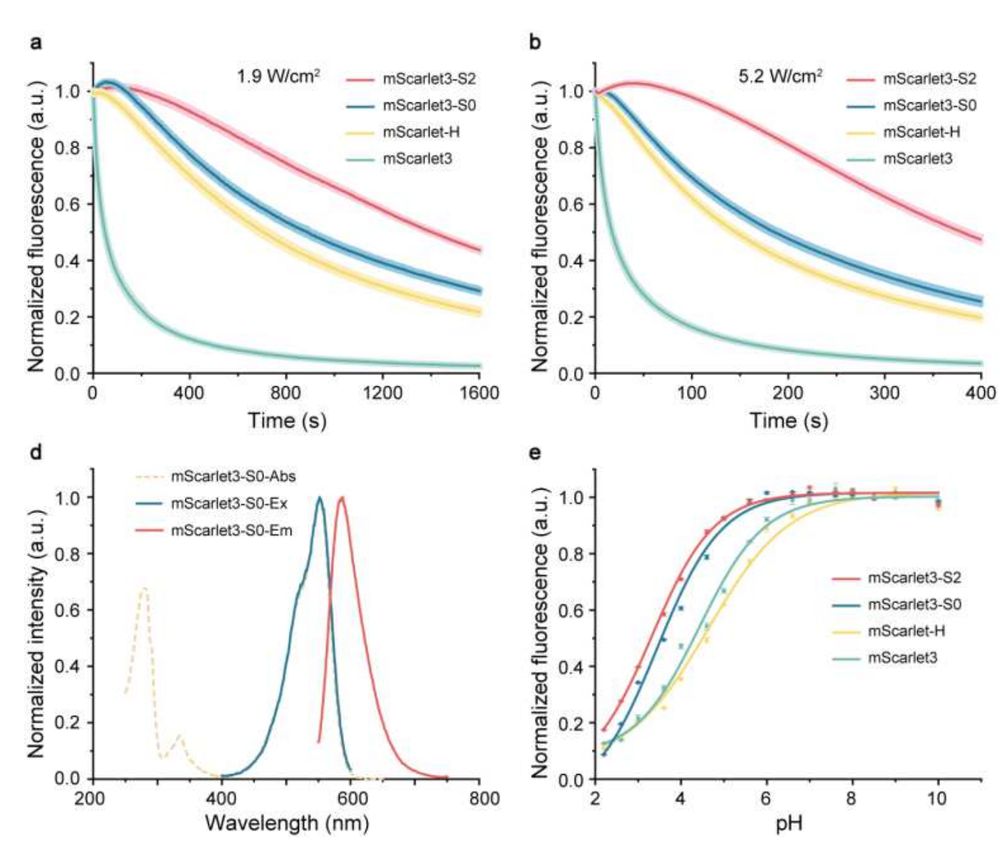
Fig. 1 Photostable and fluorescence properties of mScarlet3-S2. a, b, Photostability of red emitting mScarlet variants expressed in live U-2 OS cells under continuous WF illumination at 1.9 W/cm2
A highly photostable monomeric red fluorescent protein
www.researchsquare.com/article/rs-5...
06.01.2025 09:03 — 👍 44 🔁 15 💬 2 📌 0
Vimentin-mSG FRAP
17.12.2024 05:58 — 👍 80 🔁 11 💬 2 📌 1

Struggling with proof-reading? A reminder that MS Word can read your document back to you via the 'read aloud' funciton found in the 'review' tab. An absolute game changer!
17.12.2024 12:09 — 👍 7 🔁 2 💬 1 📌 0
Hi 👋 I'm a postdoc in the #Neuroimmunology and #Imaging group at the @dzne.science Bonn 🧪🔬 Passionate about #ComputationalNeuroscience 🧠💻 and #NeuralModeling 🧮
🌍 fabriziomusacchio.com
👨💻 github.com/FabrizioMusacchio
🐘 sigmoid.social/@pixeltracker
Plant scientist 🌱🦠🧫 🇲🇽 | Postdoc at the University of Zurich in the Cyril Zipfel and Pedro Beltrao groups, studying protein phosphorylation during plant–microbe interactions #EMBOfellow | @thesainsburylab.bsky.social alumni
Welcome to the official Bluesky page Euromit 2026 ! For more info, contact us by e-mail : euromit2026@univ-angers.fr
Cell biologist, metabolism enthusiast, incoming anesthesiologist at UCSF | Tri-I MD-PhD in NYC
PhD student fascinated by all things E. coli 🧫🦠 Prof. Uri Alon's lab, Weizmann Institute of Science
The Alon lab explores design principles of biological circuits, focusing on systems medicine, aging, and healthspan.
PostDoc | Single Molecule Localization Microscopy | Budding Yeast | Membranes
Interested in:
Life.
Science.
And, A Career in Life Sciences.
Exploring the world of 'hidden dimensions' ( #colloids & #interfaces ) and bridging the gap between #molecules, #MultiScaleMaterials, and #BioSystems. In Potsdam, #Germany.
https://www.mpikg.mpg.de/departments
#chemsky #Forschung #Research
Leibniz-Institut für Pflanzengenetik und Kulturpflanzenforschung (IPK) Gatersleben
Leibniz-Institute of Plant Genetics and Crop Plant Reseach
Federal ex-situ Genebank of Germany
https://www.ipk-gatersleben.de/impressum
Das Leibniz-Institut DSMZ – Deutsche Sammlung von Mikroorganismen und Zellkulturen GmbH ist die global vielfältigste Sammlung für biologische Ressourcen. An der DSMZ werden Mikroorganismen & Zellkulturen gesammelt, erforscht und archiviert
Europe's leading bioresource center
research infrastructure
supplier of bioresources and scientific analyses
home of the DSMZ Digital Diversity Platform
www.dsmz.de
Das Leibniz-Institut für Psychology (ZPID) ist die zentrale, überregionale Infrastruktureinrichtung für die Psychologie in den deutschsprachigen Ländern. | The ZPID is the supra-regional research support facility for psycholgy in German-speaking countries.
#LeibnizIOS Regensburg • Research institute in Germany – Creating, preserving, and communicating knowledge on Eastern and Southeast Europe • Posts in English and German • https://leibniz-ios.de/
Legal note: https://leibniz-ios.de/impressum
📷: Klaus Kurz
Leibniz Biodiversität = interdisziplinäre Biodiversitätsexpertise von 19 Leibniz-Instituten // Leibniz Biodiversity = interdisciplinary biodiversity expertise from 19 German Leibniz institutes
Leibniz Centre for Agricultural Landscape Research (ZALF)
Die Printausgabe des FELD-Magazins kostenlos abonnieren: www.zalf.de/feld
Impressum: https://t1p.de/3ykz1
#landscape #agriculture #agrifood #research
Leibniz Research Alliance "Value of the Past"
Website: https://www.leibniz-wert-der-vergangenheit.de
Blog: https://valuepast.hypotheses.org
The Leibniz Institute for Educational Media conducts research on educational media, provides research infrastructures, and performs transfer services from a critical research perspective for national and international educational practice and policy (a.o.)
As the only "marine" institute within the Max Planck Society, we do basic research in order to better understand microbial life in the oceans and its impacts the environment.
This is the Tübingen research campus of the Max Planck Society in Germany. We do basic research in fields of biology, neuroscience, and AI.
For Institute specific updates follow:
@mpicybernetics.bsky.social
@mpi-bio-fml.bsky.social