Predicting Employee Turnover with Random Forest
                In the world of human resources, understanding why employees leave can be the key to building a more resilient and engaged workforce. Theโฆ


            What really drives people to leave their jobs? In our latest exploration, we dive into the Employee Turnover.
medium.com/@statstostor...
#DataScience #MachineLearning #ExplainableAI #PeopleAnalytics #EmployeeRetention #EmployeeTurnover#HRAnalytics 
#DataStorytelling #AIForGood#HumanCenteredAI


                25.07.2025 12:49 โ ๐ 1    ๐ 0    ๐ฌ 0    ๐ 0                      


            Our new story is live! Not all sustainable fashion claims hold up under the surface.
#DataScience #DataAnalytics #dataVisualization #Rstars #ggplot2 #StoryTellingwithData #Statistics #StatsToStories #Fashion


                28.05.2025 10:37 โ ๐ 0    ๐ 0    ๐ฌ 0    ๐ 0                      


            Still exploring the MDb's Top 1000 Movies. Let's look behind the numbers.
medium.com/@statstostor...
#DataScience #DataAnalytics #DataVisualization #Rstats #ggplot #StorytellingWithData #StatsToStories #IMDb


                16.05.2025 11:00 โ ๐ 0    ๐ 0    ๐ฌ 0    ๐ 0                      


            #DataScience #DataAnalytics #StorytellingWithData #StatsToStories #IMDb


                09.05.2025 10:23 โ ๐ 0    ๐ 0    ๐ฌ 0    ๐ 0                      


                What IMDb Ratings Really Tell Us: A Data-Driven Story
                In the age of online ratings and infinite content choices, platforms like IMDb shape what we watchโโโand how we feel about it. But what doโฆ


            Exploring #data has become a creative way to make sense of the world around usโespecially when it intersects with topics we already love, like movies and culture. 
In our latest project, we turn to #movies. 
medium.com/@statstostor...
All feedback is welcome. 
More data stories coming soon!


                09.05.2025 10:21 โ ๐ 0    ๐ 1    ๐ฌ 1    ๐ 0                      


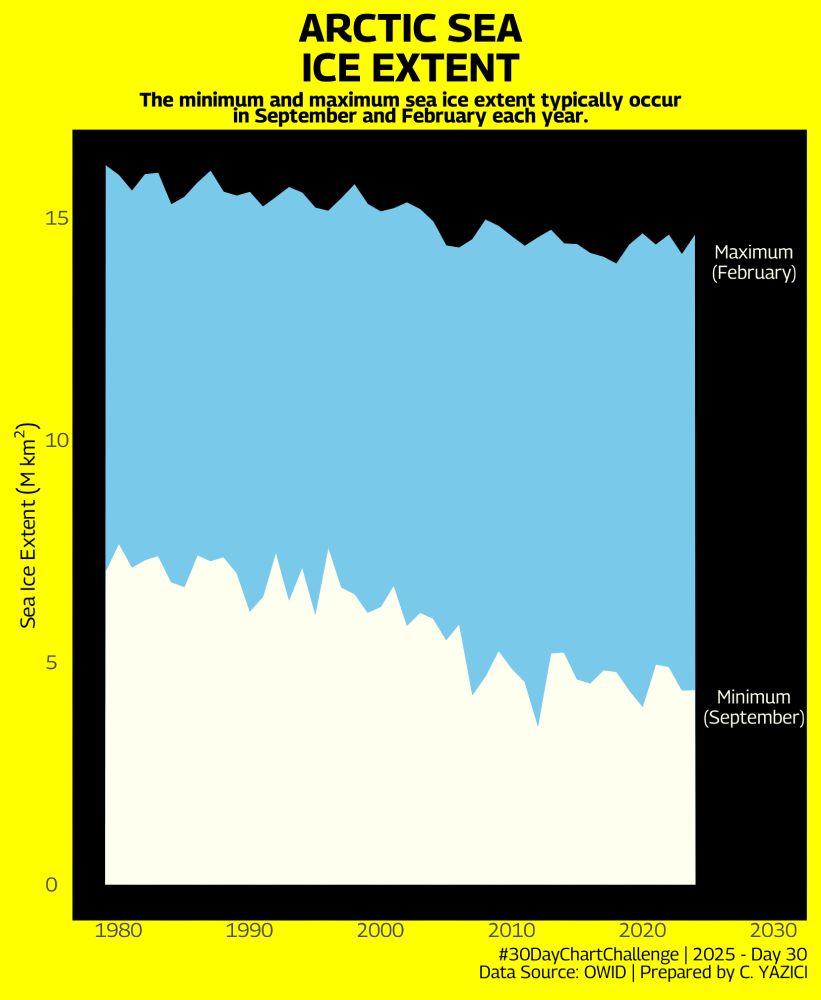
            Another late and last submission to #30DayChartChallenge 
Thanl you for all who organized and contributed this challenge.
#Rstats #ggplot #DataViz
@30daychartchall.bsky.social


                02.05.2025 21:07 โ ๐ 0    ๐ 1    ๐ฌ 0    ๐ 0                      


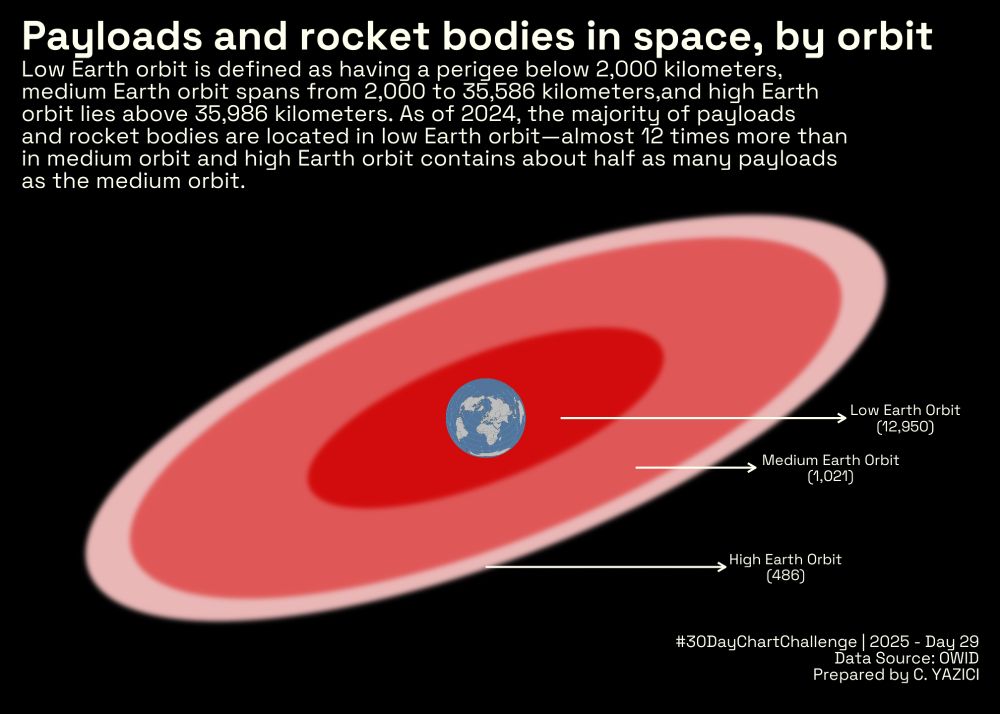
            An experimental submission to #Day29 of #30DayChartChallenge
I studied the payloads and rocket bodies in space, by orbit. 
#ggplot #Rstats #DataViz 
@30daychartchall.bsky.social


                30.04.2025 19:23 โ ๐ 1    ๐ 1    ๐ฌ 0    ๐ 0                      


            #Day28 of #30DayChartChallenge with the prompt #inclusion
I studied the #ratings of #chocolates which include salt as the #ingredient
#DataViz #ggplot #Rstats 
@30daychartchall.bsky.social


                30.04.2025 17:45 โ ๐ 0    ๐ 1    ๐ฌ 0    ๐ 0                      


            Prompt of #Day27 of #30DayChartChallenge is #noise
I studied the #coffee bean production in Brazil and Columbia
#Rstats #ggplot #DataViz 
@30daychartchall.bsky.social


                29.04.2025 17:19 โ ๐ 2    ๐ 1    ๐ฌ 0    ๐ 0                      


            #Day26 of #30DayChartChallenge has the prompt #monochrome
I studied the length of characters of animation movies in two time periods. 
#Rstats #ggplot #DataViz 
@30daychartchall.bsky.social


                29.04.2025 12:24 โ ๐ 0    ๐ 2    ๐ฌ 0    ๐ 0                      


            #Day25 of #30DayChartChallenge has the prompt #risk
I studied the death rates from cardiovascular diseases.
#ggplot #DataViz #Rstats 
@30daychartchall.bsky.social


                28.04.2025 19:46 โ ๐ 3    ๐ 1    ๐ฌ 0    ๐ 0                      


            #Day24 of #30DayChartChallenge is a data day. I studied the #maternal #mortality in Turkey.
#DataViz #ggplot #Rstats 
@30daychartchall.bsky.social


                27.04.2025 20:32 โ ๐ 4    ๐ 1    ๐ฌ 0    ๐ 0                      


            #Day23 of #30DayChartChallenge with #logscale 
I used the data of same fossil fuel consumption with a longer time period.
#Rstats #ggplot #DataViz 
@30daychartchall.bsky.social


                26.04.2025 18:58 โ ๐ 1    ๐ 1    ๐ฌ 0    ๐ 0                      


            #Day22 of #30DayChartChallenge with the prompt #stars
I studied the winners of #NBA #All-Stars for the 2000-2017 period.
#DataViz #ggplot #Rstats 
@30daychartchall.bsky.social


                26.04.2025 14:58 โ ๐ 0    ๐ 1    ๐ฌ 0    ๐ 0                      


            #Day21 of #30DayChartChallenge has the prompt of #fossils
I studied the fossil fuel consumption with #ggstream
#Rstats #ggplot #DataViz
@30daychartchall.bsky.social


                25.04.2025 20:51 โ ๐ 1    ๐ 2    ๐ฌ 0    ๐ 0                      


            #Day20 of #30DayChartChallenge with the #urbanization prompt
I studied the population of urban and rural areas in teh last 20 years.
#Rstats #ggplot #DataViz 
@30daychartchall.bsky.social


                24.04.2025 17:48 โ ๐ 4    ๐ 1    ๐ฌ 0    ๐ 0                      


            Late submission for #day19 with the theme #smooth
I visualized the number of deaths from natural disasters in Asia.
#DataViz #ggplot #Rstats #30DayChartChallenge
@30daychartchall.bsky.social


                24.04.2025 14:19 โ ๐ 3    ๐ 1    ๐ฌ 0    ๐ 0                      


            #Day18 of #30DayChartChallenge is a theme day of #ElPais
I replicated the meat supply vs GDP plot of #OWID for regions
#Rstats #ggplot #DataViz
@30daychartchall.bsky.social


                18.04.2025 14:22 โ ๐ 1    ๐ 2    ๐ฌ 0    ๐ 0                      


            I tried and animated version for #Day17 of #30DayChartChallenge to show the ranks of habitats that the birds like.
#Rstats #ggplot #DataViz 
@30daychartchall.bsky.social


                18.04.2025 12:18 โ ๐ 2    ๐ 2    ๐ฌ 0    ๐ 0                      


            #Day16 of #30DayChartChallenge is #negative
I studied the relationship between rainfall and sunshine duration in Ankara, TURKEY. 
#Rstats #DataViz #ggplot @30daychartchall.bsky.social


                17.04.2025 13:10 โ ๐ 5    ๐ 1    ๐ฌ 0    ๐ 0                      


            The #prompt for #Day15 is #complicated
I studied the total points received and given to countries in Eurovision.
#Rstats #ggplot #DataViz
@30daychartchall.bsky.social


                16.04.2025 10:37 โ ๐ 2    ๐ 3    ๐ฌ 0    ๐ 0                      


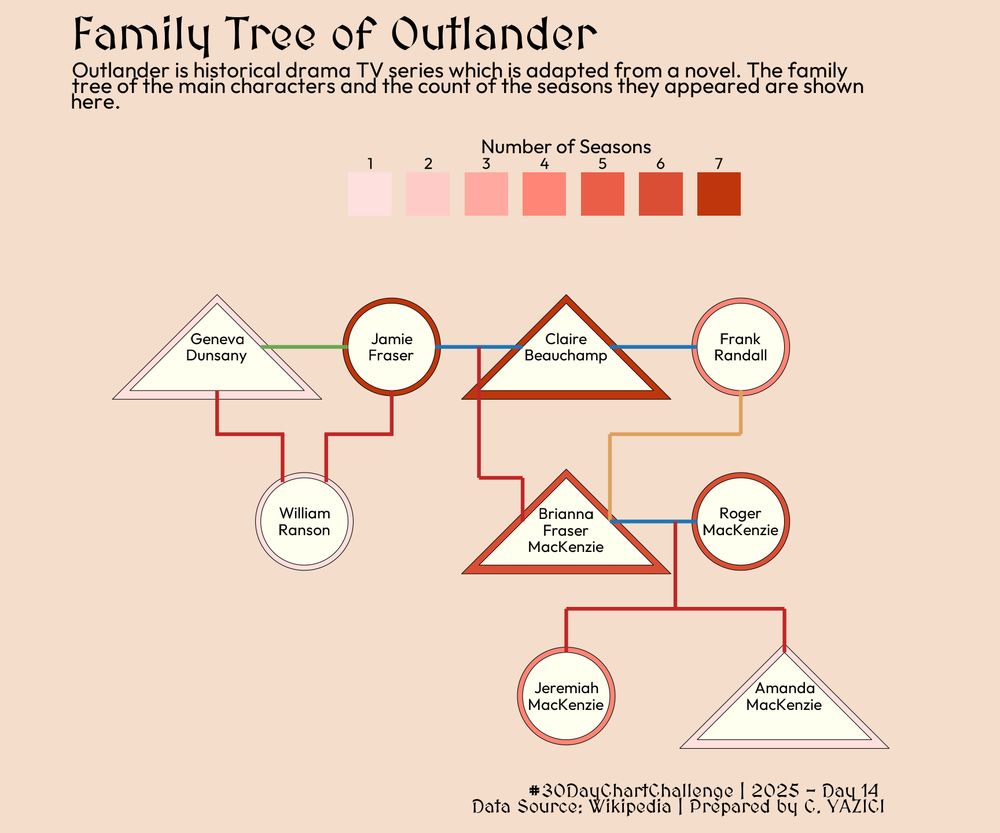
            The #prompt for #day14 of #30DayChartChallenge is #kinship
I studied the basic family tree of #Outlander 
#ggplot #DataViz #Rstats 
@30daychartchall.bsky.social


                15.04.2025 14:56 โ ๐ 2    ๐ 1    ๐ฌ 0    ๐ 0                      


            The prompt for #day13 is #clusters and I again studied the #starbucks data. This time beverages are grouped into three clusters according to their nutritions. 
#Rstats #ggplot #DataViz #30DayChartChallenge 
@30daychartchall.bsky.social


                14.04.2025 14:49 โ ๐ 2    ๐ 1    ๐ฌ 0    ๐ 0                      


             #Day12 of #30DayChartChallenge is data day. I used rounded stacked bar charts to visualize the film permits in boroughs of New York.
#DataViz #Rstats #ggplot 
@30daychartchall.bsky.social


                14.04.2025 13:01 โ ๐ 2    ๐ 1    ๐ฌ 0    ๐ 0                      


            #stripes for #day11 of #30DayChartChallenge 
I used the same data set for precipitation anomalies from #owid
#DataViz #ggplot #Rstats 
@30daychartchall.bsky.social


                11.04.2025 15:34 โ ๐ 3    ๐ 1    ๐ฌ 0    ๐ 0                      


            The prompt for #Day10 of #30DayChartChallenge is multi-modal. I studied the precipitation anomalies.
#Rstats #ggplot #DataViz 
@30daychartchall.bsky.social


                11.04.2025 12:39 โ ๐ 3    ๐ 1    ๐ฌ 0    ๐ 0                      


            I studied the global average temperature for the #diverging prompt of #Day9 of #30DayChartChallenge
#Rstats #ggplot #DataViz 
@30daychartchall.bsky.social


                09.04.2025 18:39 โ ๐ 4    ๐ 1    ๐ฌ 0    ๐ 0                      


            #Day8 #histogram submission for #30DayChartChallenge
The same data set for gross values of Drama Movies is used. 
#Rstats #DataViz #ggplot 
@30daychartchall.bsky.social


                09.04.2025 13:12 โ ๐ 3    ๐ 1    ๐ฌ 1    ๐ 0                      


            A bit experimental boxplot with #ggmagnify. I will work on this later, but here is the submission for #Day7 of #30DayChartChallenge with the prompt of #outliers
#Rstats #DataViz #ggplot 
@30daychartchall.bsky.social


                08.04.2025 12:51 โ ๐ 2    ๐ 1    ๐ฌ 0    ๐ 0                      


                                            Ankara Bรผyรผkลehir Belediye Baลkanฤฑ


                                            she/her
professor at duke university + developer educator at posit
cat videos = instant smiles
https://mine-cr.com
https://fosstodon.org/@minecr


                                            Our mission: To provide tools and resources to foster a diverse, friendly, and inclusive community of data science learners and practitioners. Join us at https://dslc.io


                                            ฤฐstanbul Bรผyรผkลehir Belediye Baลkanฤฑ | Cumhurbaลkanฤฑ Adayฤฑ


                                            CHP ฤฐstanbul ฤฐl Baลkanฤฑ


                                            Social Work Professor | Data Viz & Map Designer | Tableau Visionary & Ambassador | husband/father | perpetual student | he/him/his | no AI used


                                            #python, #rstats, #shiny, #datascience training and consultancy. We help organisations extract the most from their data.


                                            Freelance data visualization designer and #D3js developer based in Mensk, Belarus. Open for hire worldwide #datavis @ yanouski.com


                                            https://peder.quarto.pub/blog
Father x3. Rstats & data visualisation 
Currently studying gut bacterial metabolism in primary sclerosing cholangitis
Norwegian green party ๐ฑ
๐ณ๐ด ๐ฉ๐ช ๐ด๓ ง๓ ข๓ ฅ๓ ฎ๓ ง๓ ฟ


                                            Weโre an information design and development agency crafting memorable data stories. Rooted in India with a global outlook. ๐ป https://revisual.co/  ๐ป 
#dataviz #informationdesign 


                                            Powerpoint by day, #ggplot2 by night. Here for dataviz and #rstats content and rants about football. ๐โฝ๏ธ
Based in Cologne, Germany.


                                            -Mapping the world- Dr. in Physical Geography | Environmental Health - bioclimatology - geography. RC Researcher from ๐ฉ๐ช at @mbgcsic.bsky.social @csic.es in ๐ช๐ธ #rstats #dataviz
Secretary of the @aeclim.org
๐Galicia 
โน๏ธ https://dominicroye.github.io


                                            ๐งโโ๏ธโจ๐ 
Independent Data Visualization Designer, Consultant & Instructor | available for projects and workshops
All things data & design with #rstats, #ggplot2, #Figma, #DataWrapper, #Flourish, and more
Co-Founder of the #30DayChartChallenge


                                            Pop Base is your best source for all pop culture related entertainment, news, award show coverage, chart updates, statistics and more. | email@popbase.tv


                                            The FTโs team of reporters, statisticians, illustrators, cartographers, designers, and developers work with colleagues across our newsrooms, using graphics and data to find, investigate and explain stories.
https://www.ft.com/visual-and-data-journalism


                                            Data visualisation consultant with an academic background, helping others maximise the impact of their expertise


                                            ๐ Statistician ๐ซถ #Rstats ๐ #Dataviz ๐โโ๏ธ Trail runner ๐ค Metalhead โค๏ธ Dad ๐ฅ #survivor ๐ Canberran ๐ฟ Vego
Survivor Stats db: https://survivorstatsdb.com/
Ramblings: https://gradientdescending.com/


                                            Freelance Data Visualization Specialist and Data Analyst. ๐ Book nerd๐. Always seeking new insights and knowledge๐กAvailable for Projects.
https://deepalikank.in/


                                            Dataviz designer, psychiatrist, PhD student
https://karaman.is