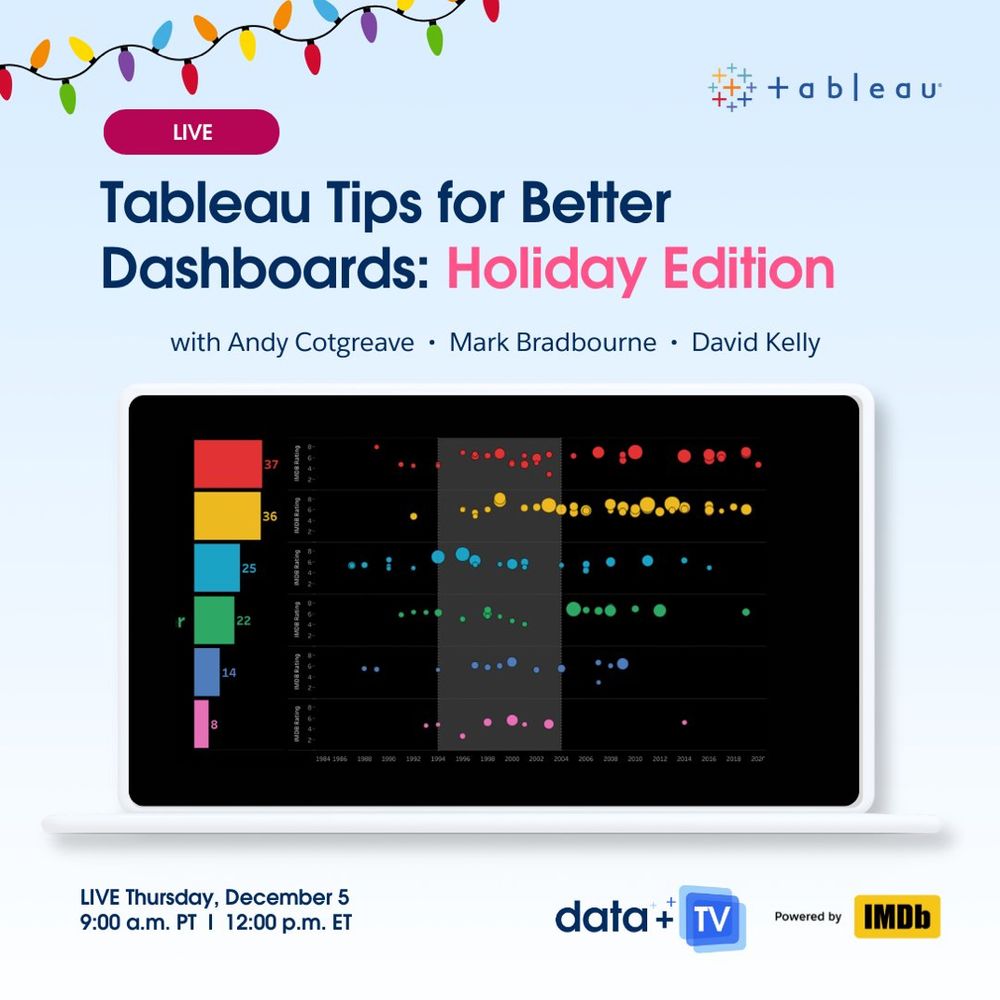
I’ve done a lot of behind the scenes work with the Tableau and IMDb datasets so I’m excited to be “on stage” for this weeks Data+TV live session alongside my pals @acotgreave.bsky.social and @markbradbourne.bsky.social
Join me LIVE on X 🎟️ x.com/tableau
02.12.2024 23:24 — 👍 13 🔁 4 💬 0 📌 0
I’m on now if you want to add me to the pack. Thanks for doing this, BTW. Makes getting up and running on the new app so much faster.
16.11.2024 17:18 — 👍 3 🔁 0 💬 1 📌 0
Information design and data visualization studio focused on the environment, social development, and governance.
Montreal (since 2013).
English and French
Interactives, dashboards, reports, presentations, training
Posts by Francis Gagnon, founder
Columnist and chief data reporter the Financial Times | Stories, stats & scatterplots | john.burn-murdoch@ft.com
📝 ft.com/jbm
Creator of 📰 News feeds, @xblock.aendra.dev, @moji.blue, founder of @shoots.green, co-organiser @atproto.london.
Opinions my own; not a journalist. I do datavis stuff sometimes.
she/her/ze/hir 🏳️⚧️
🌐 aendra.com
💻 github.com/aendra-rininsland
🗞️ ft.com/æ
The FT’s team of reporters, statisticians, illustrators, cartographers, designers, and developers work with colleagues across our newsrooms, using graphics and data to find, investigate and explain stories.
https://www.ft.com/visual-and-data-journalism
Digital humanities, data science, AI, eating, professor of Data & Decision Science and English. Coauthor #DataFeminism w/ @kanarinka. PI #AIAInetwork. Views my own.
Math, hockey, viz, apocrypha
Assoc Prof Computer Science and Communication Studies at Northwestern. Infovis, HCI. Author of tidybayes & ggdist R pkgs. he/him. 🏳️🌈 https://mjskay.com/
Co-director https://mucollective.northwestern.edu
Co-founder https://journalovi.org
Writing about tech, power, data visualization, social media, disability. Assistant prof of computational media @ MIT. 🇹🇼
crystaljjlee.com
Designer, journalist, and professor.
Author of 'The Art of Insight' (2023) 'How Charts Lie' (2019), 'The Truthful Art' (2016), and 'The Functional Art' (2012). NEW PROJECT: https://openvisualizationacademy.org/
Visual perception and cognition scientist
(he/him)
My site: http://steveharoz.com
R guide: https://r-guide.steveharoz.com
StatCheck Simple: http://statcheck.steveharoz.com
Into creative ML/AI, NLP, data science and digital humanities, narrative, infovis, games, sf & f. Consultant, ds in Residence at Google Arts & Culture. (Lyon, FR) Newsletter arnicas.substack.com.
— Founder of Our World in Data
— Professor at the University of Oxford
Data to understand global problems and research to make progress against them.
Climate scientist, geologist, and catastrophe modeler, Liberty Mutual. Posts on all things hurricane, wildfire, flood, earthquake, tornado. Sassy takes are mine not employer's.
📍Oakland, CA
Website: hereidk.strikingly.com
Writing stuff in upstate New York. Formerly: Minnesota Reformer, Washington Post, Brookings, Pew. Orange cat evangelist. Ask me about my swamp.
Graphics editor at Scientific American • Author of Building Science Graphics https://www.buildingsciencegraphics.com/ • Formerly at National Geographic
Axios managing editor for data viz, previously at Pew Research
My favorite things are quilts, birds, books and maps
Solopreneur @ IndieVisual
Data geek who loves problem solving
Rambles about fitness & random stuff too
https://indievisual.tech
🧙♂️✨📊
Independent Data Visualization Designer, Consultant & Instructor | available for projects and workshops
All things data & design with #rstats, #ggplot2, #Figma, #DataWrapper, #Flourish, and more
Co-Founder of the #30DayChartChallenge
Data Visualization. Ex-Planet & NASA Earth Observatory. Blue Marble, Earth at Night, color, cartography, occasionally skewed views of Earth. Looking for a job.