Today, we published our Q3 global power report which also found that 2025 is likely to be the first year since the Covid-19 pandemic without an increase in fossil generation
bsky.app/profile/nico...
13.11.2025 11:12 — 👍 7 🔁 2 💬 0 📌 1

NEW DATA | Solar generation in 2025 has already exceeded the 2024 total as of September ☀️⚡️
A 31% increase in Q1-Q3 2025, has pushed solar beyond the full year output for 2024, with three months left in 2025.
13.11.2025 11:12 — 👍 16 🔁 3 💬 1 📌 0

The central player so far in 2025 is once again solar, dwarfing changes from other sources ☀️
The yoy increase of 498 TWh in Q1-Q3 was three times larger than the next biggest increase from wind.
Solar's rise is in stark contrast to stagnating fossil generation.
13.11.2025 08:36 — 👍 5 🔁 0 💬 1 📌 0

Our latest power sector analysis out today shows that in the first three quarters of 2025, solar and wind exceeded the growth in electricity demand globally.
Combined with an increase in nuclear generation and falls in hydro power, fossil generation saw a minor decline in Q1-Q3.
13.11.2025 08:36 — 👍 12 🔁 3 💬 1 📌 0

NEW | No growth for fossil fuels in global electricity generation expected in 2025 🔥❌
Ember forecasts no increase in fossil generation as wind and solar are growing fast enough to meet all new electricity demand.
13.11.2025 08:36 — 👍 110 🔁 34 💬 3 📌 5

NEW data | Less than 50% of Australia's electricity generation came from fossil fuels in October 🇦🇺⚡️
This was the first month ever where renewables have overtaken fossil fuels in Australia's electricity mix.
10 years ago, in October 2015, fossil fuels made up 86%.
10.11.2025 11:07 — 👍 87 🔁 25 💬 1 📌 1

LATEST DATA | Strong solar additions and favourable hydro conditions in China pushed coal power down 5.4% in September compared to 2024 🇨🇳⚡️
Year-to-date, coal power remains down 1.4%.
28.10.2025 16:59 — 👍 10 🔁 1 💬 0 📌 0
We will see more records as we are now moving into the shoulder months where solar output remains high, but demand is lower than in summer months.
The previous record for battery share of load was set in April.
13.10.2025 15:28 — 👍 6 🔁 0 💬 1 📌 0

Another new record for batteries in California 🔋⚡️
Batteries met a record high 37.2% of load at 6:25pm yesterday, Oct 12.
The share of load remained at >30% for two whole hours from 5:50 to 7:50 during peak demand and discharged late into the night, reducing gas and imports.
13.10.2025 15:28 — 👍 21 🔁 3 💬 2 📌 1

NEW | EU solar generation has already exceeded its 2024 total as of September ☀️🇪🇺
Solar is by far the fastest growing source of electricity in the EU, up 20% year-on-year.
11.10.2025 10:10 — 👍 16 🔁 11 💬 1 📌 0

NEW DATA | For the first time ever, wind and solar produced more than 50% of the UK's electricity ☀️🍃🇬🇧
🏆 In September, wind and solar generation reached a share of 50.4%
Both wind and solar generation also reached new absolute output records for the month of September:
Wind: 7.7 TWh
Solar: 1.7 TWh
09.10.2025 17:52 — 👍 46 🔁 10 💬 1 📌 1

NEW @ember-energy.org report out today | Renewables now produce more electricity than coal worldwide ⚡️
Renewables produced 5,072 TWh (34.4% share) in the first half of 2025 overtaking coal for the first time which stood at 4,896 TWh (33.1%.)
07.10.2025 16:10 — 👍 19 🔁 6 💬 1 📌 1

More than 5% isn't possible...more than 10% isn't possible...
Solar was already at 8.8% of GLOBAL electricity generation in the first half of 2025, more than doubling since 2021 (3.8%). ☀️
I guess 30% is the new limit??
🇭🇺Hungary: 29.7%
🇬🇷Greece: 26.3%
🇳🇱Netherlands: 25.7%
07.10.2025 15:20 — 👍 28 🔁 10 💬 5 📌 1

However, even periods of low demand growth would have not led to substantial fossil fuel falls in the past in India.
The difference now? Record growth in wind and solar generation.
07.10.2025 07:15 — 👍 10 🔁 0 💬 1 📌 0

The slow demand growth was caused by temperature differences between 2025 and 2024.
2024 saw record heatwaves push up cooling demand, but 2025 has been much milder. This moderated demand growth, sometimes even dropping below 2024 levels, a rare sight in India's steadily growing power sector.
07.10.2025 07:15 — 👍 4 🔁 0 💬 1 📌 0
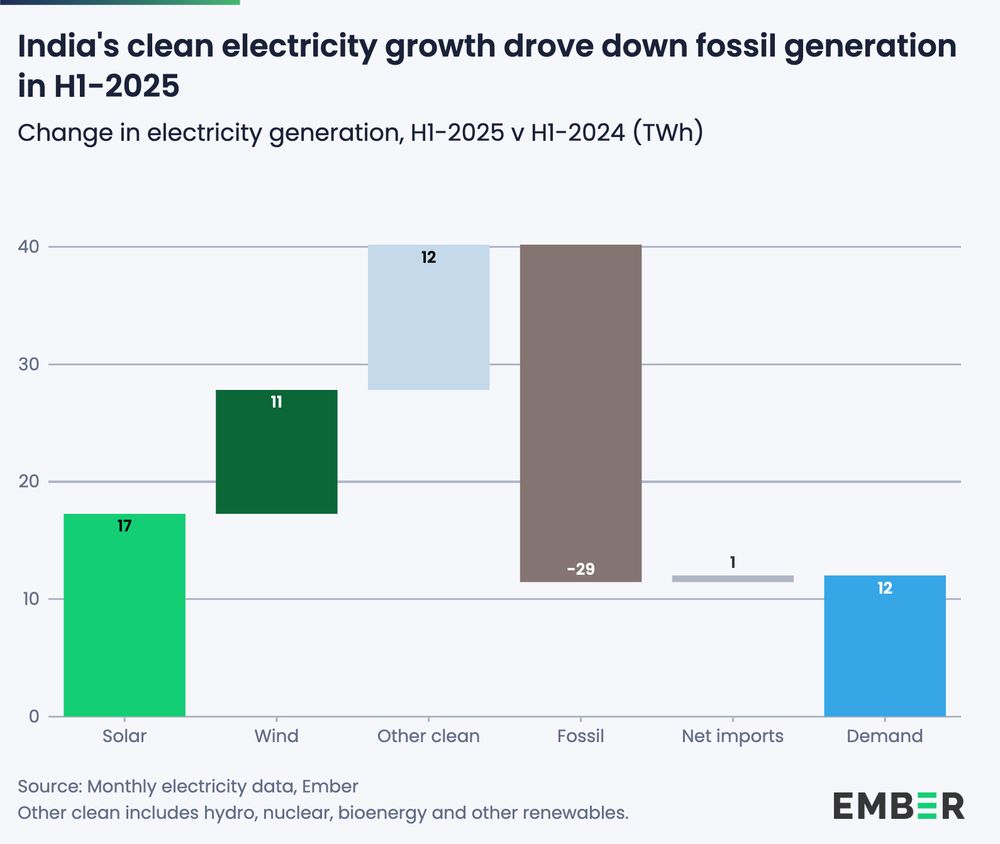
In India, record solar and wind growth combined with favourable hydro conditions to drive fossil generation down substantially. However, electricity demand increased by just 1.3% compared to a 9% increase in H1-2024.
07.10.2025 07:15 — 👍 4 🔁 0 💬 1 📌 0
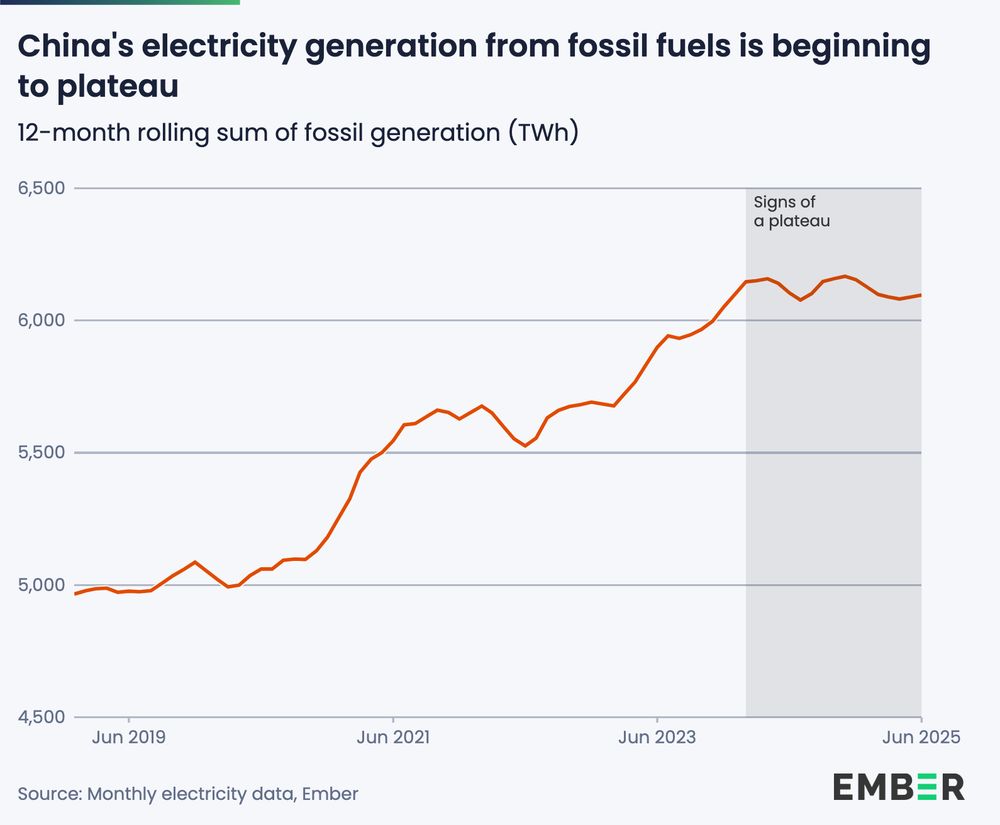
The first half of 2025 is the continuation of a flattening out of fossil generation in China.
Fossil power has plateaued since early 2024 as solar and wind have been matching or growing faster than electricity demand.
07.10.2025 07:15 — 👍 5 🔁 0 💬 1 📌 0

The fall in fossil generation in India and China had slightly different reasons.
In China, low-carbon power growth from solar, wind (and some nuclear) was higher than the increase in electricity demand, despite a small fall in hydro generation. This led to a decline in coal.
07.10.2025 07:15 — 👍 4 🔁 0 💬 1 📌 0
The continued rapid growth of solar generation meant that renewables overtook coal for the first time.
Coal generation dipped slightly compared to the first half of 2024, with renewables continuing to grow.
07.10.2025 07:15 — 👍 16 🔁 6 💬 1 📌 0

On a global level, wind and solar met and exceeded the growth in electricity demand, particularly as a result of record breaking solar growth.
A fall in hydro negated some of the growth in solar, wind and nuclear, but fossil fuels still saw a small decline.
07.10.2025 07:15 — 👍 45 🔁 8 💬 1 📌 1

NEW | Electricity generation from fossil fuels fell in China and India in the first half of 2025 🔥📉
This marks a reversal from previous trends.
Simultaneously, there was a small uptick in the US and in the EU.
A thread 🧵
07.10.2025 07:15 — 👍 65 🔁 15 💬 3 📌 4

The new data explorer also includes a full breakdown of every technology by country.
06.10.2025 08:22 — 👍 6 🔁 1 💬 1 📌 0
Working to move Ontario towards a 100% renewable energy future by tripling wind and solar, investing in conservation and efficiency, and cooperating with Hydro Quebec.
#renewables
https://linktr.ee/ontariocleanairalliance?fbclid=IwY2xjawIZtilleHRuA2FlbQI
Chief Executive of @solarenergyuk.bsky.social Lifelong environmentalist focused on climate, nature and a green economy. Finding and espousing hope in the world, because there is a lot out there. Views my own.
A climate action advocate running on a drained battery.
I tried to convince y'all that the constant criticism of Democrats was going to put the GOP back in charge, but oh well here we are.
Supporting Democrats is a lot better than living under GOP rule.
Climate take farmer for Bloomberg Opinion
Data and visual journalist, New York Times climate team
https://www.nytimes.com/by/mira-rojanasakul
Director of the Electrification Alliance. Representing the major actors in delivering European energy to European homes and industry. 🇨🇦 🇮🇪
https://electrification-alliance.eu/
⚡️Tampa Bay's Congresswoman⚡🌴🌤🌅 🇺🇸 People Over Politics! 🇺🇸 former Chair of the Select Committee on the Climate Crisis 🇺🇸 #FL14
Independent journalist, SnapStream brand ambassador, and publisher of the Public Notice newsletter https://www.publicnotice.co/subscribe
Democratic strategist. Formerly Long Island Campaign Chair for Barack Obama; Majority Leader of the Suffolk County Legislature. Gay dad of five terrific kids. Writer and producer of echoesoftheunknownpodcast.com. Coffee addict. New York/Florida.
Proudly woke lefty, volunteer with CAB and Samaritans, excited about the next stage of life after 30 years in recruitment. Football, video games and politics #YNWA
All things blue sky from Leipzig University's experts on weather, climate & society 🌍 🏳️🌈🏳️⚧️🌪⛈🌤☀️
#ClimateAttribution #PolarClimateChange #Clouds&Climate #ClimComms
https://www.physes.uni-leipzig.de/institut-fuer-meteo
Building powerful, transparent and accessible energy systems modelling software | London, UK
Husband and father. Proudly serving as Illinois’ 43rd governor.
Physicist, educator, number-cruncher. Cartoon by the great Cal Grondahl. physics.weber.edu/schroeder
Co-founder of The Solar Foundation: New tech + local partnerships to accelerate access to solar power for off-grid communities in Africa☀️Radical imagination, inspiration & action for building a flourishing future on a thriving planet🌍💚
Working in data viz and generative design. Data Visualisation & Information Design Lead, City Intelligence Unit, London City Hall. Also @mikebrondbjerg@vis.social
staff writer @theatlantic.com and senior fellow @snfagora.bsky.social. author of GULAG, IRON CURTAIN, RED FAMINE, TWILIGHT OF DEMOCRACY and AUTOCRACY INC
https://linktr.ee/anneapplebaum
Econ professor at Michigan ● Senior fellow, Brookings ● Intro econ textbook author ● Think Like An Economist podcast ● An economist willing to admit that the glass really is half full.
News about the status of our changing climate and environment and the actions being taken to mitigate the risks of climate change. Main areas of focus are on climate politics, climate data, ecological research and renewable energy. 🌏