A yellow "caution wet floor" standee. The bottom is flared so it looks like a banana peel.

Standee, deployed
This object is a legitimate masterpiece of design
08.02.2026 19:32 — 👍 5284 🔁 1146 💬 33 📌 23
@nigelblue.bsky.social
explanation graphics; author (latest: let’s get Infografit, 2025); happy to be alive! working on a book about visual language…perhaps ready in 2026
A yellow "caution wet floor" standee. The bottom is flared so it looks like a banana peel.
Standee, deployed
This object is a legitimate masterpiece of design
08.02.2026 19:32 — 👍 5284 🔁 1146 💬 33 📌 23
It's time for a truly massive general strike. https://robertreich.substack.com/p/sunday-thought-enough
25.01.2026 15:12 — 👍 14399 🔁 4694 💬 599 📌 311
In the newsletter: The Open Visualization Academy is almost here. We launch next week; save the date! openvisualizationacademy.beehiiv.com/p/the-open-v...
#dataViz #infographics #dataJournalism


Now I'm finally here at Bluesky :).
The cult magazine is back. The new INGRAPHICS magazine has been available to buy for a few weeks now.
INGRAPHICS is a magazine for visual thinkers. It is published in English once a year. www.schwochow.shop
#SciArt #DataViz 🧪
16.12.2025 14:35 — 👍 6 🔁 3 💬 0 📌 0hi jen, it was lovely to see you; hope your interview went well…i think mine did!
12.12.2025 16:39 — 👍 1 🔁 0 💬 0 📌 0What an unexpected treat! I bumped into the one and only @nigelblue.bsky.social in the lobby at Informa in NYC today. We’re both filming videos related to our CRC books on information graphics. Nigel always brings a smile to my face.
12.12.2025 15:19 — 👍 4 🔁 1 💬 1 📌 0
let's get infografit book with Santa Claus hat
going to overeat at Christmas? Work it off with my new book as your guide! letsgetinfografit.com
04.12.2025 20:17 — 👍 7 🔁 5 💬 0 📌 1Can't recommend this highly enough (you can skip the page where @nigelblue.bsky.social highlights me and my drums 🤣)
04.12.2025 21:11 — 👍 2 🔁 1 💬 0 📌 0
let's get infografit book with Santa Claus hat
going to overeat at Christmas? Work it off with my new book as your guide! letsgetinfografit.com
04.12.2025 20:17 — 👍 7 🔁 5 💬 0 📌 1in england it’s always grey (in more than one sense)
23.11.2025 12:41 — 👍 0 🔁 0 💬 1 📌 0
Liking DIGITAL DIAGRAMS (2000) by Diagram Group’s Trevor Bounford much more than expected—And not just because it showcases lots of @nigelblue.bsky.social but that’s always a plus!
13.11.2025 15:51 — 👍 5 🔁 1 💬 0 📌 0some of the contributors to my book are getting their copies already…and i haven’t seen it yet! rowland did a beautiful website for it: www.letsgetinfografit.com
have a look!
…and thanks to the careful and hardworking art department staff for those little runarounds!
03.09.2025 18:02 — 👍 1 🔁 0 💬 0 📌 0

my university's library sorts out old Time magazines, bound by year. And look! @nigelblue.bsky.social
03.09.2025 08:15 — 👍 22 🔁 3 💬 1 📌 0thanks ken, of course i know why you ordered it…you’re in it! but thanks for the nice words!
16.08.2025 12:36 — 👍 2 🔁 0 💬 1 📌 0
my book Let’s Get infografit is almost out (pub date sept 5); you can pre-order it at routledge/crc press and amazon. the preview there is for the ebook version; not quite the same as the real thing! oh well…here’s the cover:
14.08.2025 21:12 — 👍 19 🔁 3 💬 0 📌 2great book about an oddly great guy!
25.07.2025 13:14 — 👍 3 🔁 0 💬 1 📌 0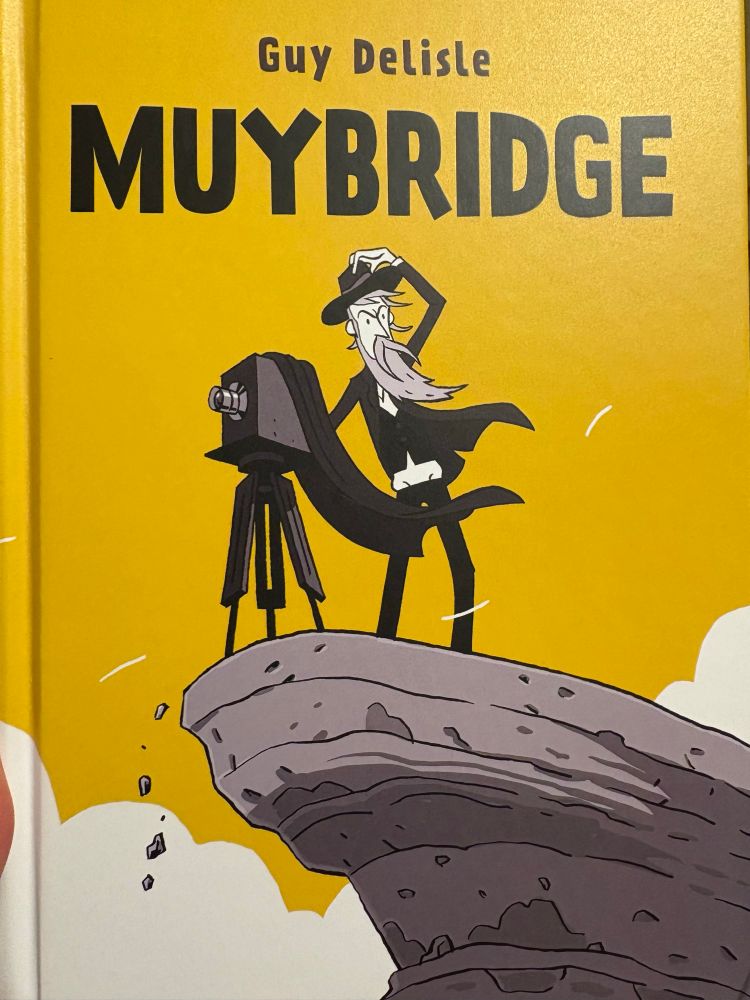
Cover to muybridge
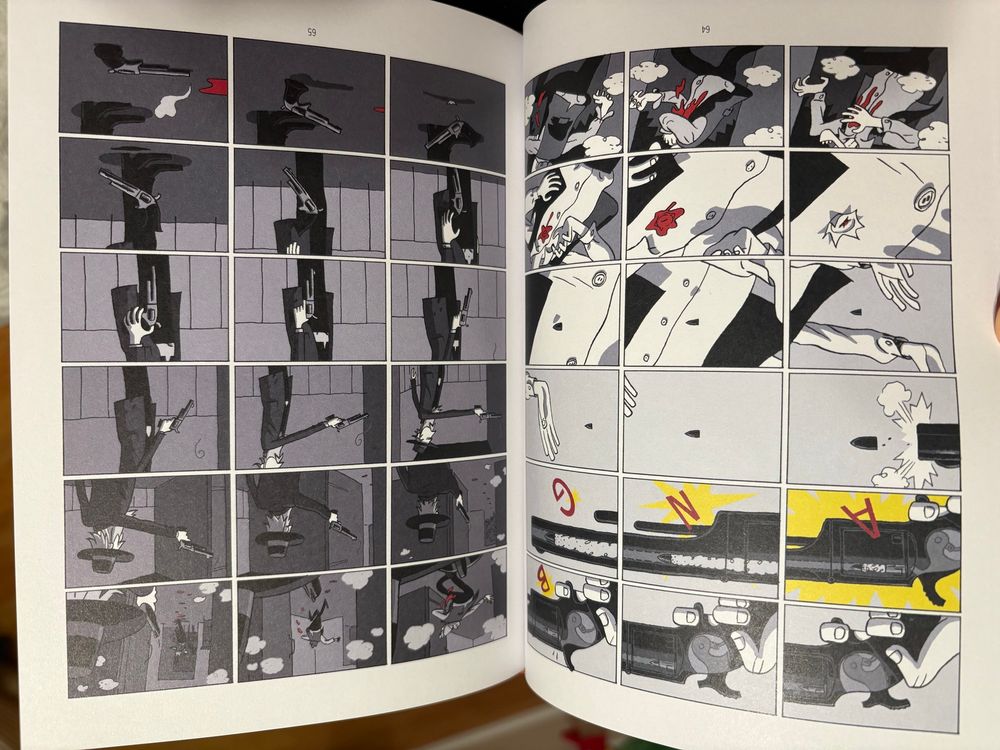
Interior of muybridge
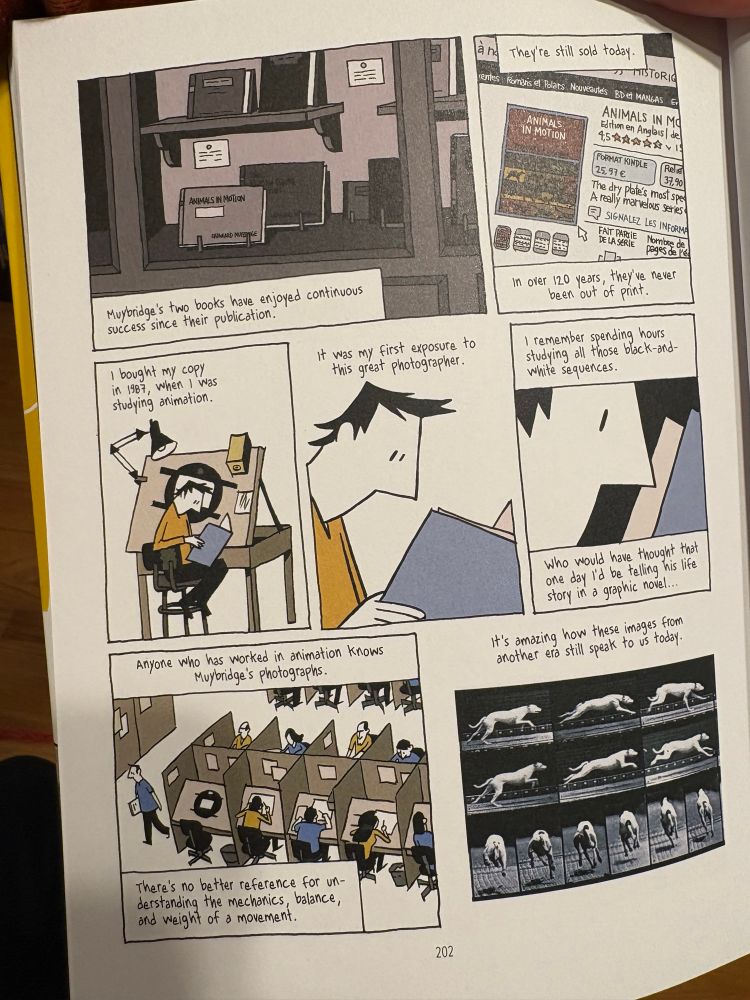
Interior of muybridge
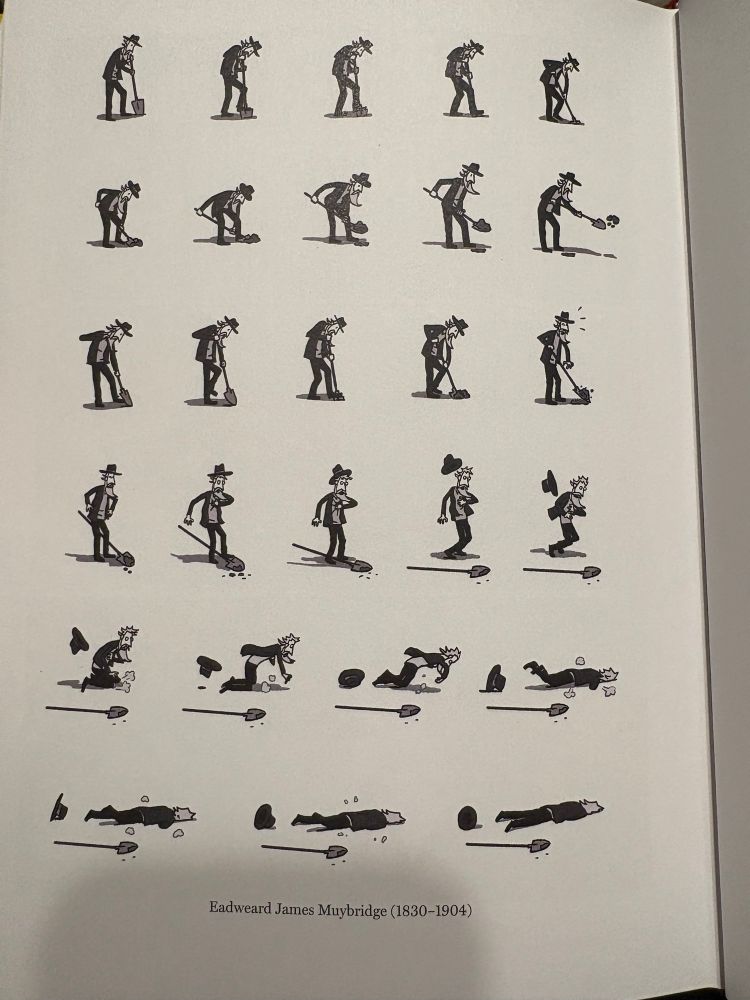
Interior of muybridge
This was an absolutely great book! An amazing story, Guy Delisle dug deeply into the challenges, triumphs & horrific moments of Muybridge’s life, I learned a ton, was captivated for all of it. My dad got it first recommended - I hadn’t heard of it. Def recommend! From @dandq.bsky.social great stuff!
17.07.2025 23:53 — 👍 133 🔁 18 💬 6 📌 5Combine Einstein (simple but not too simple) and @nigelblue.bsky.social (it's not about simplifying, it's about clarifying). Instead of simplifying q.b. and clarifying, you have a tool that forces you to go simpler and without options to clarify. It's unfixable, hence the cardification.
07.07.2025 20:16 — 👍 4 🔁 1 💬 0 📌 0congratulations! well deserved.
11.05.2025 12:09 — 👍 0 🔁 0 💬 0 📌 0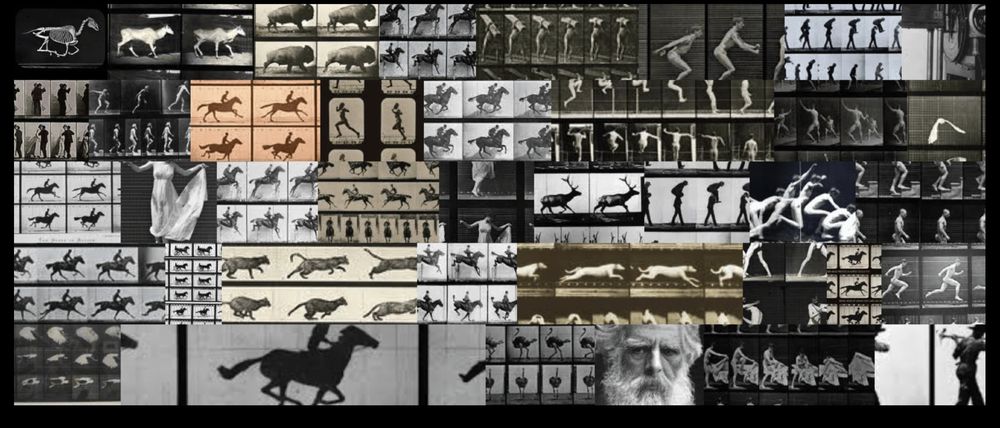
Photo quilt of Muybridge images. It shows people walking, running or jumping and several sets of horses racing
The famous 1878 Horse in Motion, a set of 12 images of a race horse, Sally Gardner, at the race track in Palo Alto CA. The goal was to answer the burning question of _unsupported transit_: Is there any stage in a gallop when the horse has all 4 feet off the ground. See if you can find the frame that proves this.

A selfie photo of Eadweard Muybridge
#TodayinHistory #dataviz #OTD 📊
💀May 8, 1904 Eadweard Muybridge died in Kingston upon Thames, England 🇬🇧
~ 1875 he developed a system for motion photography from a series of frames & pioneered the study of motion in humans and animals --a precursor of moving pictures & animated graphics.

The American Eagle, in the style of a crashed airplane
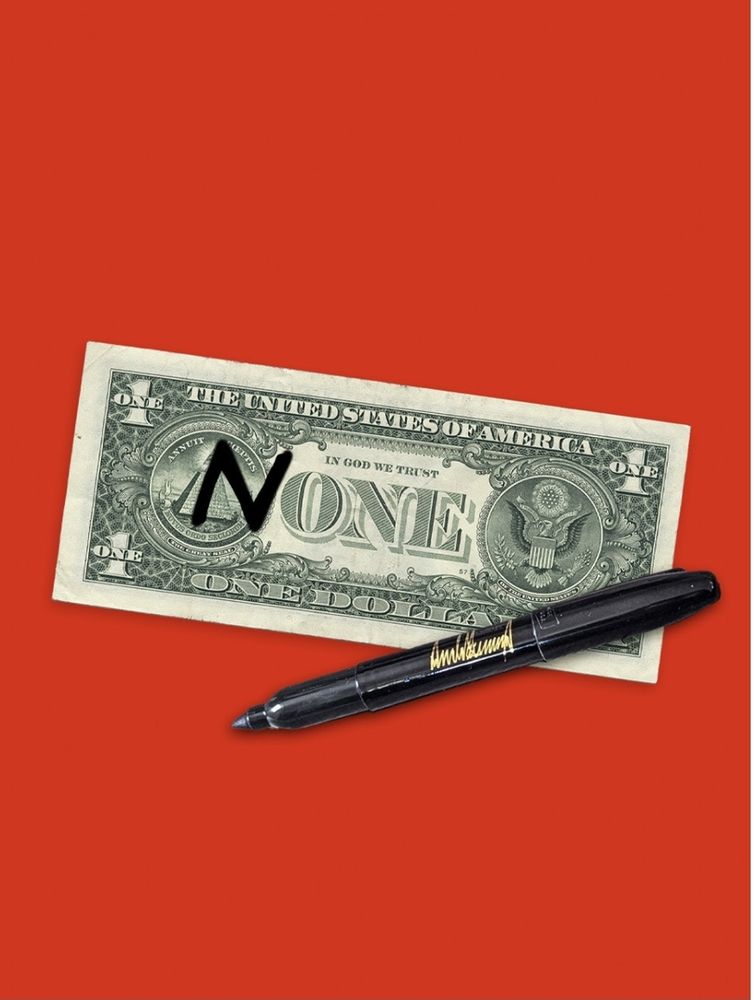
A dollar bill, with an N written in Sharpie in front of the ONE
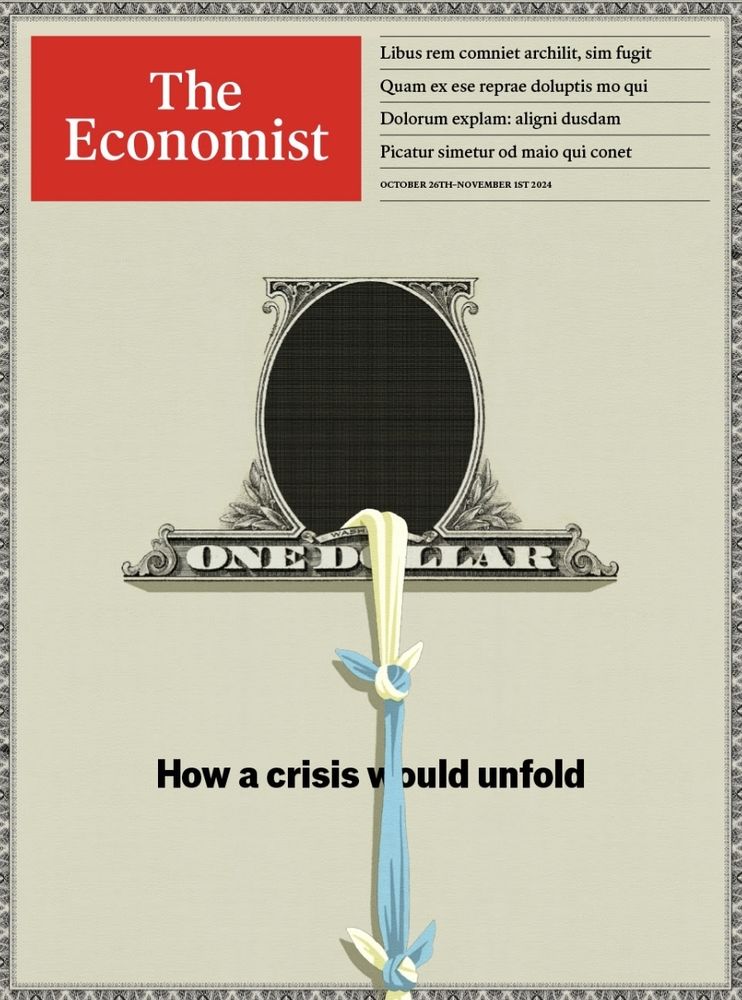
George Washington escaping from the dollar bill using knotted sheets
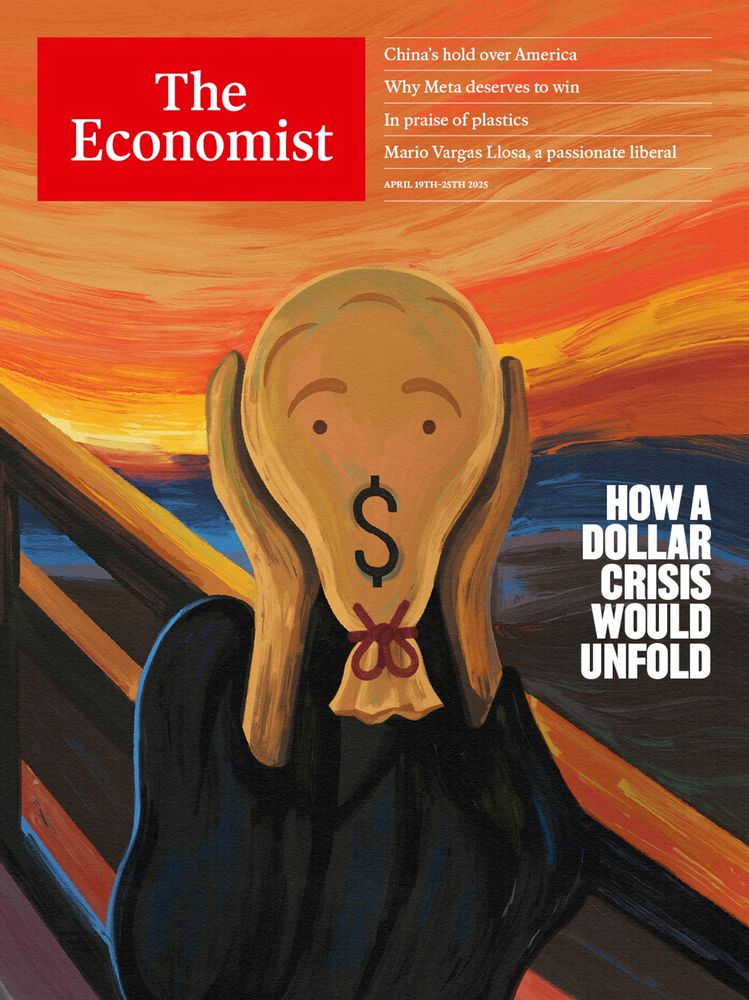
Final cover, in the style of The Scream
Some of the nice ideas that didn't make the cover of The Economist this week, and the one that did
economist.com/newsletters/cover-story
Setting spotlights on @kennethfield.bsky.social and @nigelblue.bsky.social
16.04.2025 15:59 — 👍 6 🔁 1 💬 0 📌 1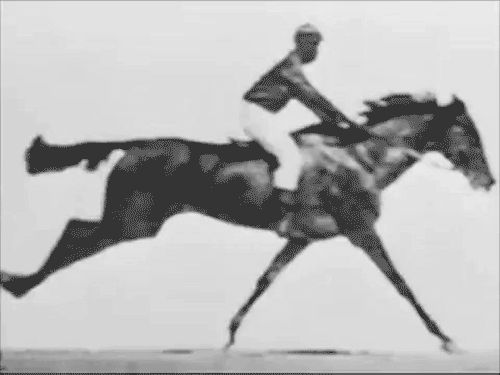
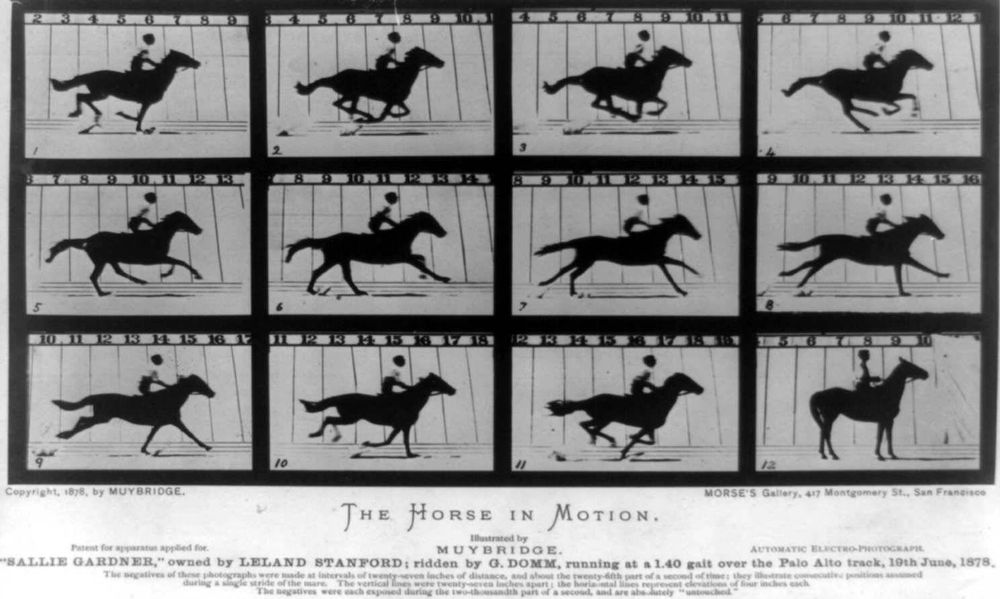
Animated version of Muybridge's The Horse in Motion
And here it is in motion. Can you spot where it is that the horse has all 4 feet off the ground? Leland Stanford made a bunch of money on this bet; Muybridge provided the proof.
09.04.2025 01:12 — 👍 1 🔁 1 💬 0 📌 0
Photo quilt of Muybridge images. It shows people walking, running or jumping and several sets of horses racing
The famous 1878 Horse in Motion, a set of 12 images of a race horse, Sally Gardner, at the race track in Palo Alto CA. The goal was to answer the burning question of _unsupported transit_: Is there any stage in a gallop when the horse has all 4 feet off the ground. See if you can find the frame that proves this.
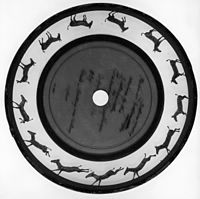
Muybridge;s Zoopraxiscope, a circular device for arranging a set of still pictures to create the impression of motion.
Photo of Eadweard Muybridge, with a long white beard
#TodayinHistory #dataviz #Onthisday #OTD 📊
🎂Apr 9, 1830 Eadweard Muybridge born in Kingston upon Thames, England 🇬🇧
Muybridge pioneered the use of photography in the study of motion, a precursor of moving pictures & animated graphics.

"charts have meaning that works for everyone"—Thank you Steven Heller! www.printmag.com/daily-heller...
08.04.2025 13:46 — 👍 5 🔁 2 💬 0 📌 0
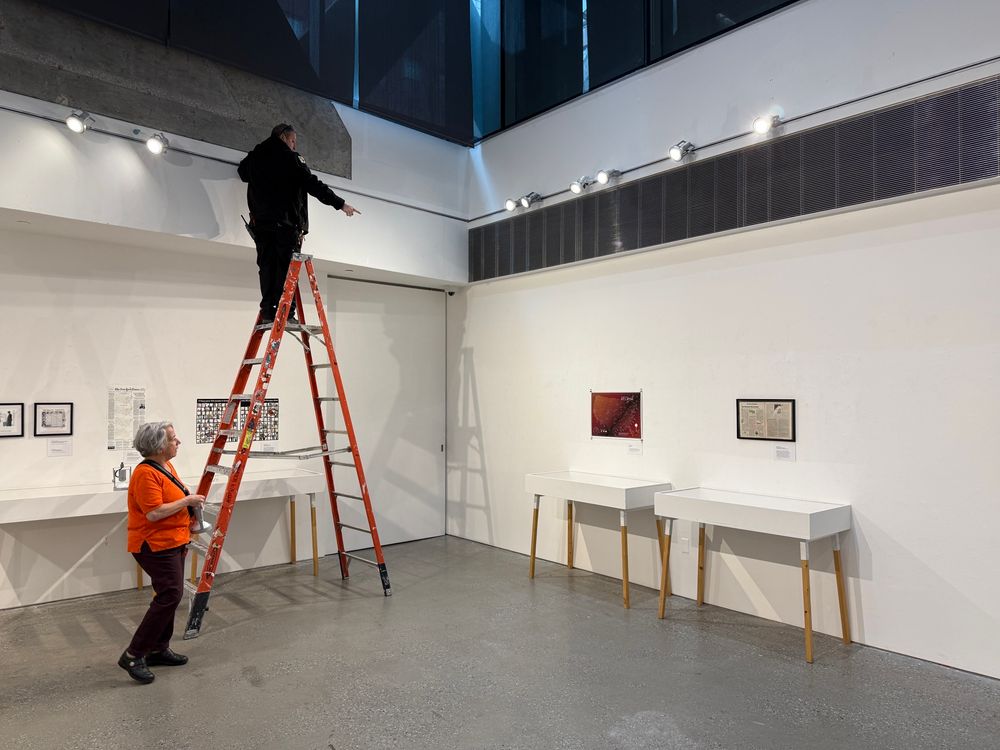
Making information graphics is a craft—a handmade, rational, and optimistic pursuit that expands our knowledge and empowers our actions. The west side of the exhibition traces an intimate path through Info We Trust (Visionary Press, 2025) with text, original artwork, and enlarged illustrations by author RJ Andrews. Together, they underscore how data storytelling is both an art and a science, bridging imagination and evidence. In parallel on the east side, the exhibition broadens its lens to celebrate the field of information design as a whole. Works by leading contemporary designers showcase today’s expanding visual vocabulary alongside historic examples chosen for aesthetic and thematic resonance. Each piece reflects a belief that information, when generously made for the audience, can illuminate and inspire. See how designers past and present wrangle the chaos of data into intriguing forms bursting with clarity. From rare charts to digital darlings, each artifact speaks to a shared pursuit: to reveal comparisons, provoke discovery, and carry us all to new shores of reality.
today I'm making the welcome placard for next week's exhibition at Cooper Union, featuring an insane collection of AMAZING information designers: @nadiehbremer.com @jenchristiansen.com @datavandals.bsky.social @kennethfield.bsky.social @nigelblue.bsky.social @shirleywu.studio & many more
07.04.2025 20:49 — 👍 12 🔁 3 💬 0 📌 3
Background: in my last post, I speedwalked through millennia of science and history in the intersection of writing and art
03.04.2025 14:04 — 👍 3 🔁 2 💬 1 📌 0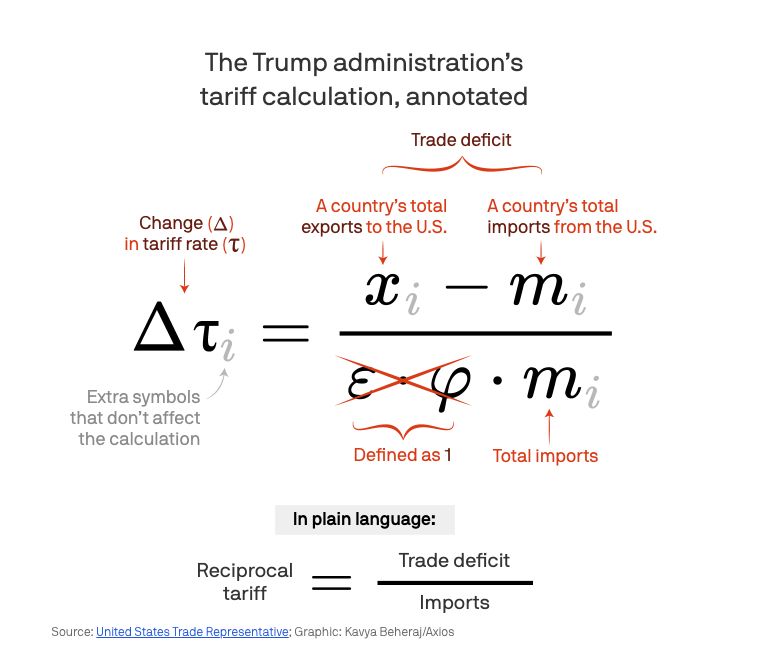
An incredible explainer on the "tariff formula" from @felixsalmon.com @axios.com
03.04.2025 21:23 — 👍 57 🔁 19 💬 2 📌 5